User Guide for GridDB Grafana Input Plugin
Revision: 1.6.0-10082-768e556f
1 Overview
GridDB input plugin for Grafana is used to get data from GridDB and display it as a graph or table on Grafana.
1.1 Requirements
The GridDB input plugin has the following requirements:
For a Grafana user with a server or organization administration role, refer to Permissions.
A GridDB server must have at least one GridDB user.
1.2 Known limitations
N/A
2 Installation
2.1 Installing Grafana
Refer to Grafana installation.
2.2 Installing the GridDB input plugin
2.2.1 How to build
Install Node.js and npm by referring to Downloading and installing Node.js and npm.
Go to $GRAFANA_HOME where the file
package.jsonexists and run the commands below:
2.2.2 How to install
1. Go to $GRAFANA_HOME/plugins-bundled/internal/input-datasource and create a new folder GridDB-plugin.
2. Copy the folder dist in the GridDB plugin to the folder GridDB-plugin.
3. Restart your Grafana server.
2.3 Adding a GridDB data source
📝 If your Grafana server is behind a proxy server, it is necessary to configure the proxy by setting the environment variables before connecting to GridDB.
- Set the environment variables for proxy configuration (if needed).
- Go to $GRAFANA_HOME/bin and run grafana-server.
- Open a browser and go to the address "localhost:3000."
- Log in to Grafana with the username and password for Grafana. If it is your first login, the default username/password is admin/admin.
- Change the password (if it is your first login).
- Open the side menu by clicking the Grafana icon in the top header.
- In the side menu under the Configuration link, click the link named Data Sources.
- Click the + Add data source button in the top header.
- Enter
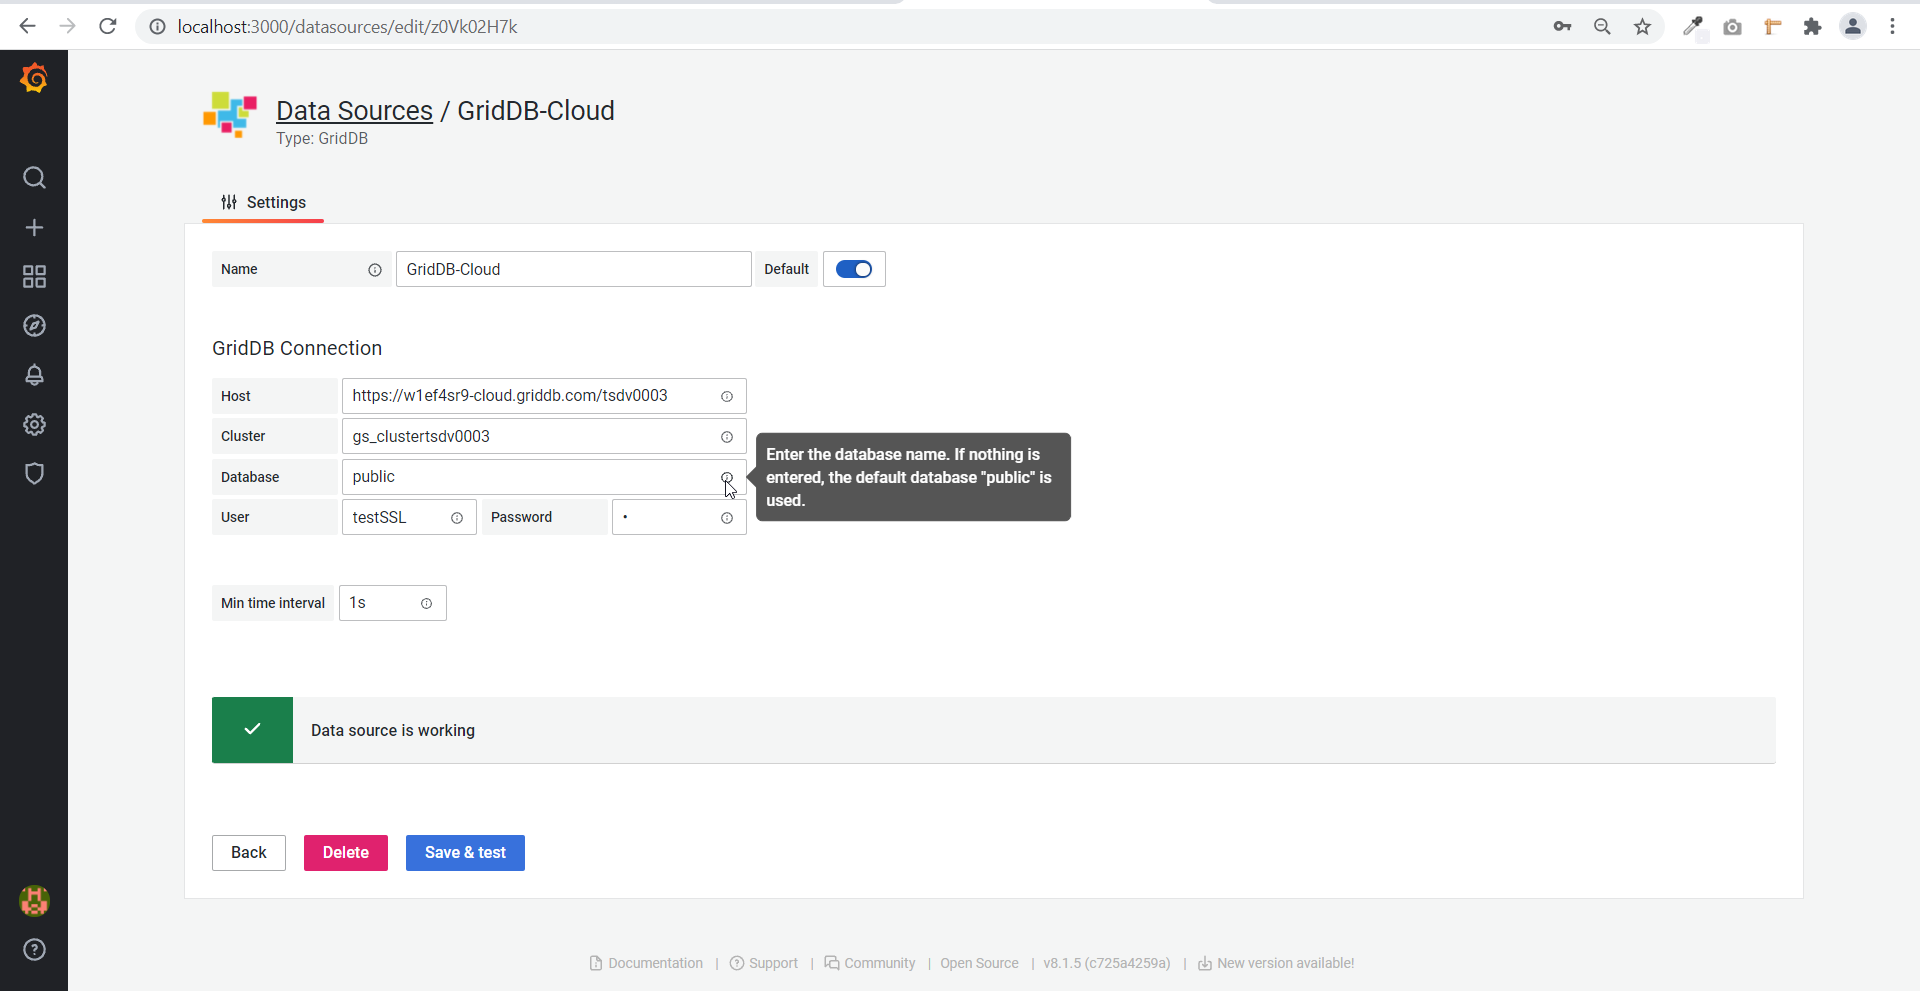
GridDBin the search field. EnsureGridDBis shown for the data source and click the Select button. - Enter any data source name (e.g., GridDB-Cloud) in the Name field.
- Enter the GridDB Web API URL in the host field in the GridDB Connection section. Do not include the context path such as "/griddb/v2."
- Enter the cluster name for GridDB.
- Enter the database name. If nothing is entered, then the default database "public" is used.
- Enter the username and password of a GridDB user with the READ permission for the database specified in Step 13.
- Enter a value for the min time interval. The default is 1 second.
- Click the Save & test button to check a connection to GridDB.
3 Preparing data
Here we create three containers.
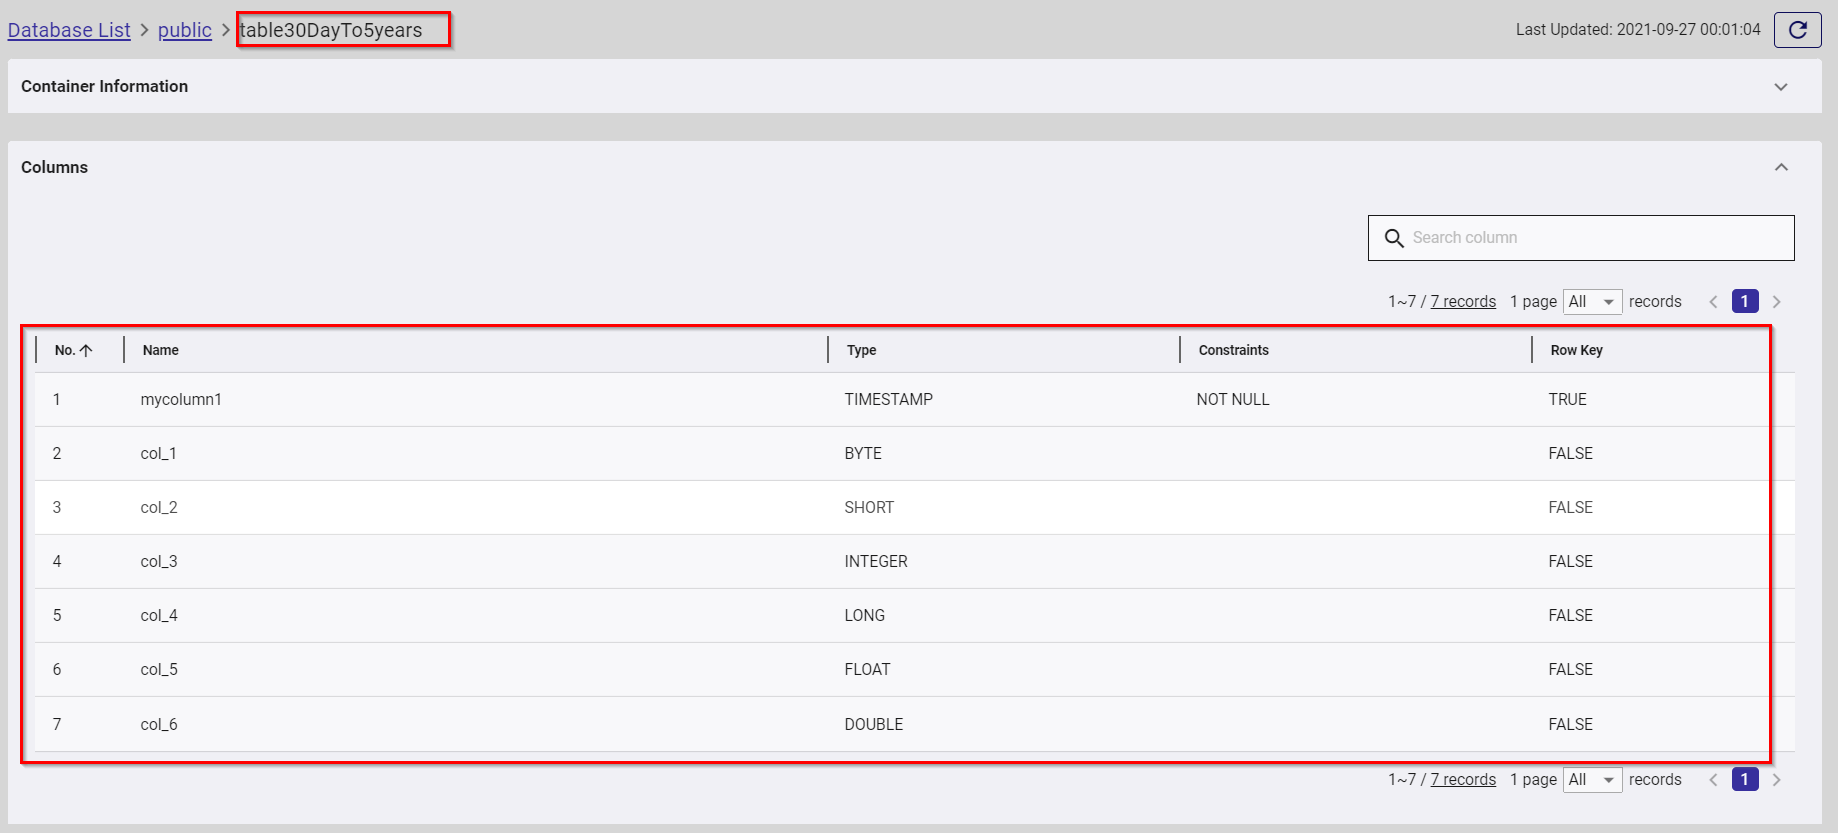
- Create the first container.
Container name: table30DayTo5years
Container type: TIMESERIES
Container schema:
| Name      | Type           | Constraints    |
|---------  |-----------     |-------------   |
| mycolumn1 | TIMESTAMP      | NOT NULL       |
| col_1     | BYTE           |                |
| col_2     | SHORT          |                |
| col_3     | INTEGER        |                |
| col_4     | LONG           |                |
| col_5     | FLOAT          |                |
| col_6     | DOUBLE         |                |
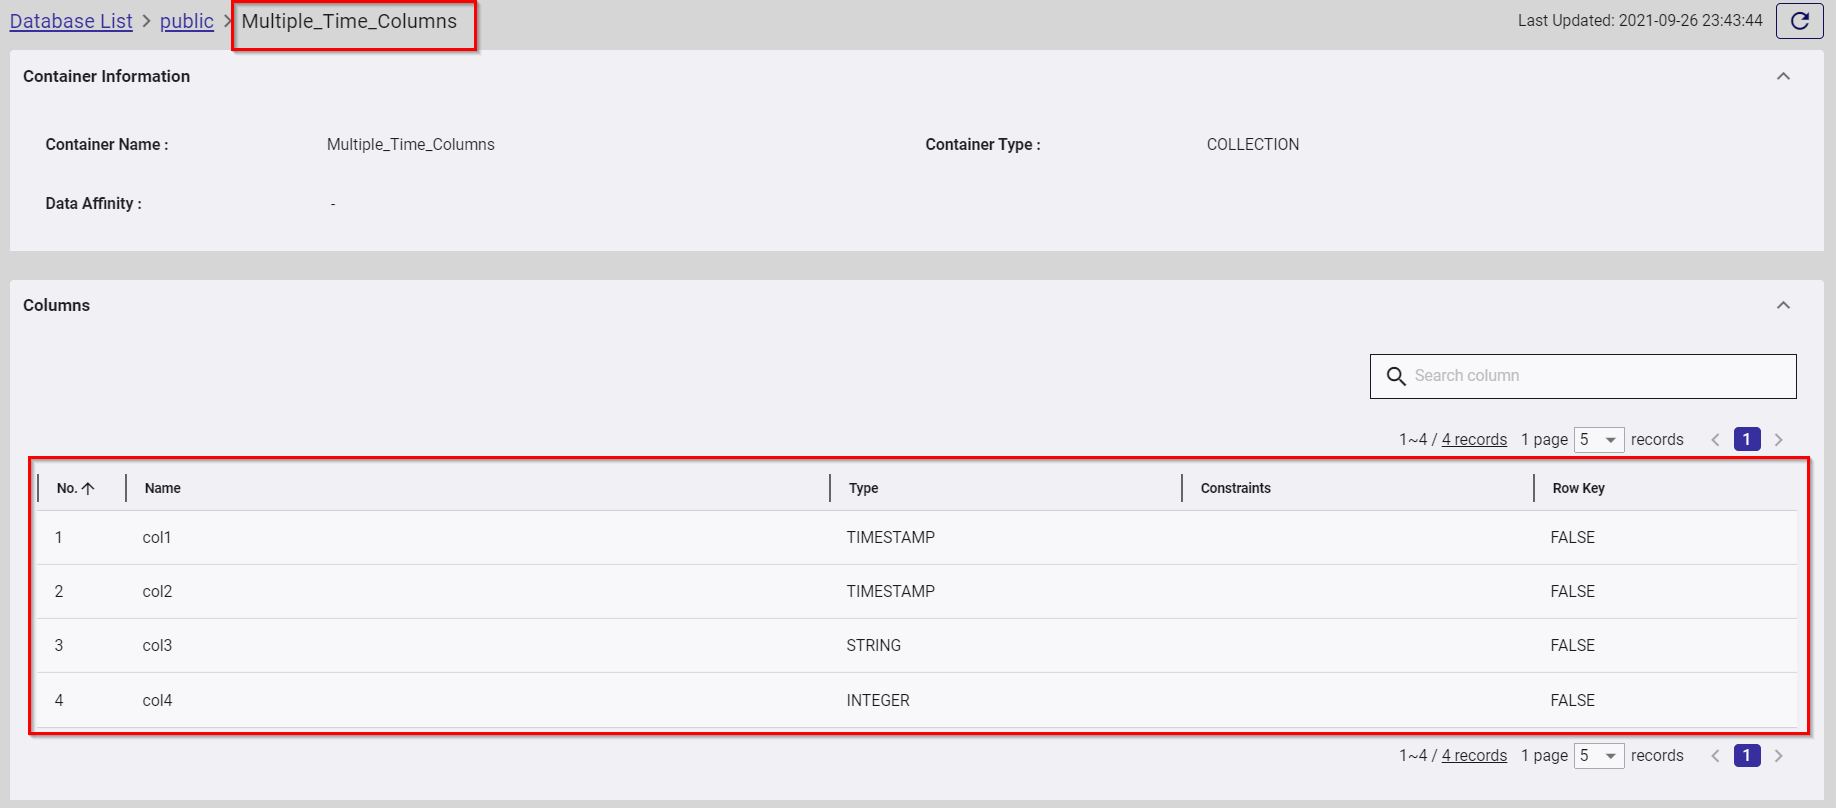
- Create the second container.
- Container name: Multiple_Time_Columns
- Container type: TIMESERIES
- Container schema:
| Name      | Type           | Constraints  |
|---------  |-----------     |------------- |
| col1      | TIMESTAMP      | NOT NULL     |
| col2      | TIMESTAMP      |              |
| col3      | STRING         |              |
| col4      | INTEGER        |              |
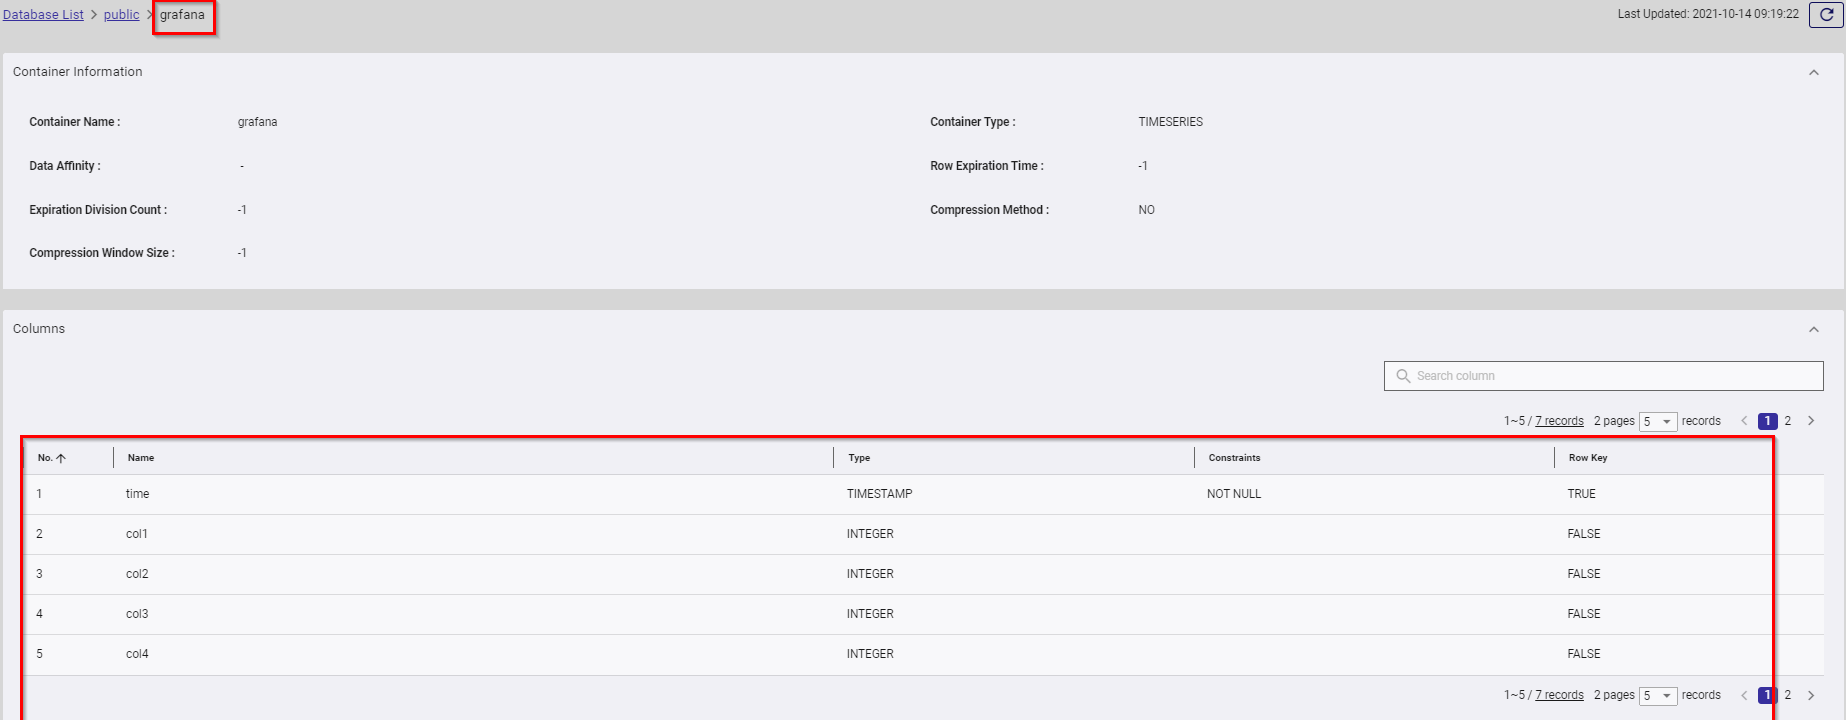
- Container name: grafana
- Container type: TIMESERIES
- Container schema:
| Name      | Type           | Constraints  |
|---------  |-----------     |------------- |
| time      | TIMESTAMP      | NOT NULL     |
| col1      | INTEGER        |              |
| col2      | INTEGER        |              |
| col3      | INTEGER        |              |
| col4      | INTEGER        |              |
| col5      | INTEGER        |              |
| col6      | INTEGER        |              |
4 Visualization
4.1 Dashboard
4.1.1 Creating a dashboard for visualization
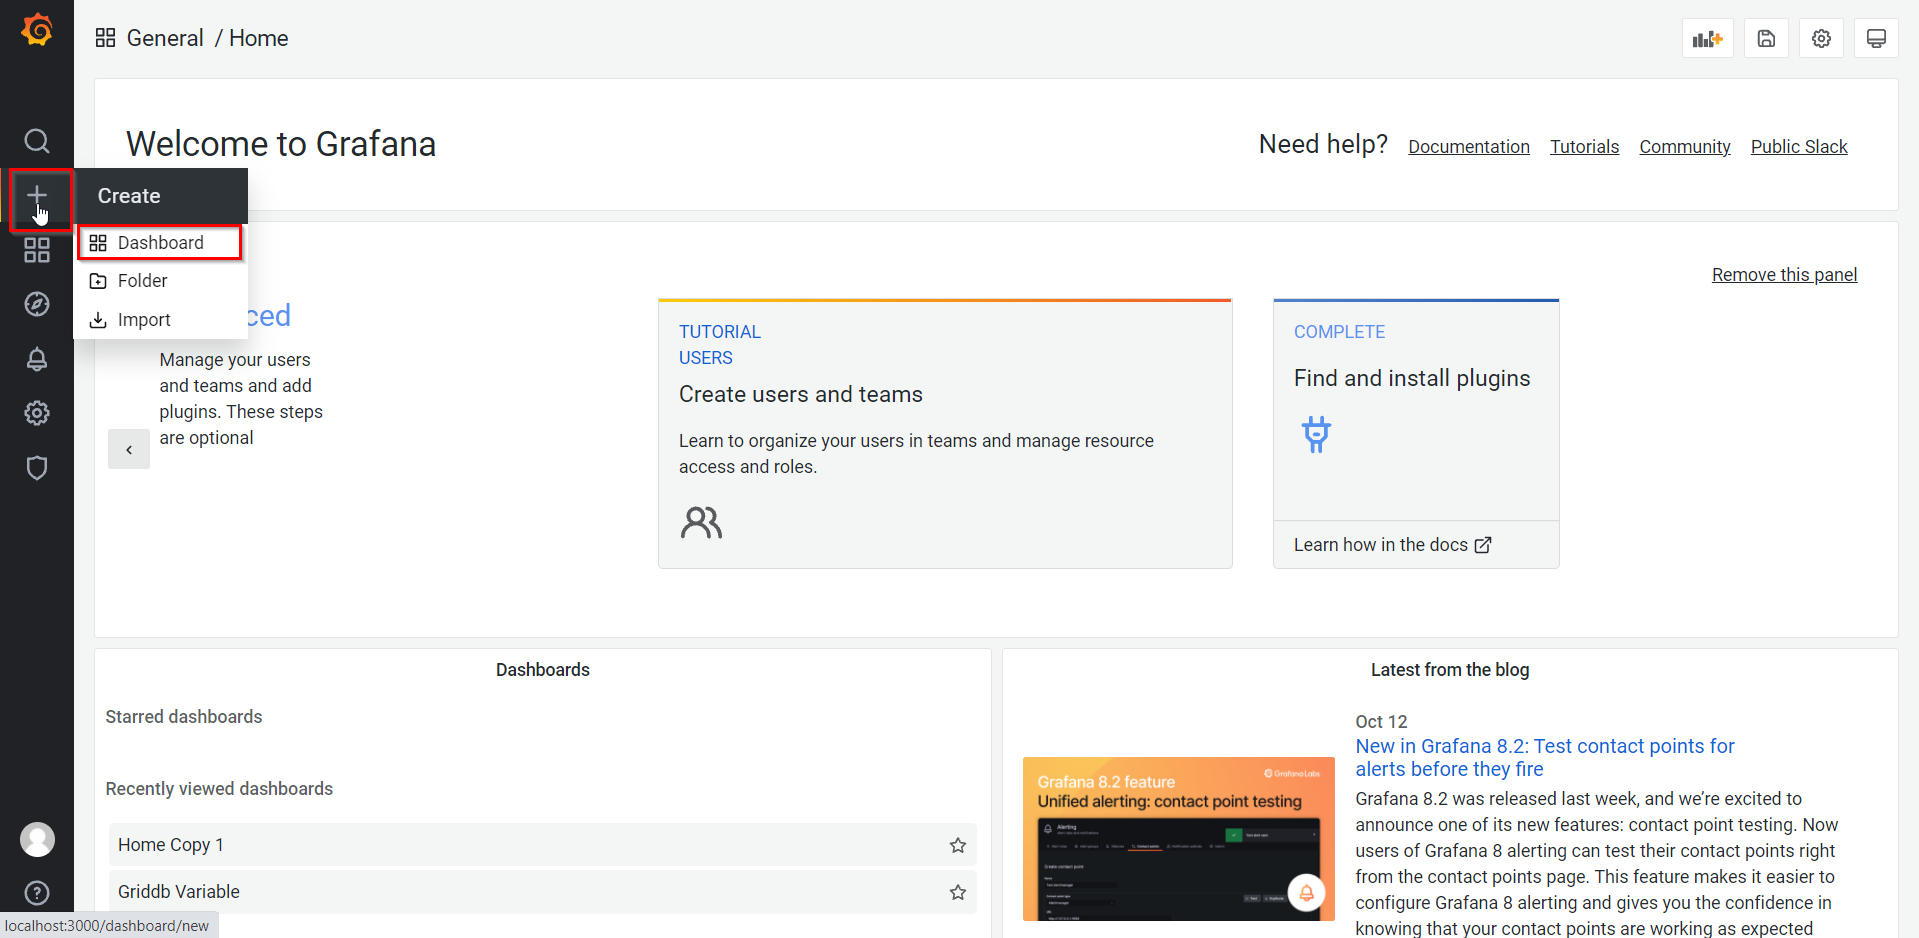
In the side menu, hover the mouse cursor over the icon ''+" and click Dashboard.
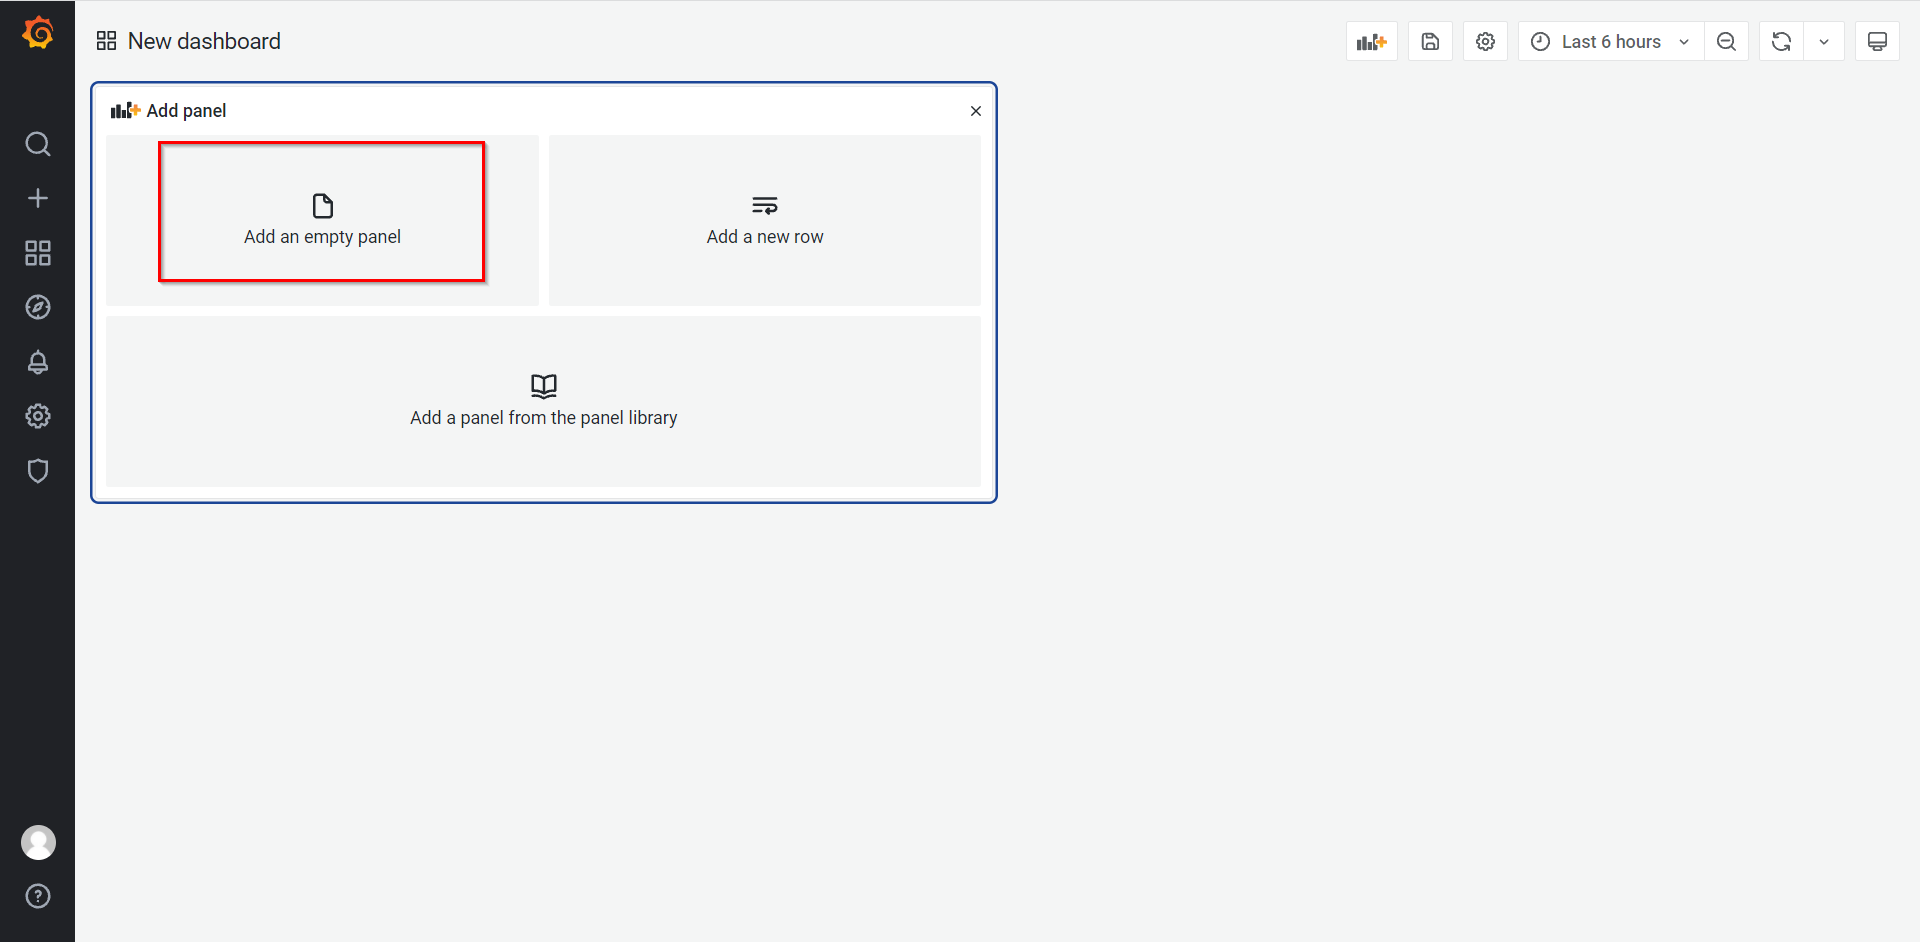
Creating a default dashboard In the New dashboard screen, click the rectangle named Add an empty panel in the Add panel area.
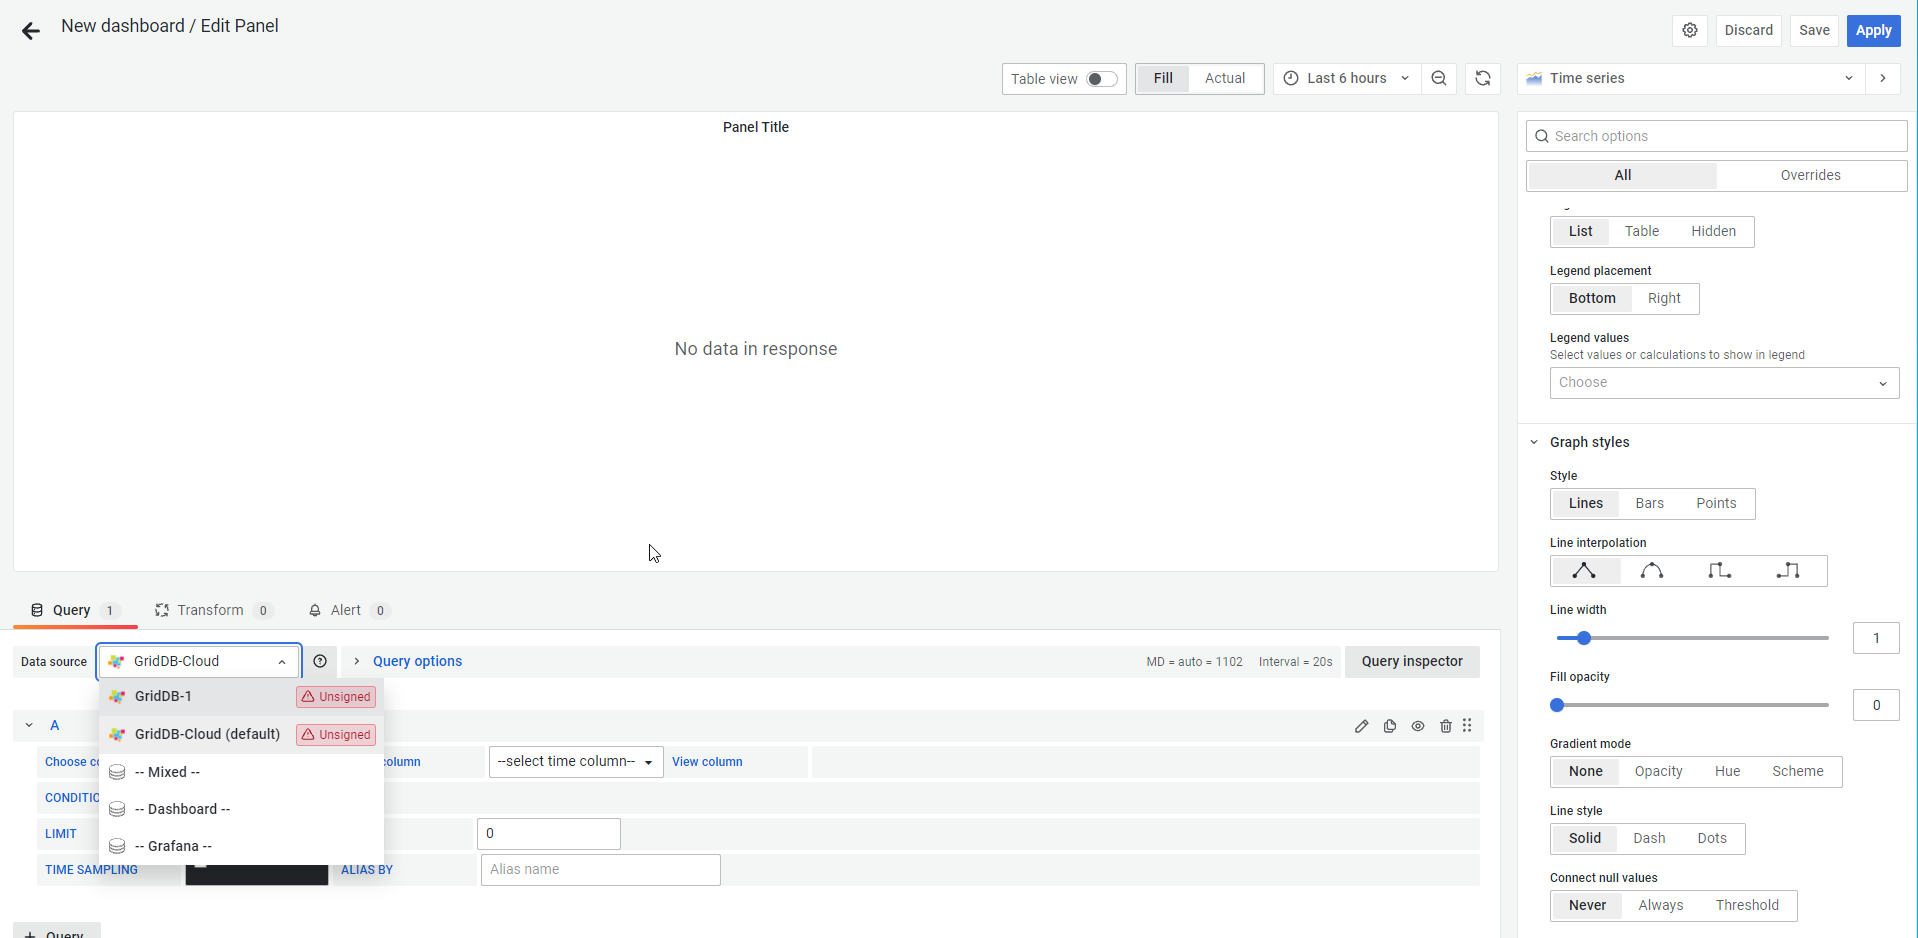
Creating an empty panel In the Edit panel screen, select the Query tab on the lower part of the screen and select the data source that you have created in the section Adding a GridDB data source.
Select a container from the drop-down list and select the time column in the Query area.
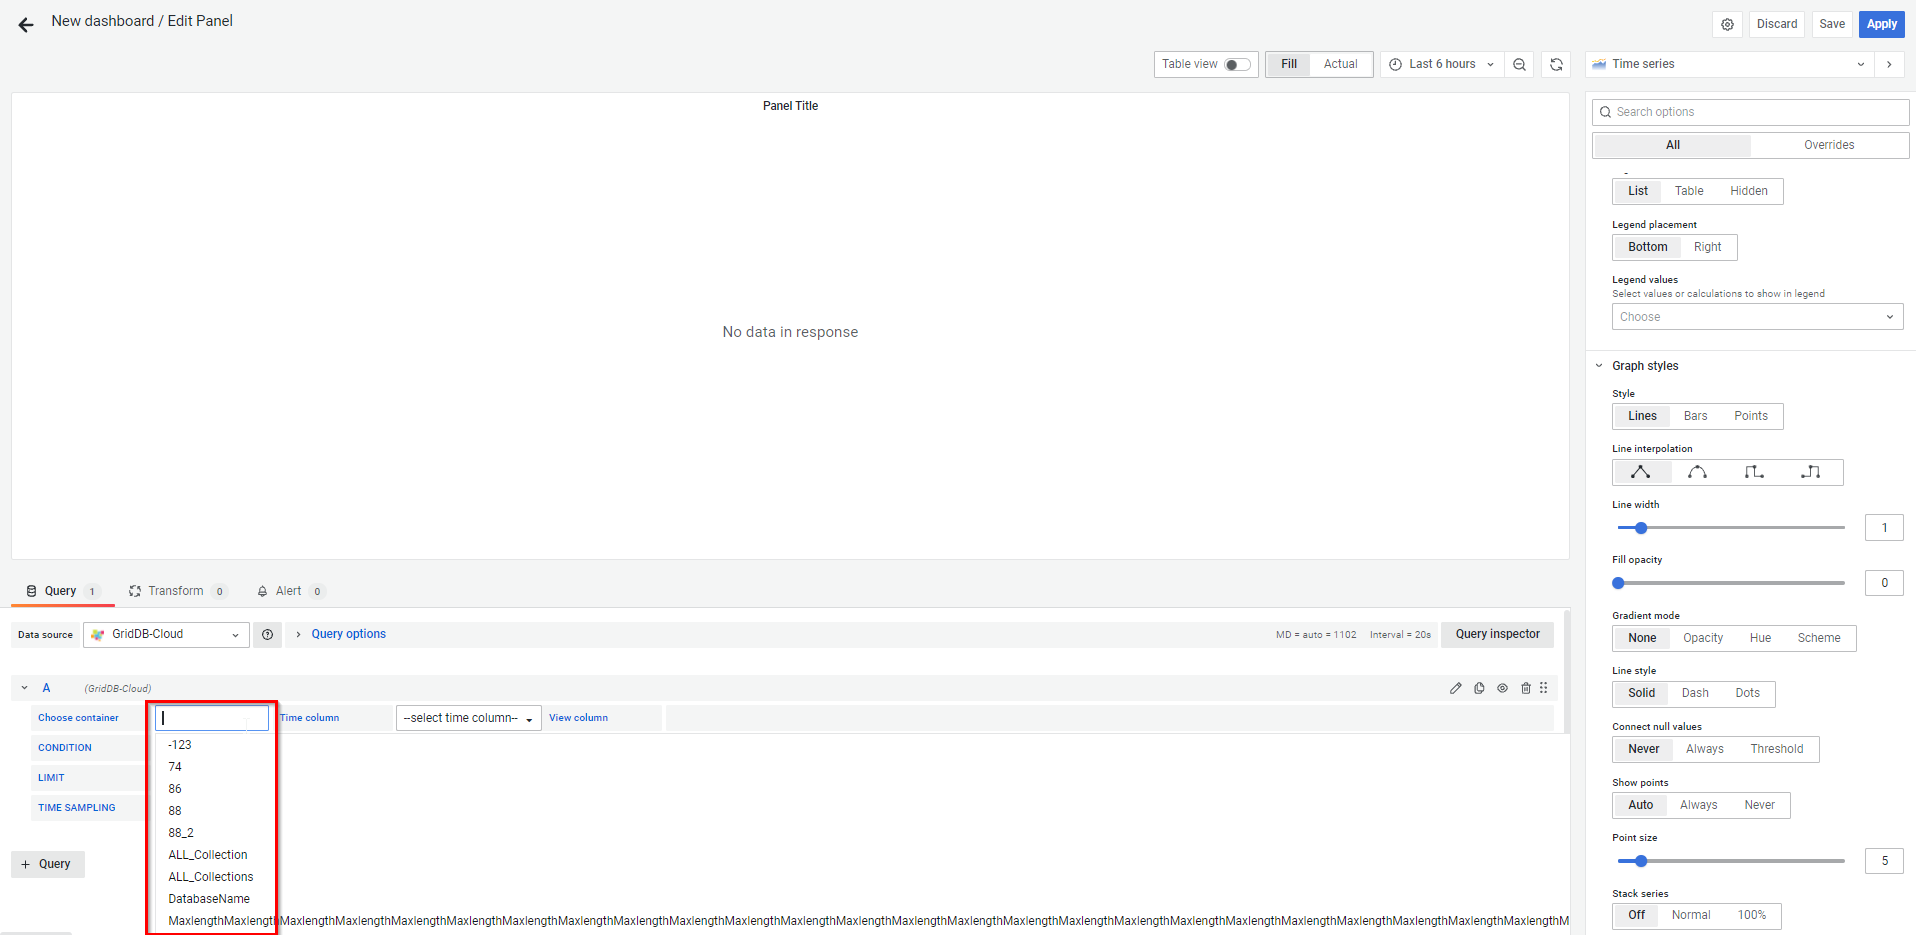
Query to select a container 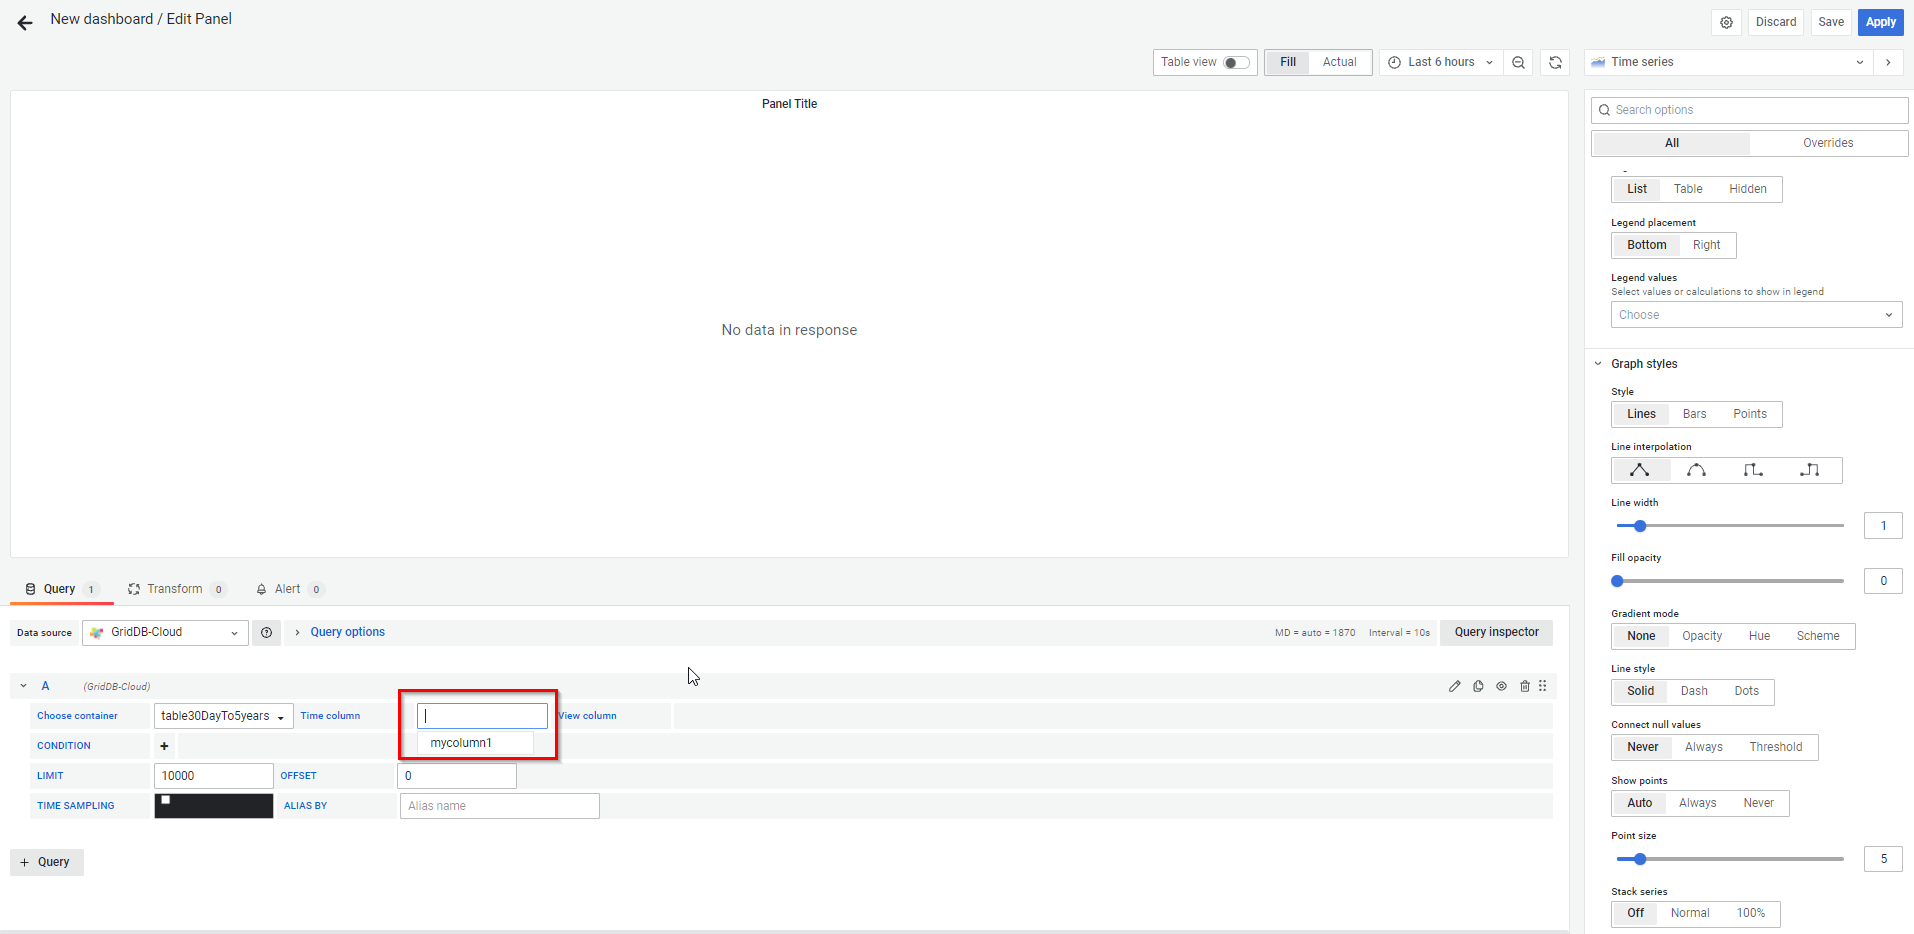
Query to select a column Add a condition for the query.
Adding a column for a condition 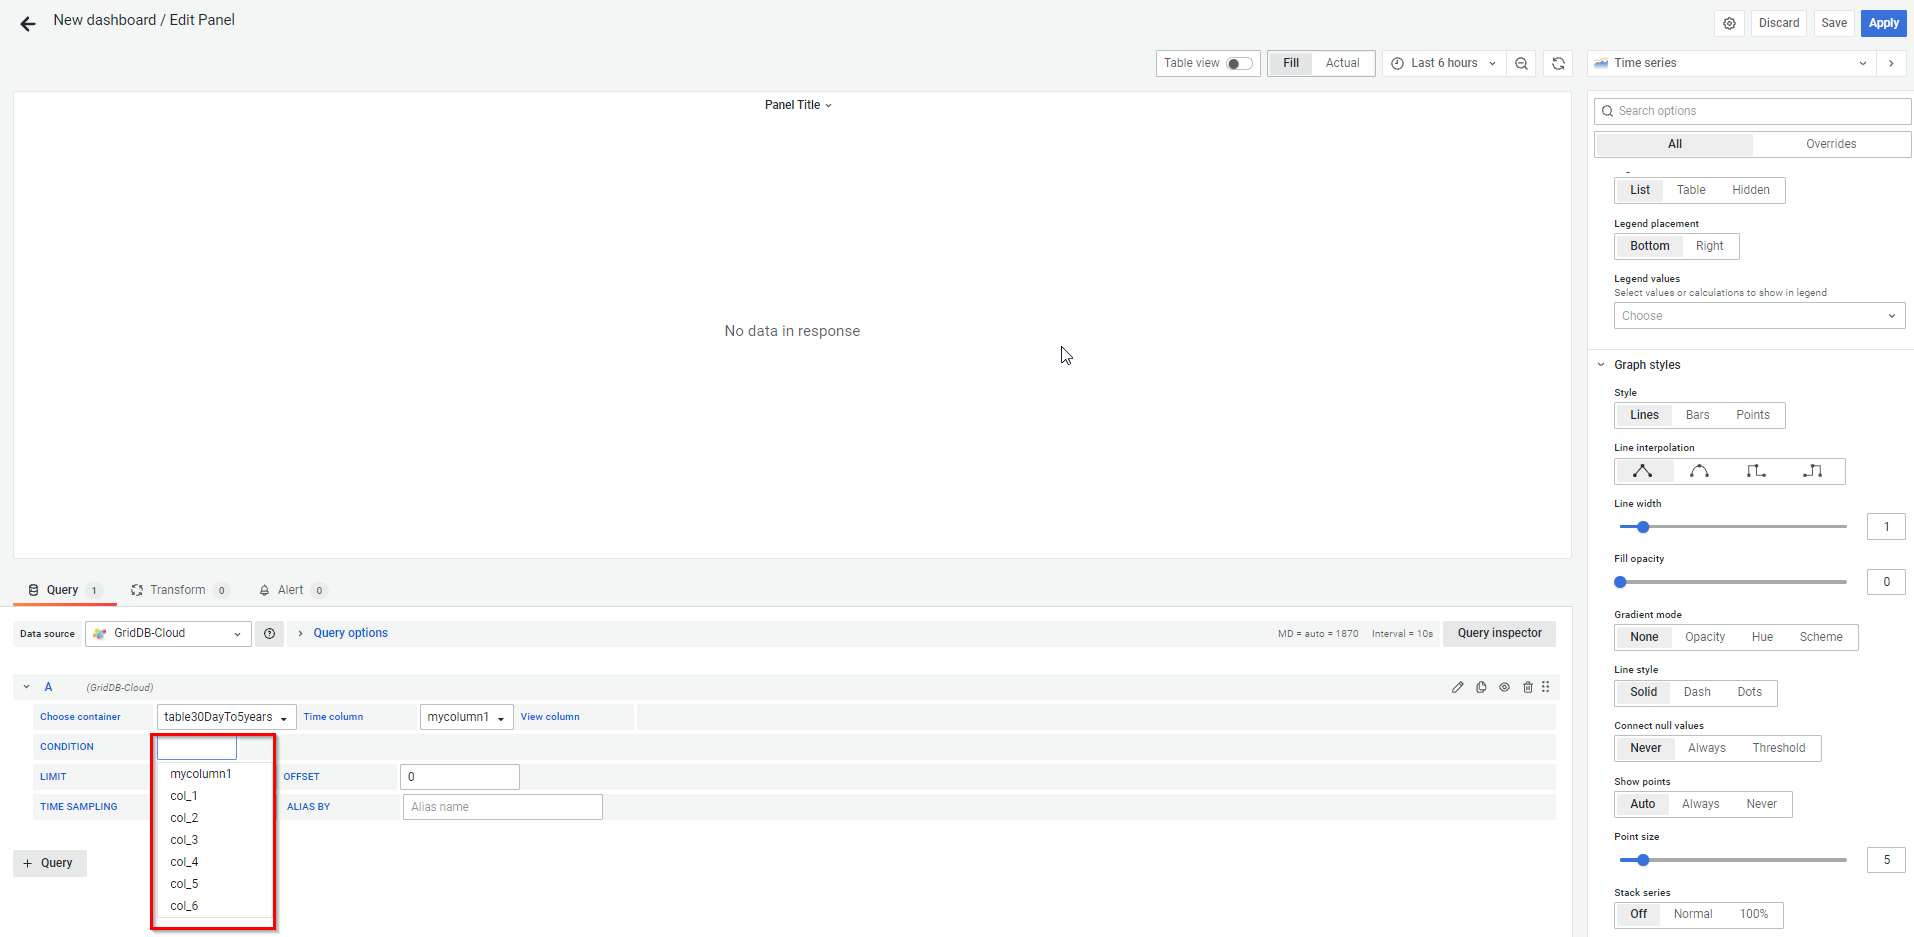
Adding an operation condition 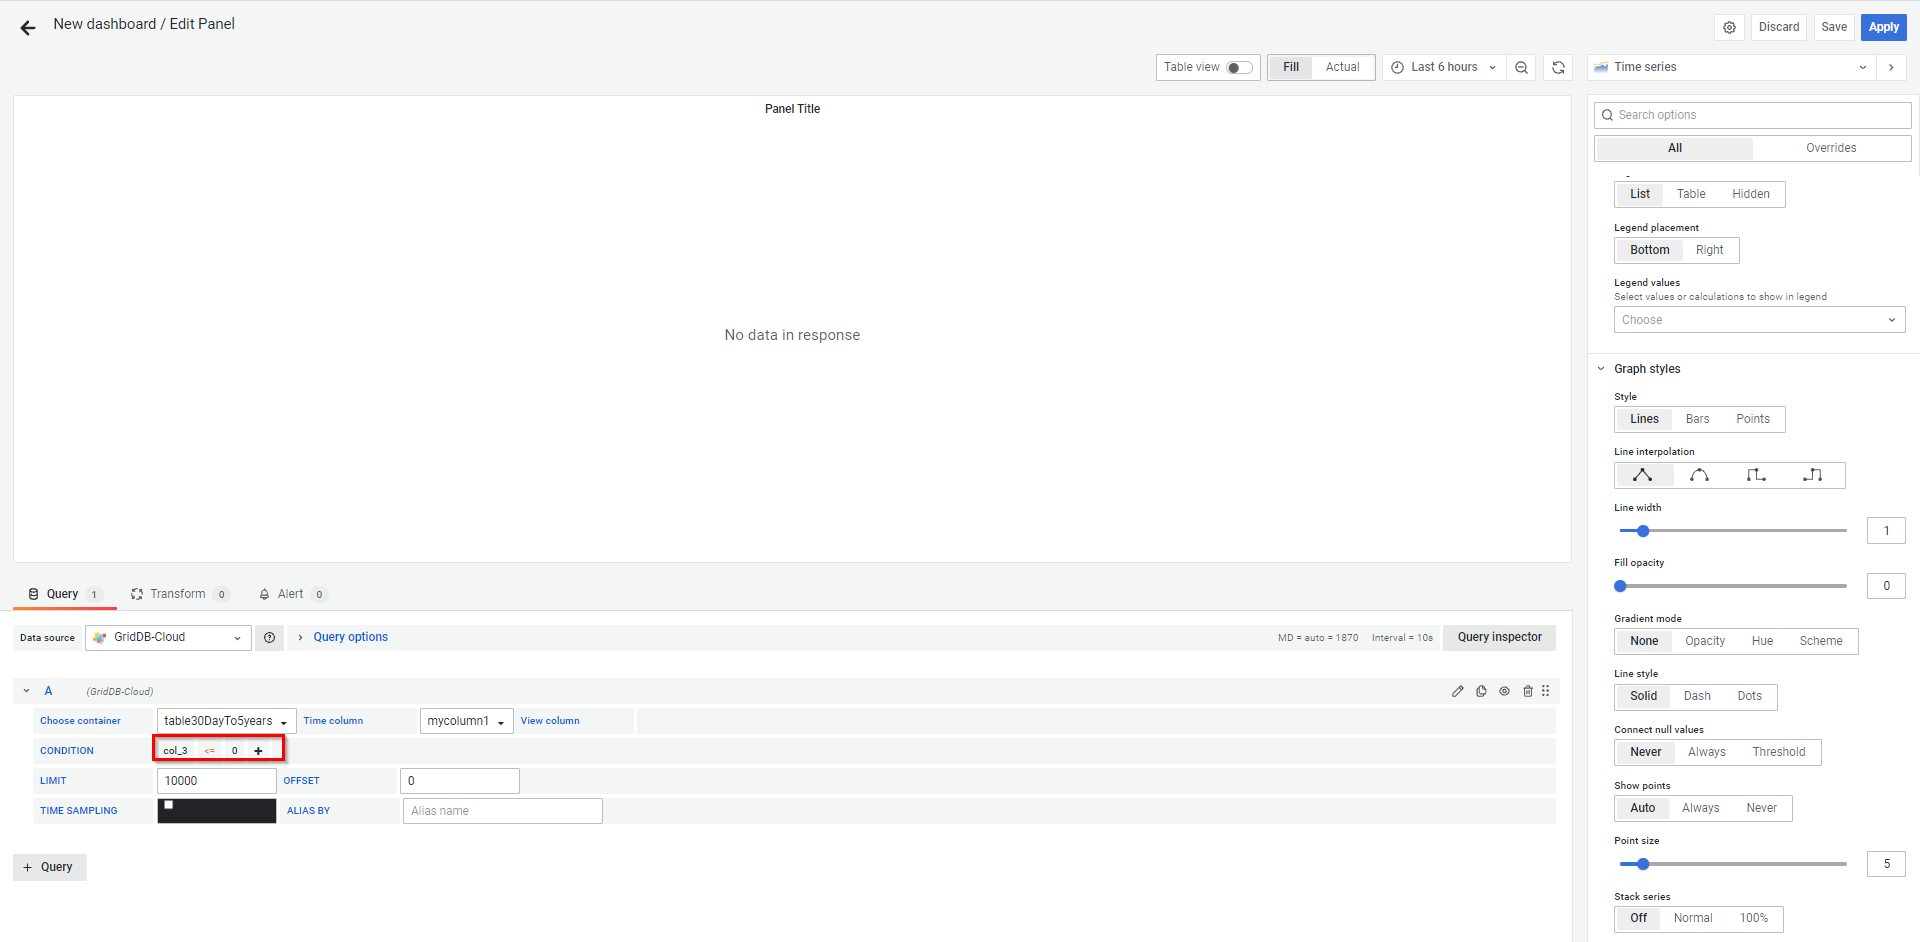
Adding the operand 📝 You can add more conditions by clicking the "+" button in the condition section.
Select the time range for which you want to display data.
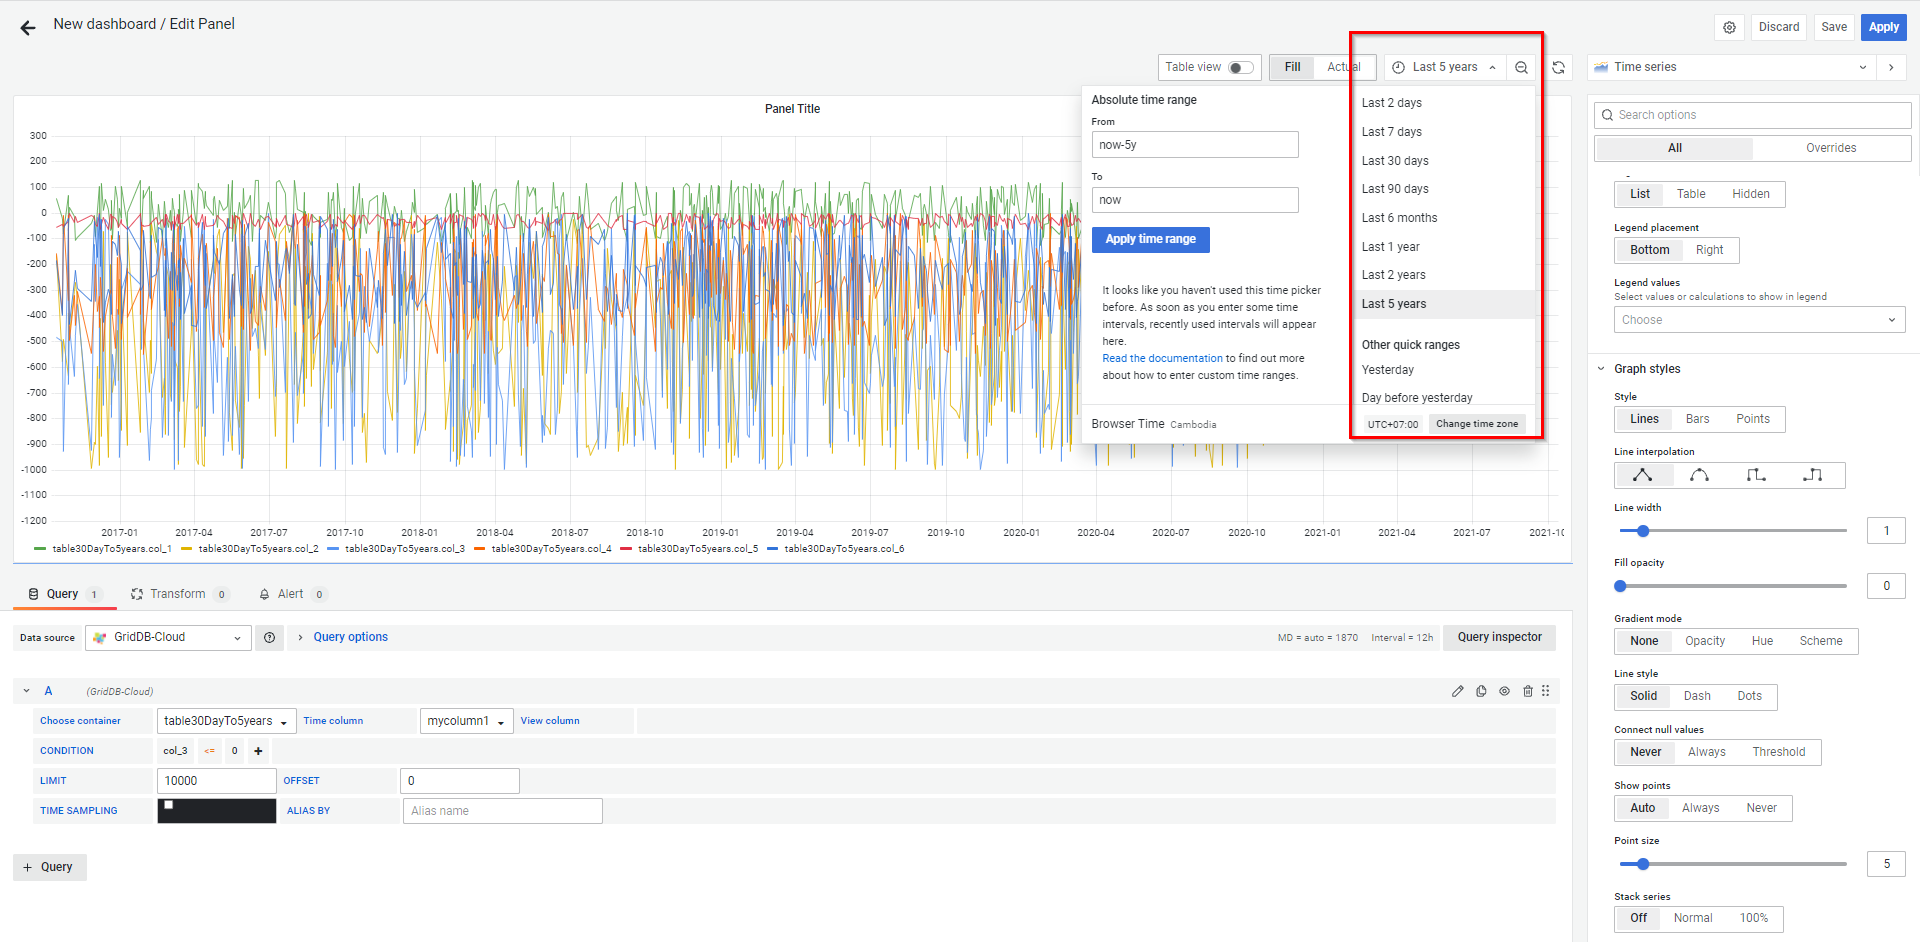
Selecting a time range You can choose a graph style as follows:
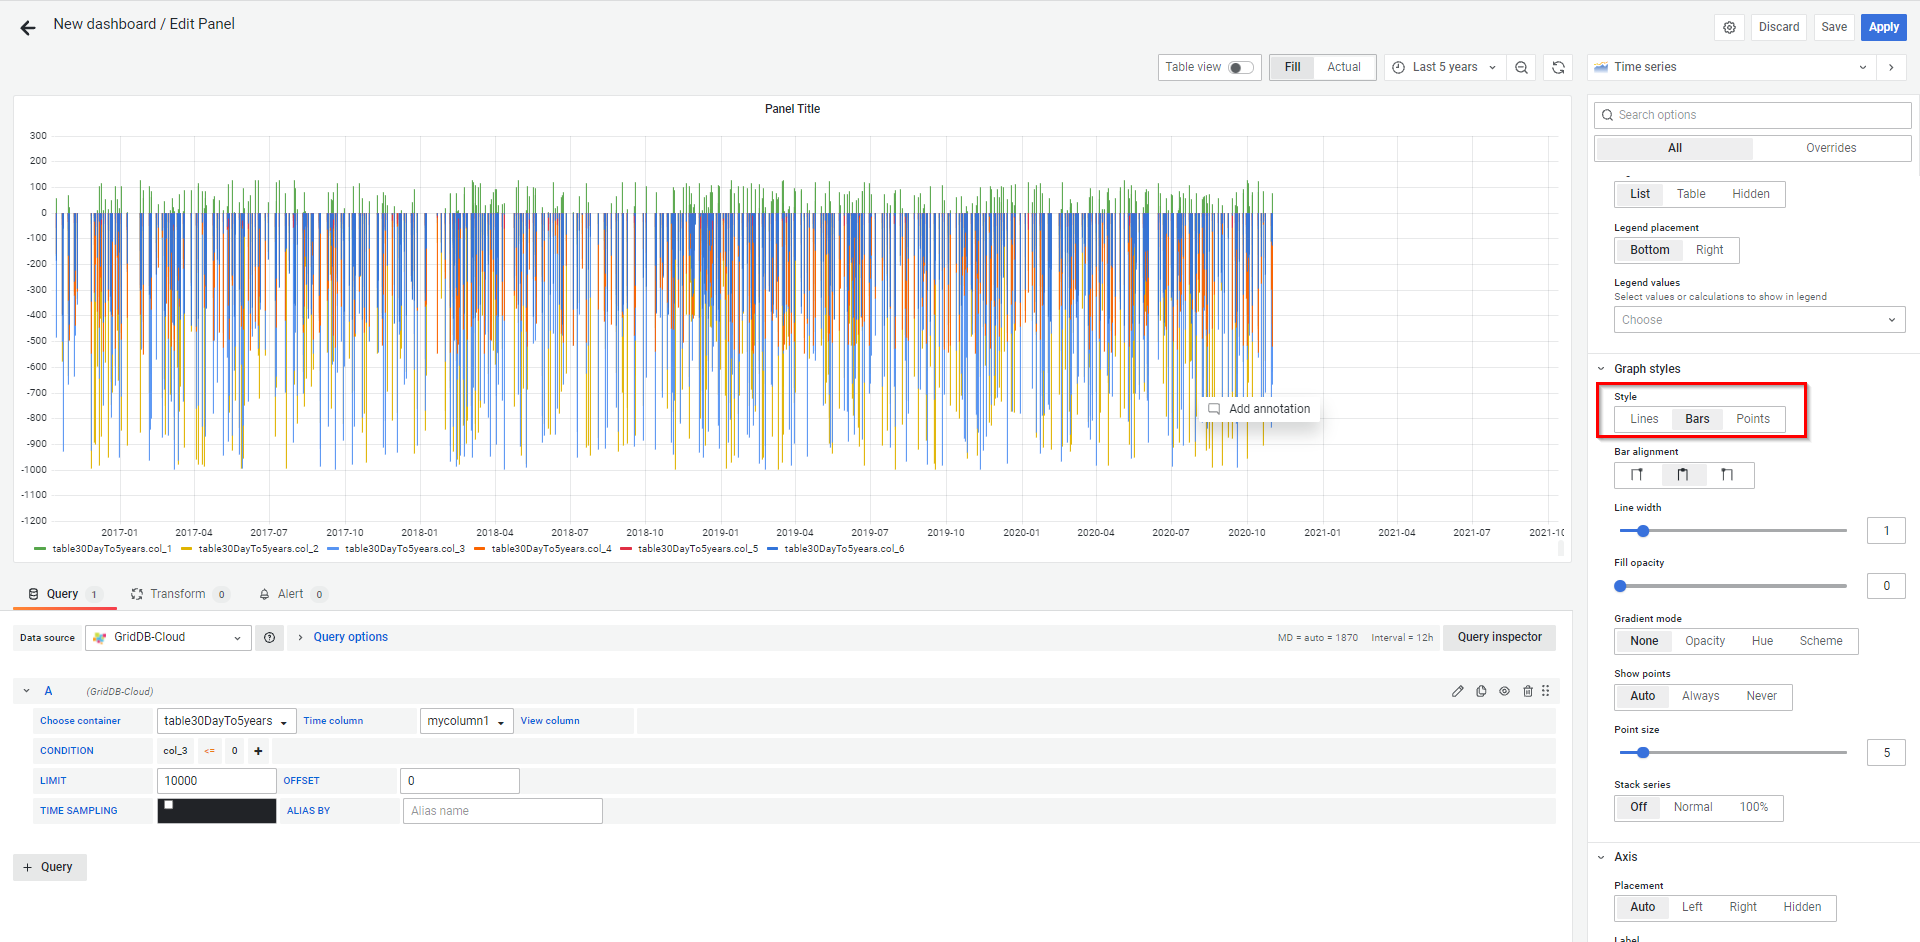
Choosing a graph style When you finish adding queries, the following dashboard will appear.
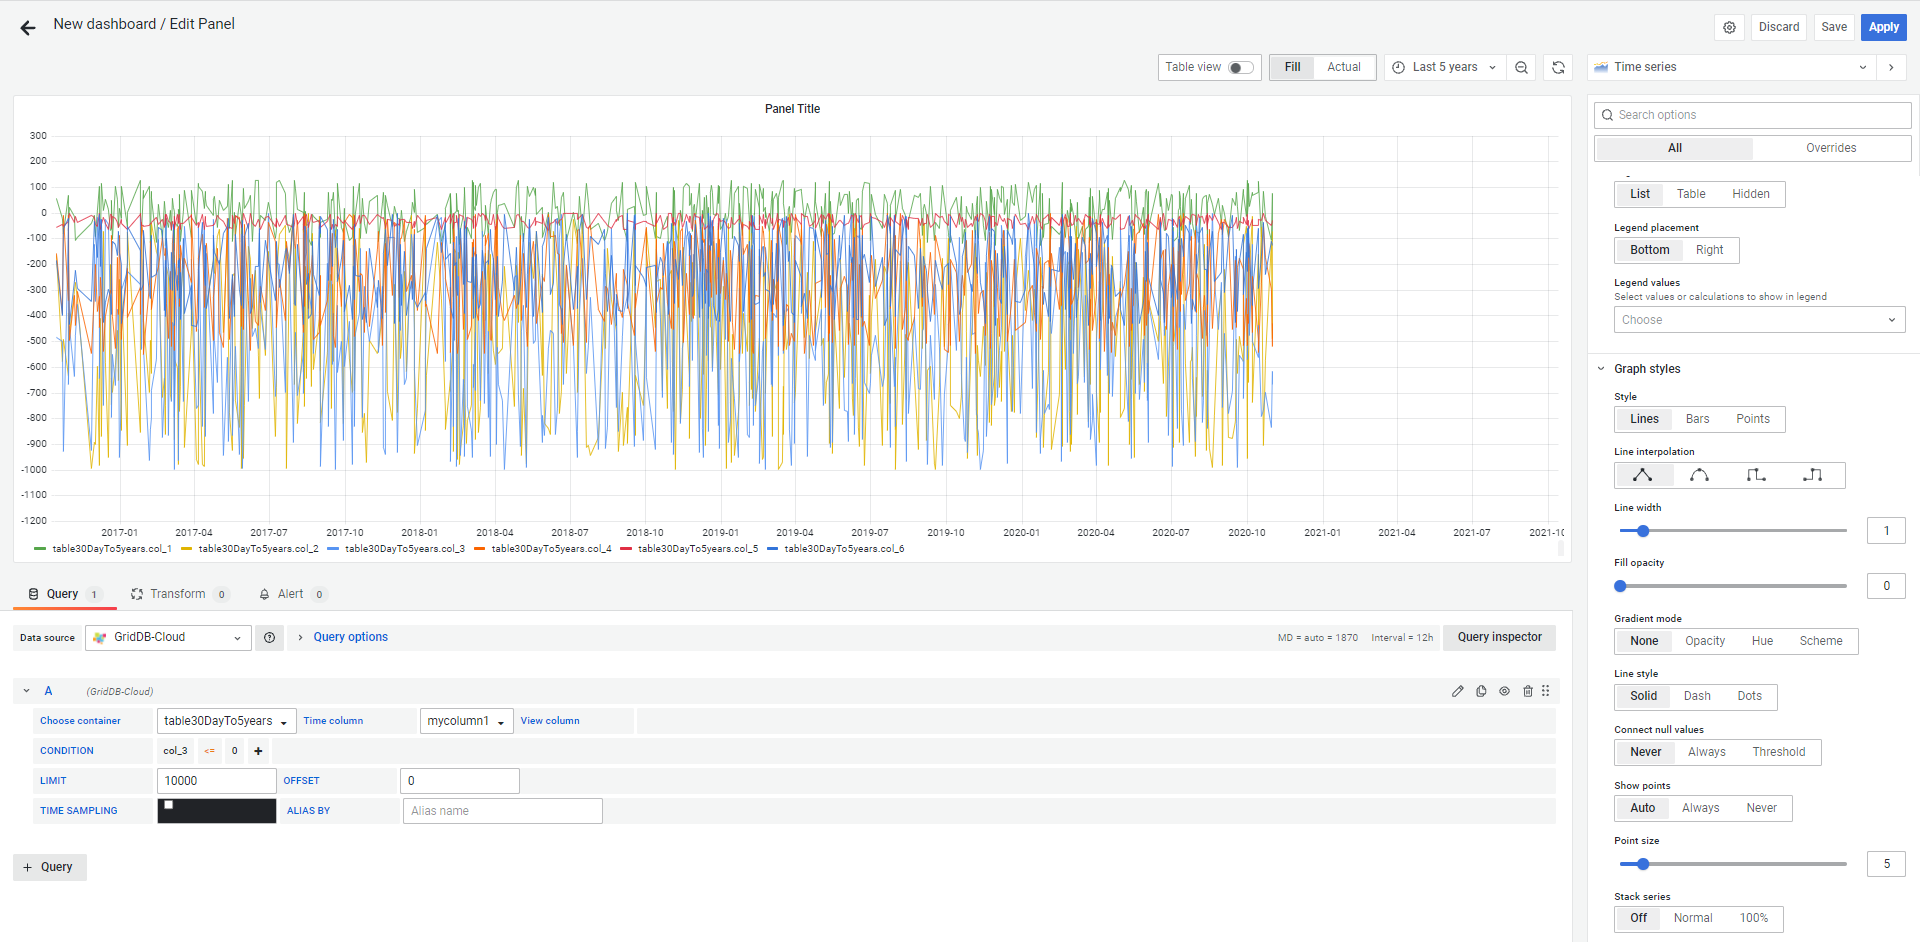
Dashboard after adding queries 📝 Each time you add a query, the graph is automatically updated without additional action.
You can change the legends displayed by entering a user-defined value in the ALIASED BY text field as shown below:
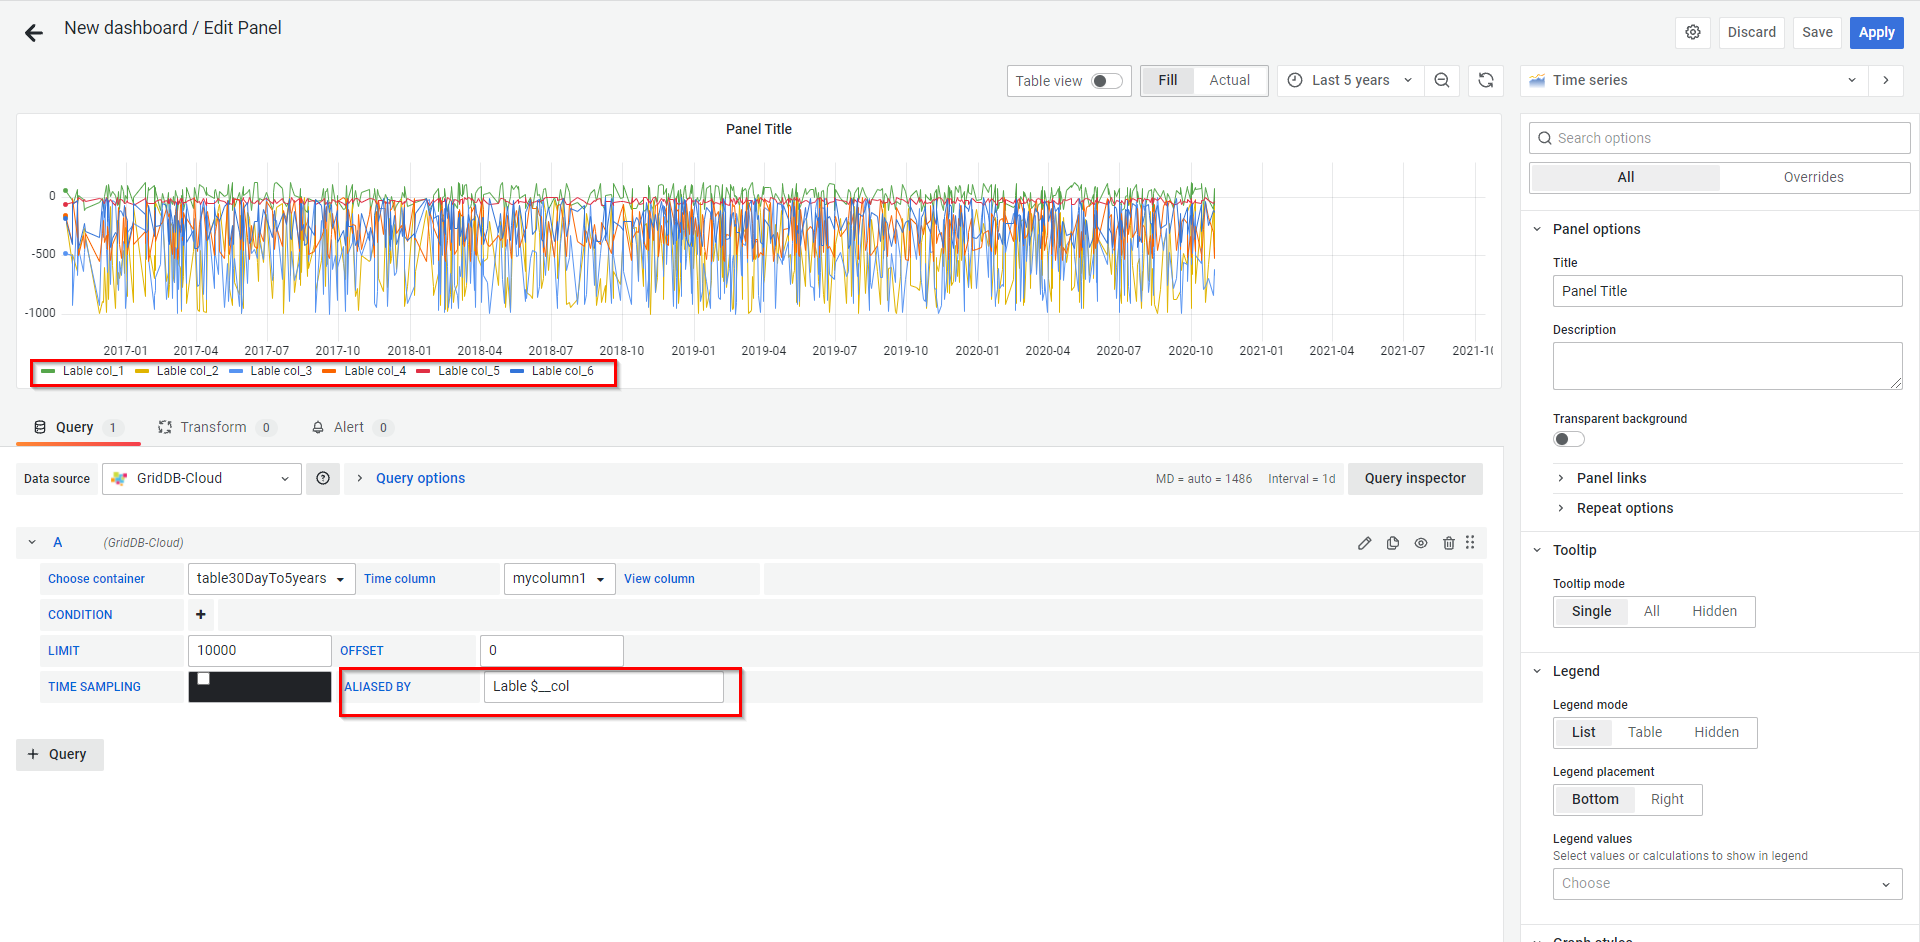
Query aliased by For more information about special variables you can use, refer to the ALIASED BY field in the Edit Panel screen column of the table in Availability of special query expressions for each data field.
Click the Apply button to save the dashboard, and the system will redirect you to the variable screen and display the graph as you have specified.
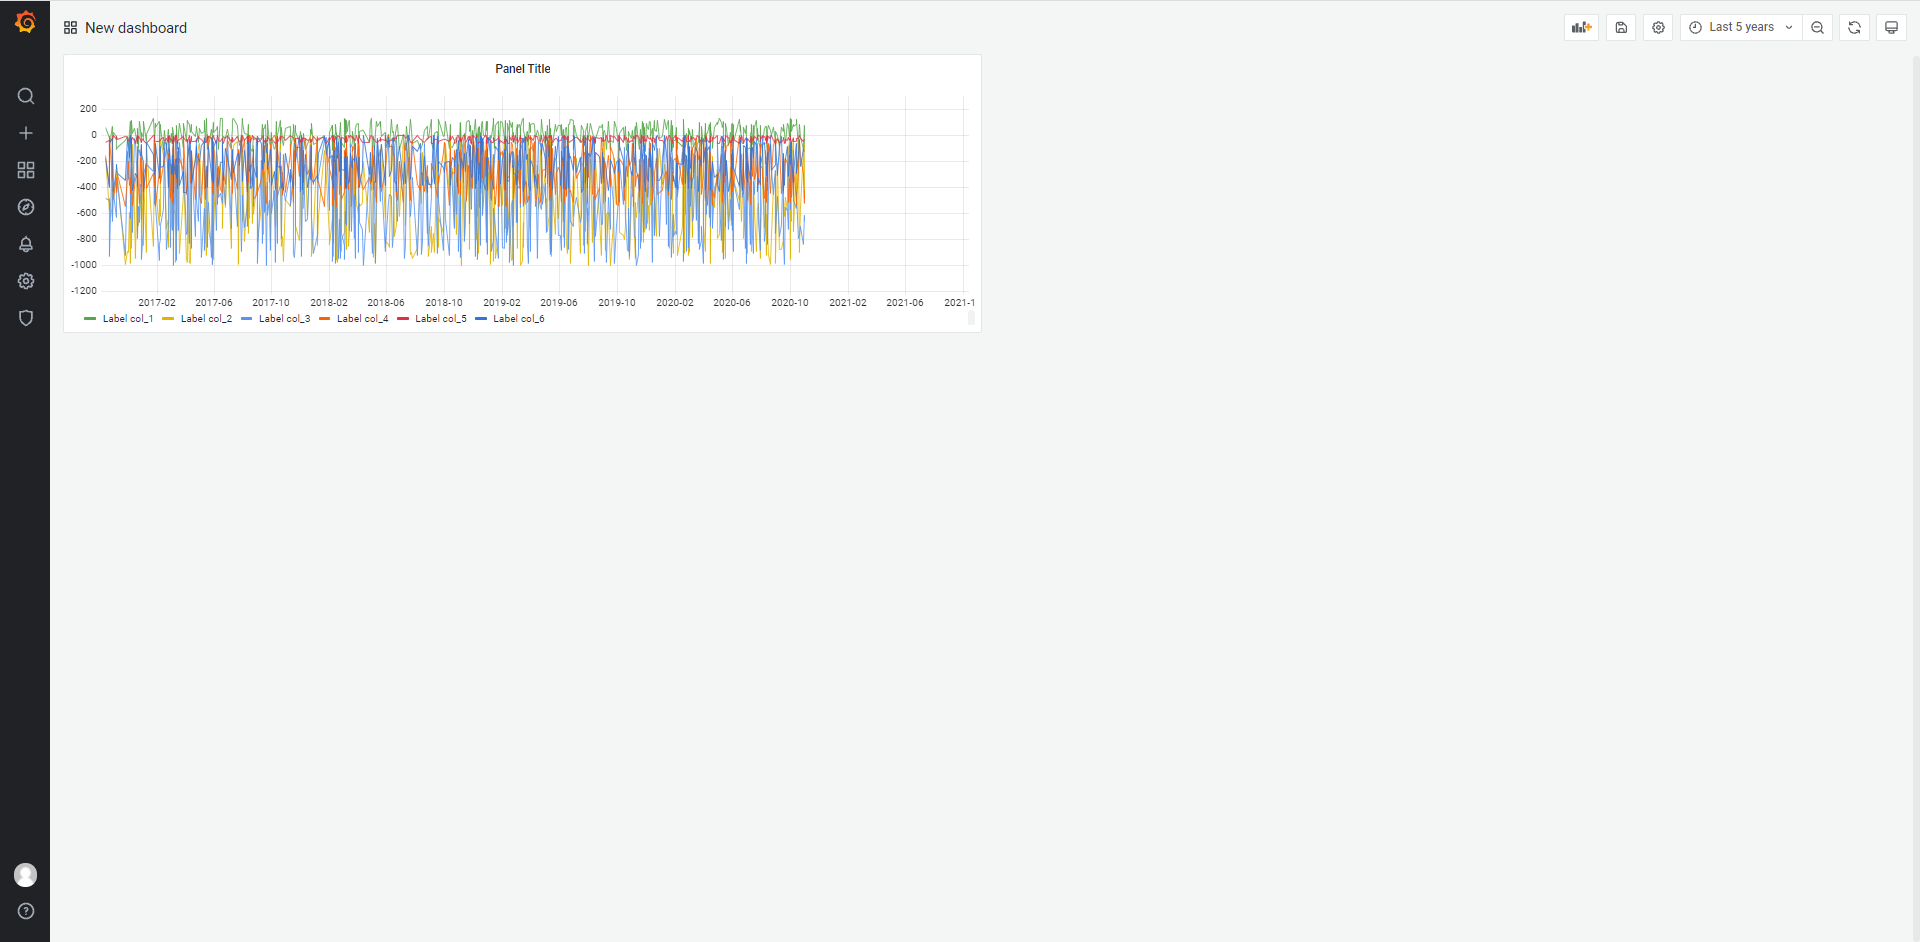
Dashboard Click the Save button to save the dashboard.
4.1.2 Additional settings
In addition to creating a dashboard for visualization as explained in the section Creating a dashboard for visualization, you can add configuration to create a more interactive and dynamic dashboard using variables.
4.1.2.1 Variables
A variable is a placeholder for a value. Variables can be used in metric queries and panel titles.
For more details, refer to Grafana variables.
4.1.2.1.1 Variable settings
Open any panel and click the Settings button on the top screen.
In the side menu under Settings, click the link named Variables.
Click the + Add variable button.
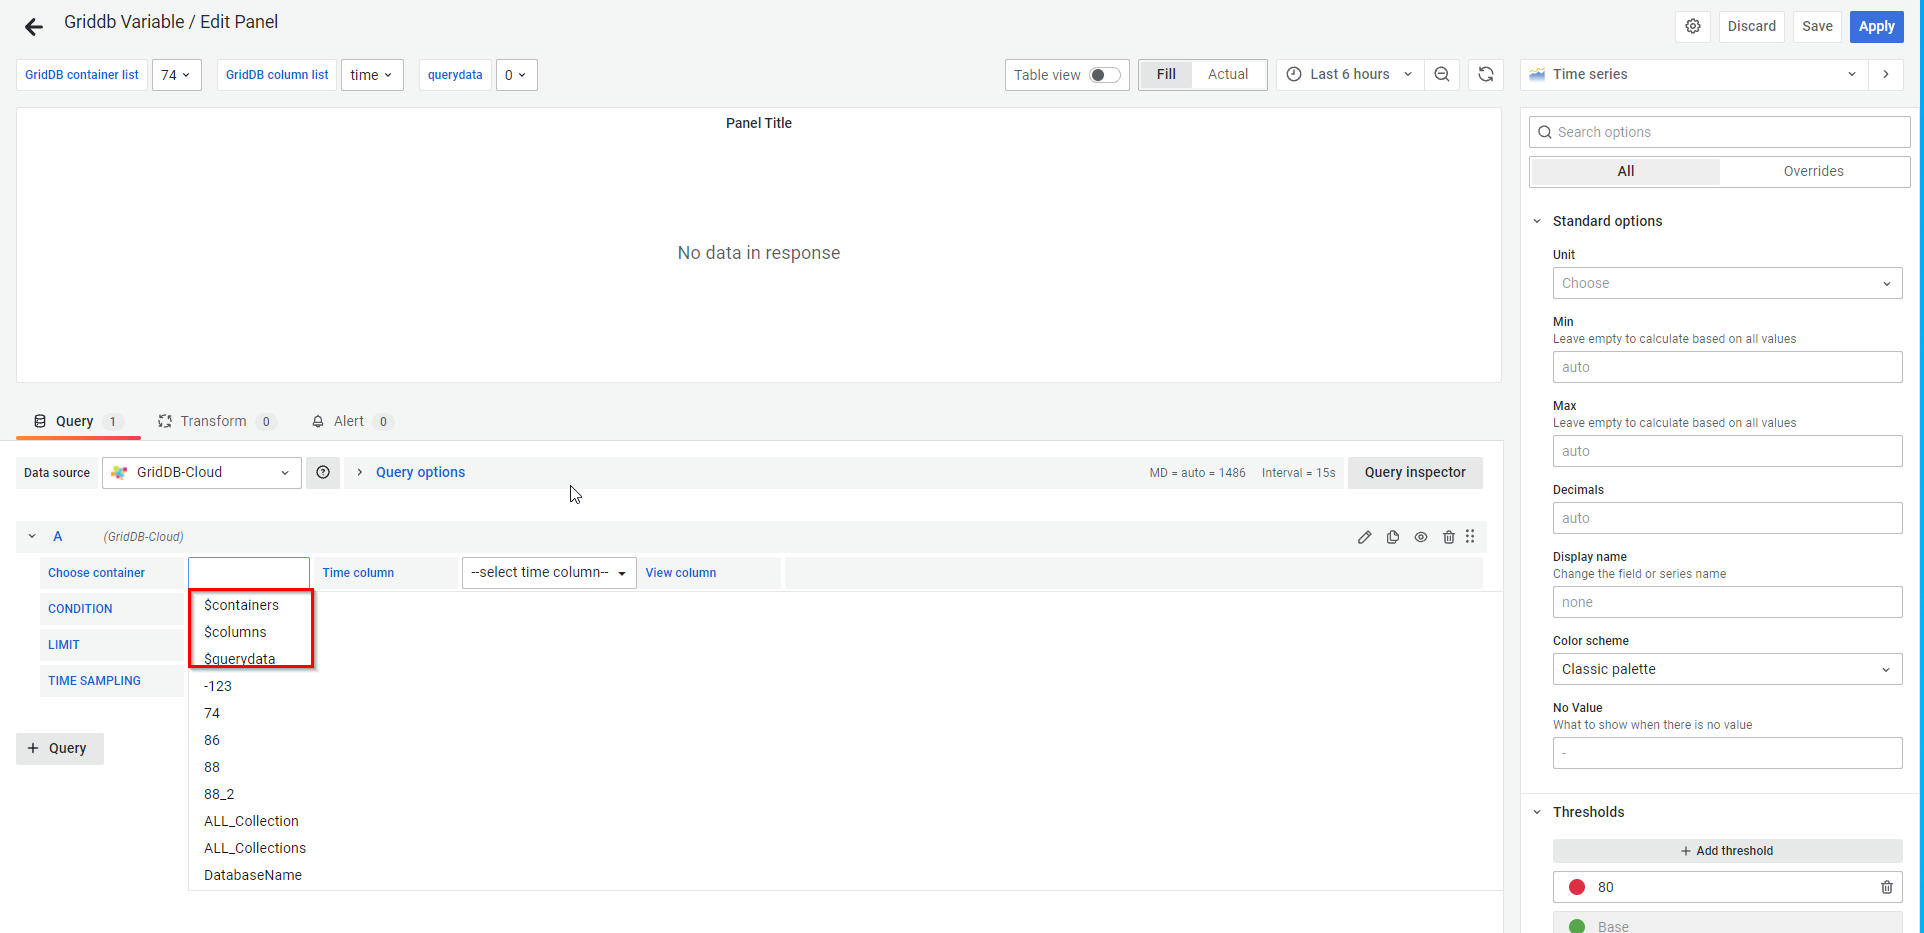
Enter a query in the Query field on the Edit screen. You can use the following three predefined parameters:
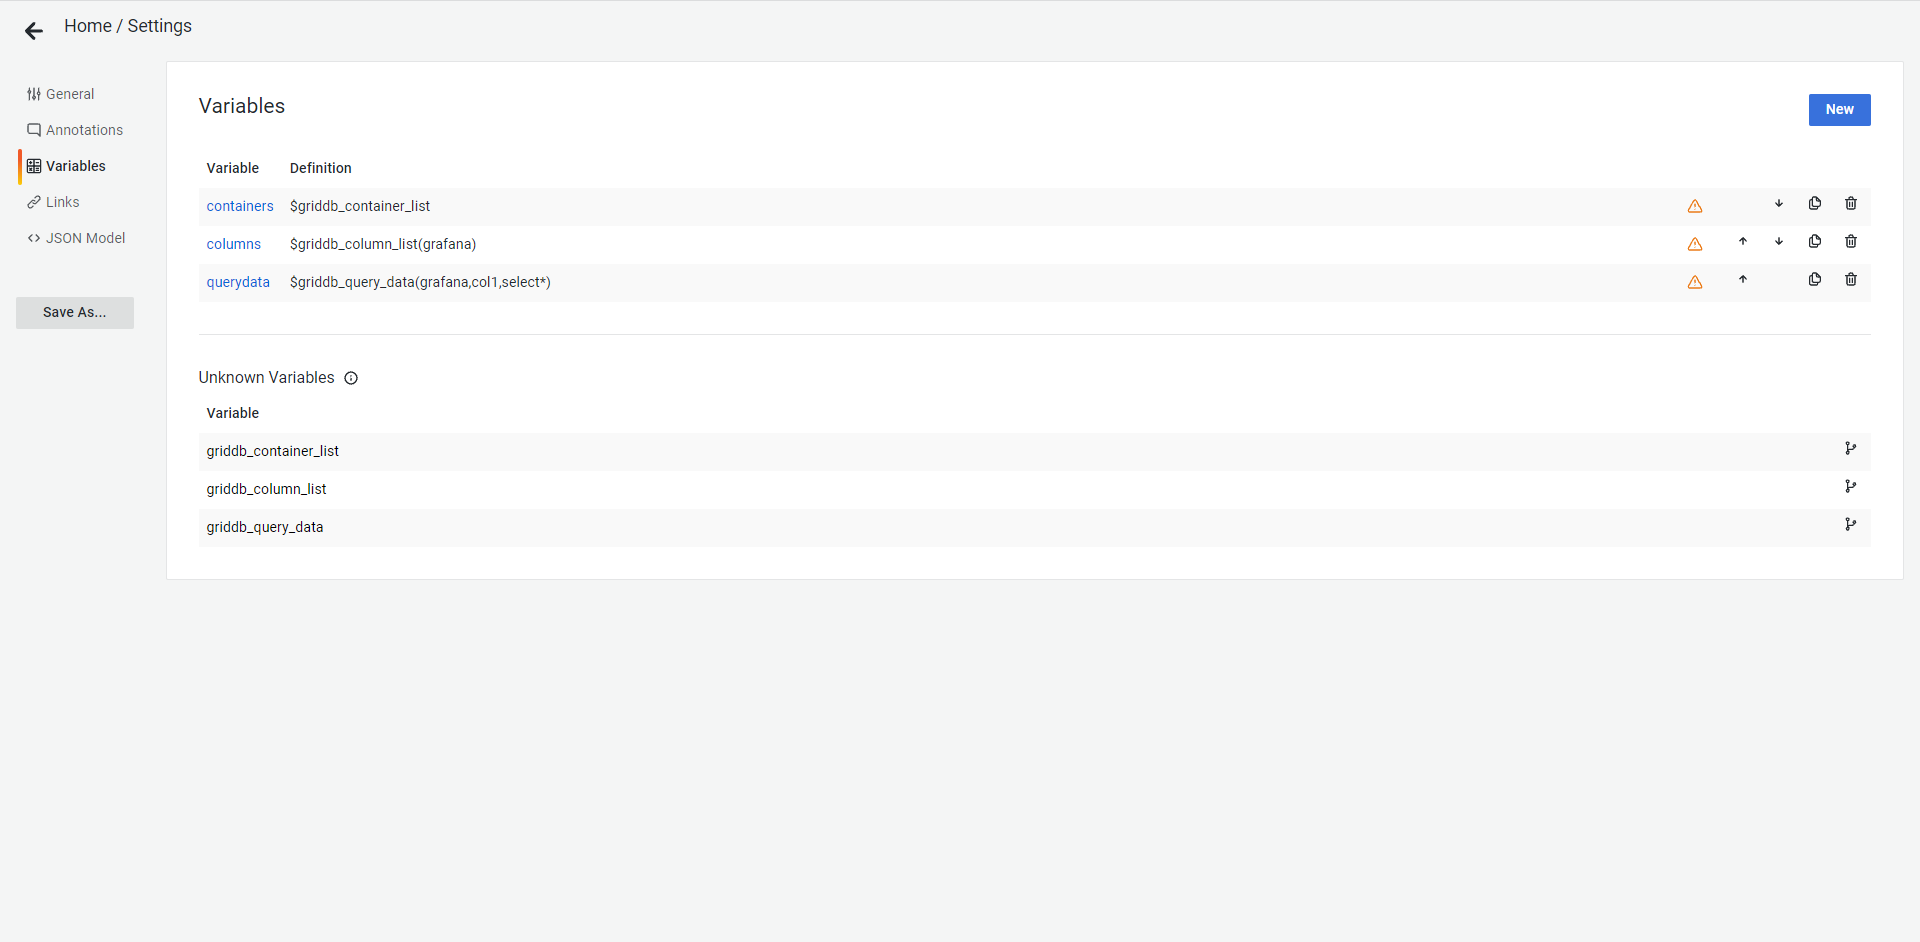
- To get all containers using a parameter, use the format
$griddb_container_list. - To get all columns of a specific container using a parameter, use the format
$griddb_column_list({container name}). - To get data of a specific container using a parameter, use the format
$griddb_query_data({container name}, {columns}, {TQL}).
- To get all containers using a parameter, use the format
The result of the query is displayed in the Preview of values area.
$griddb_container_list
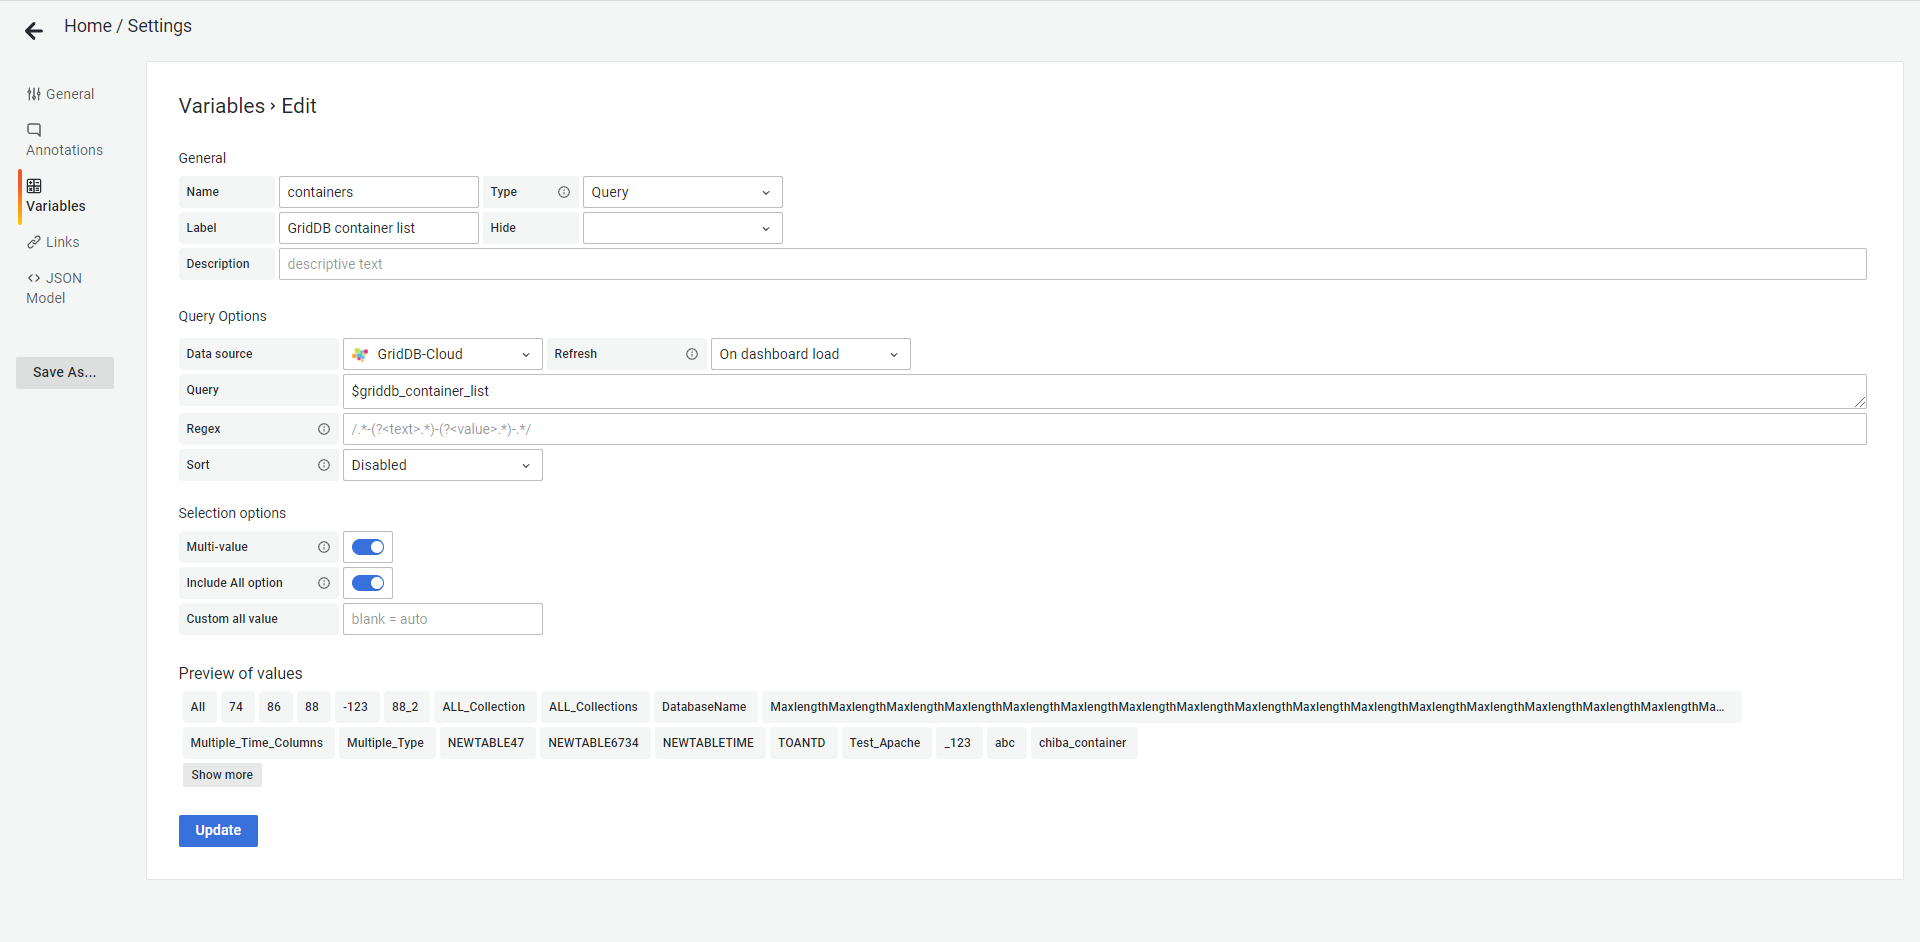
Variable for a container list $griddb_column_list({container name})
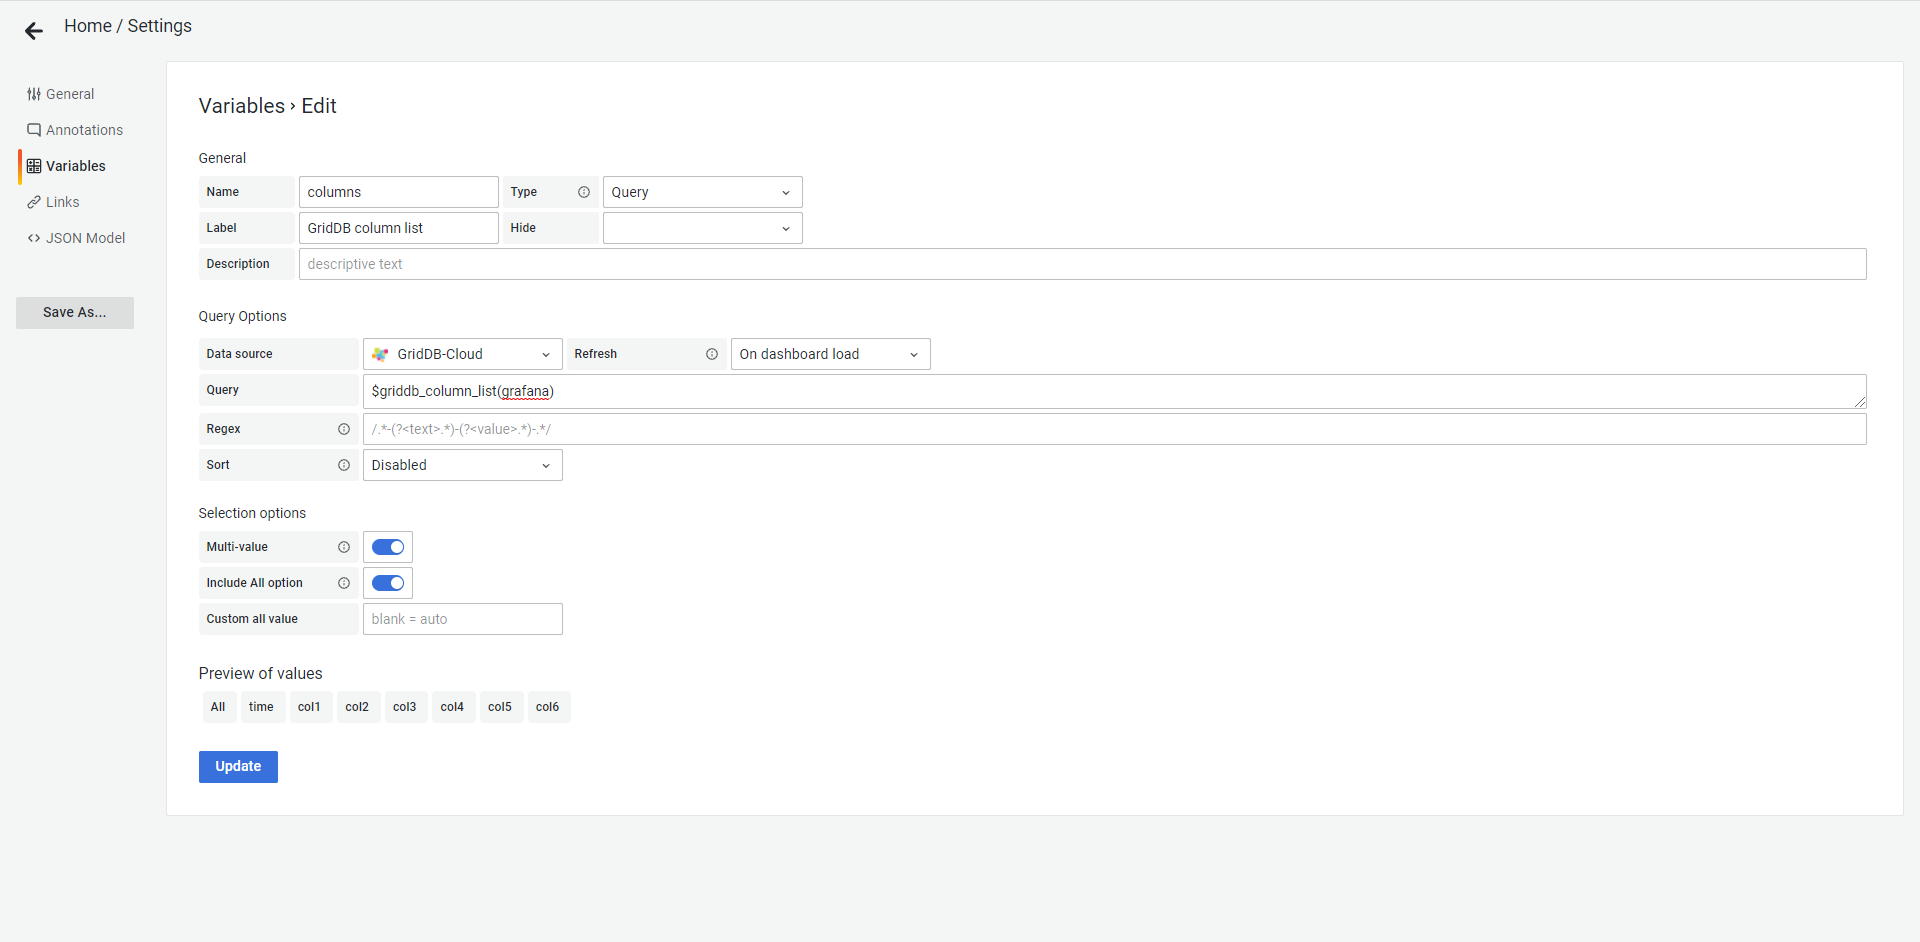
Variable for a column list of the container 'grafana' $griddb_query_data({container name}, {columns}, {TQL})
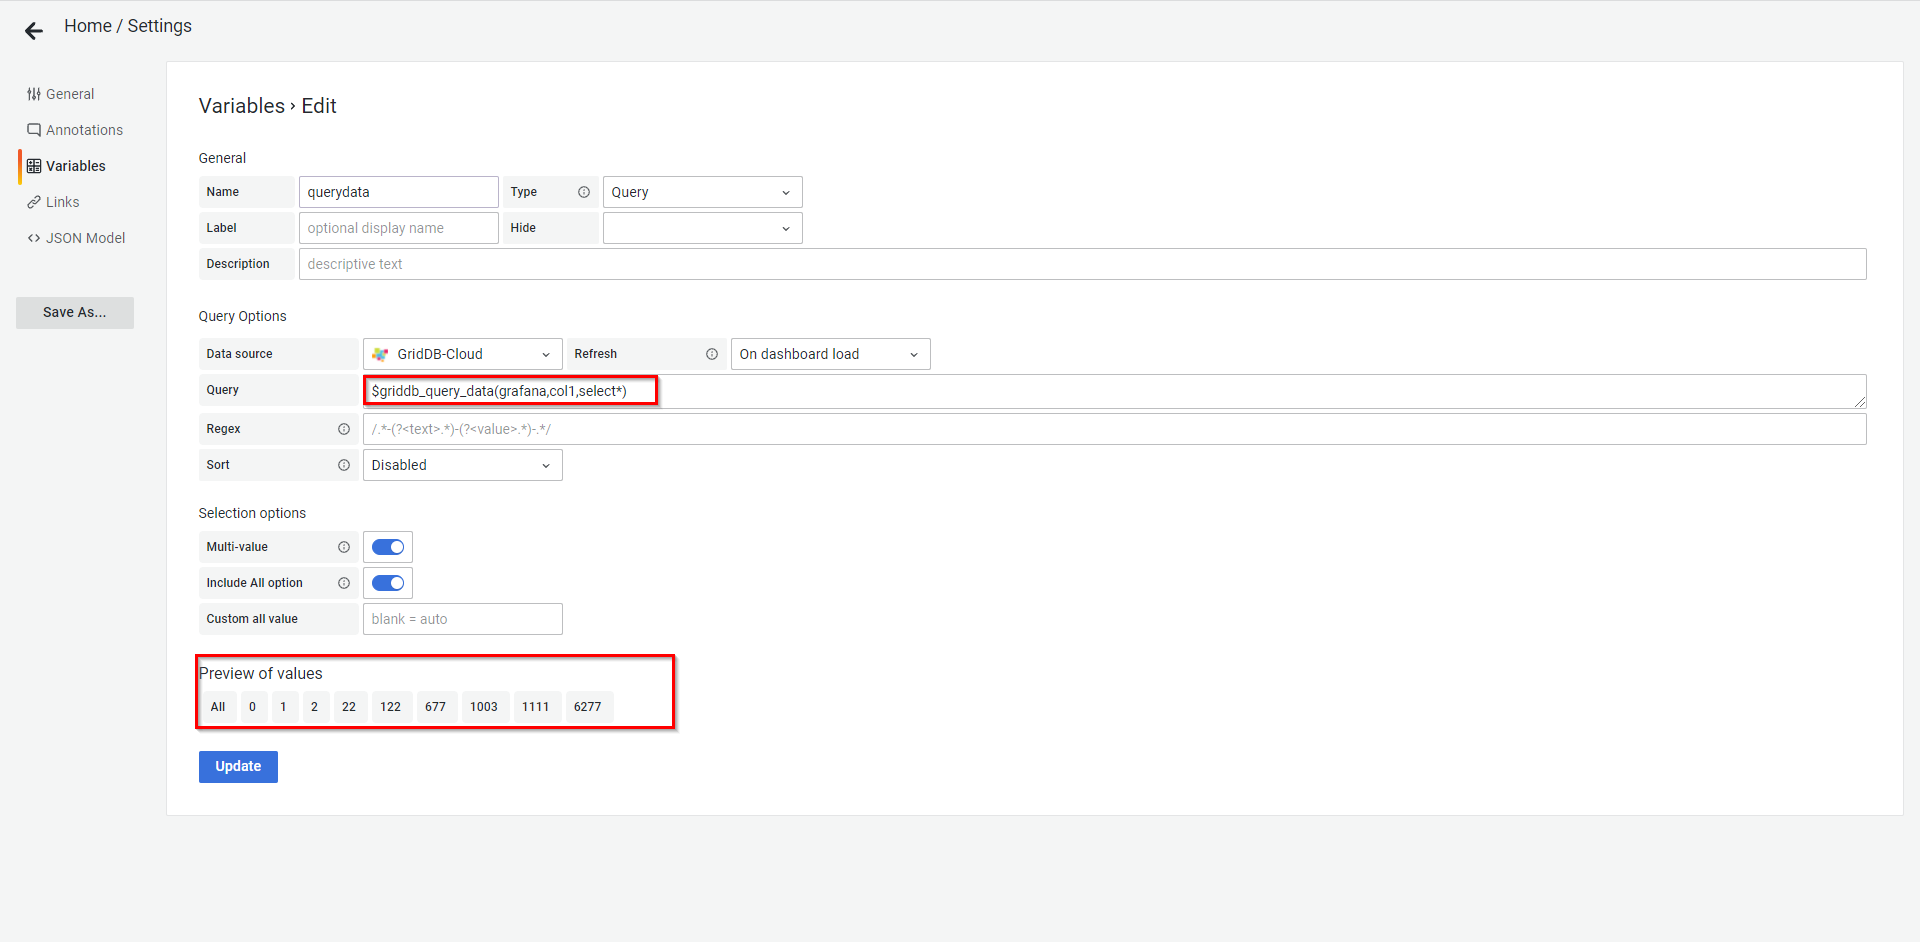
📝 You can configure two options: Multi-value and Include all options. If you enable Multi-value, you can choose multiple values by checking checkboxes. If you enable Include all options, you can select all the checkboxes automatically by checking the checkbox for "All" .
Click the Update and Save As buttons to save the variable.
After clicking the Update and Save As buttons Enter a dashboard name and select a folder (The default is General) in the Save dashboard as... dialog. To create a folder on the dashboard, refer to How To Create A Folder.
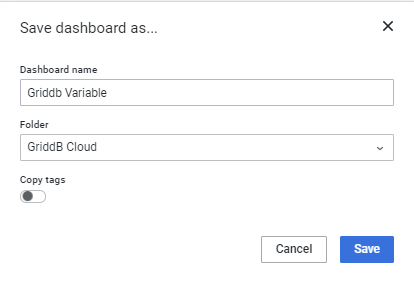
Save dashboard as... dialog Click the Save button. A dashboard which has a variable that you have just created is created.
4.1.2.1.2 Visualizing data with variables
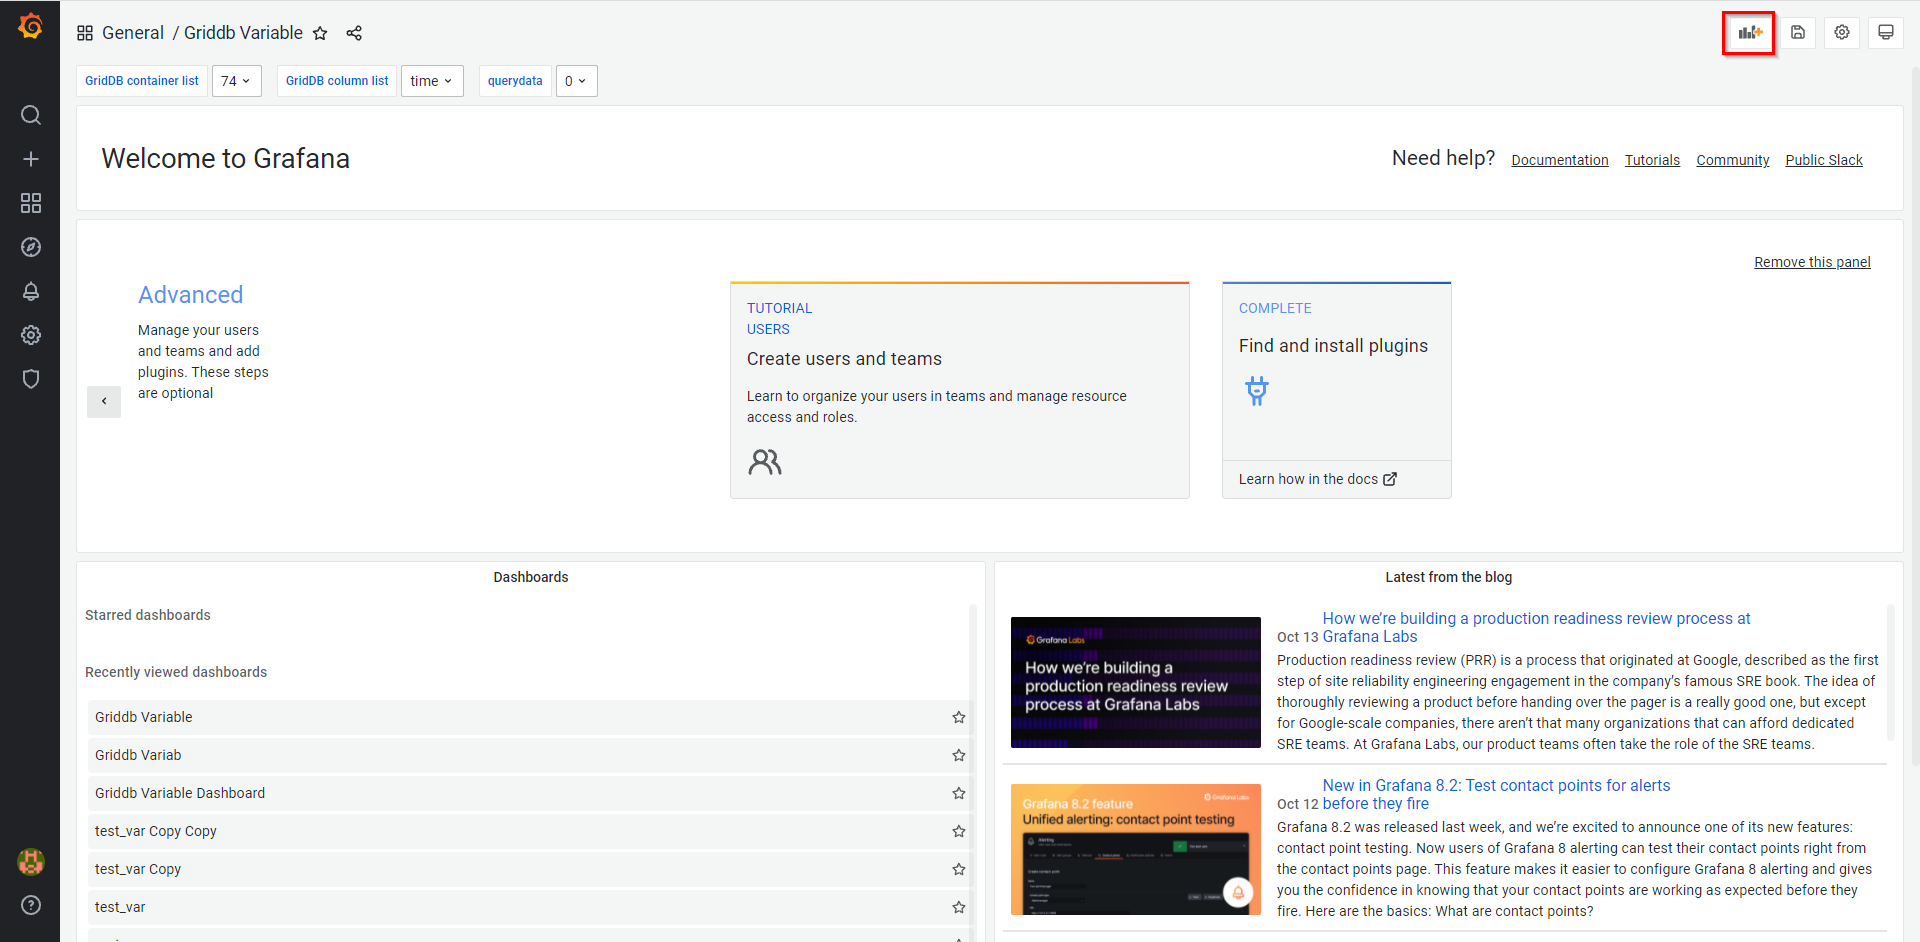
If a variable has been successfully created in the section Variable settings, the system will redirect you to the screen for the variables you have created.

Variable screen Click the Add panel button enclosed in a red rectangle on the top right side of the screen.
Adding a panel for the variable Follow steps 2 and 3 in the section Creating a dashboard for visualization.
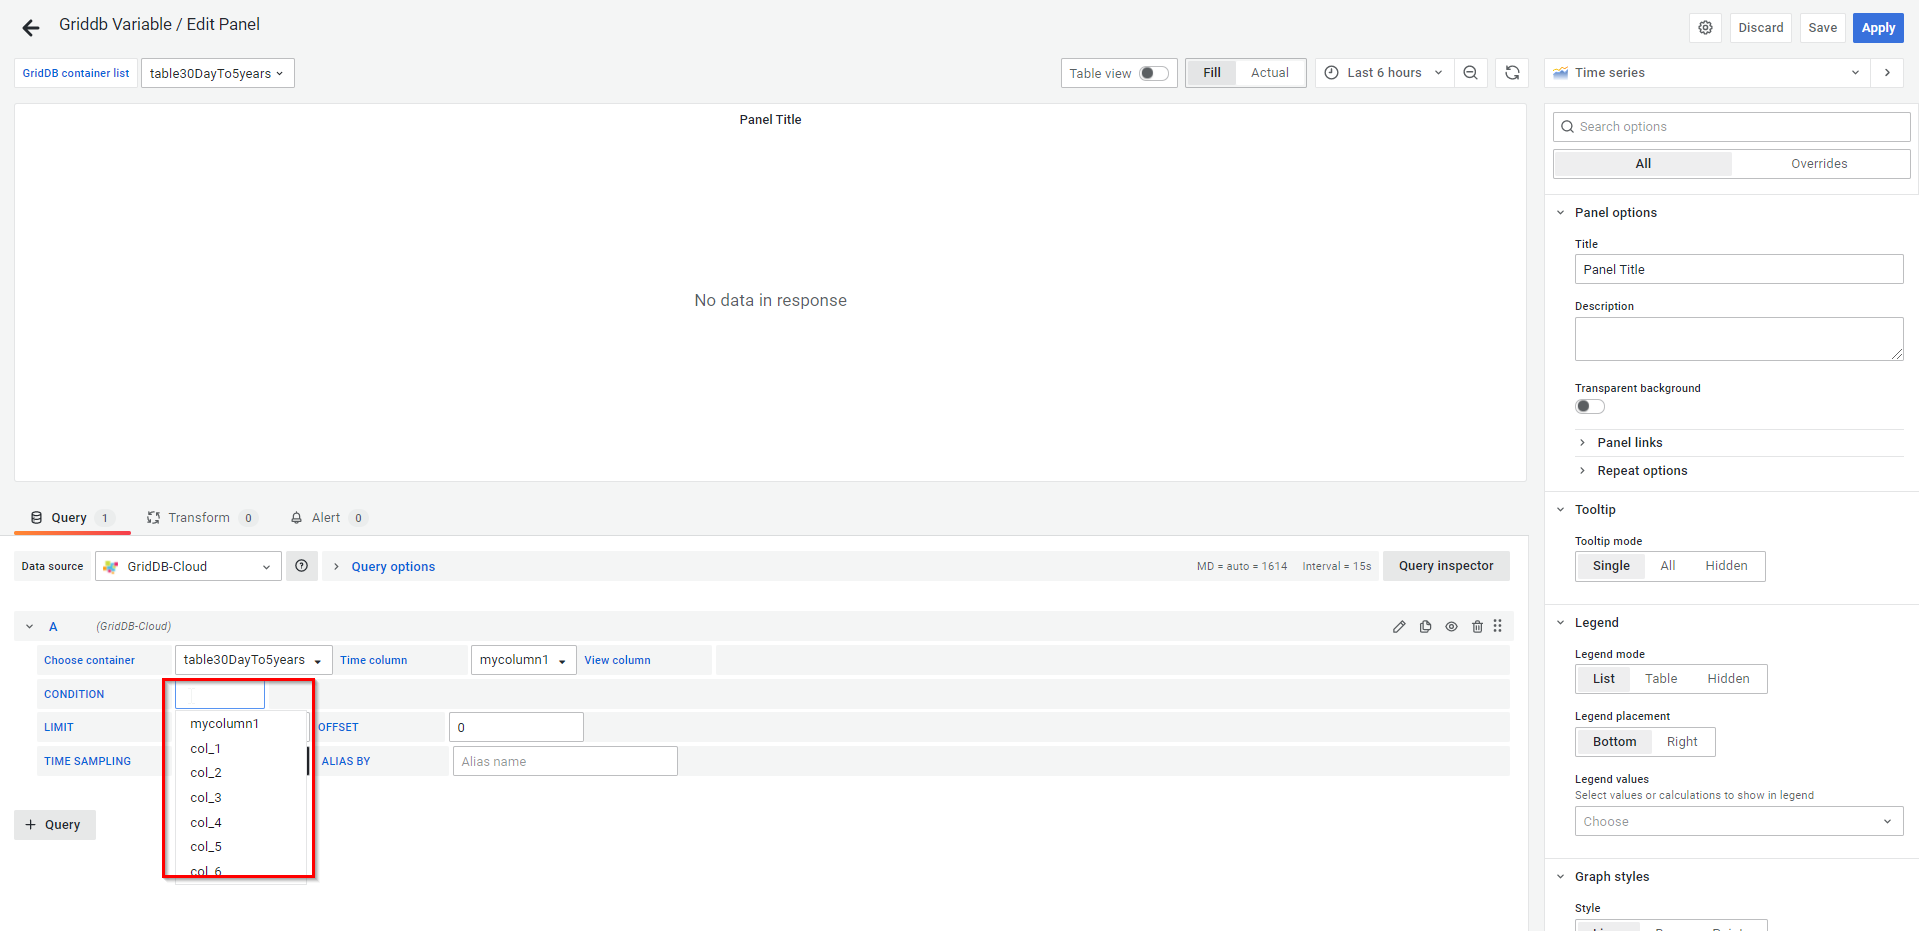
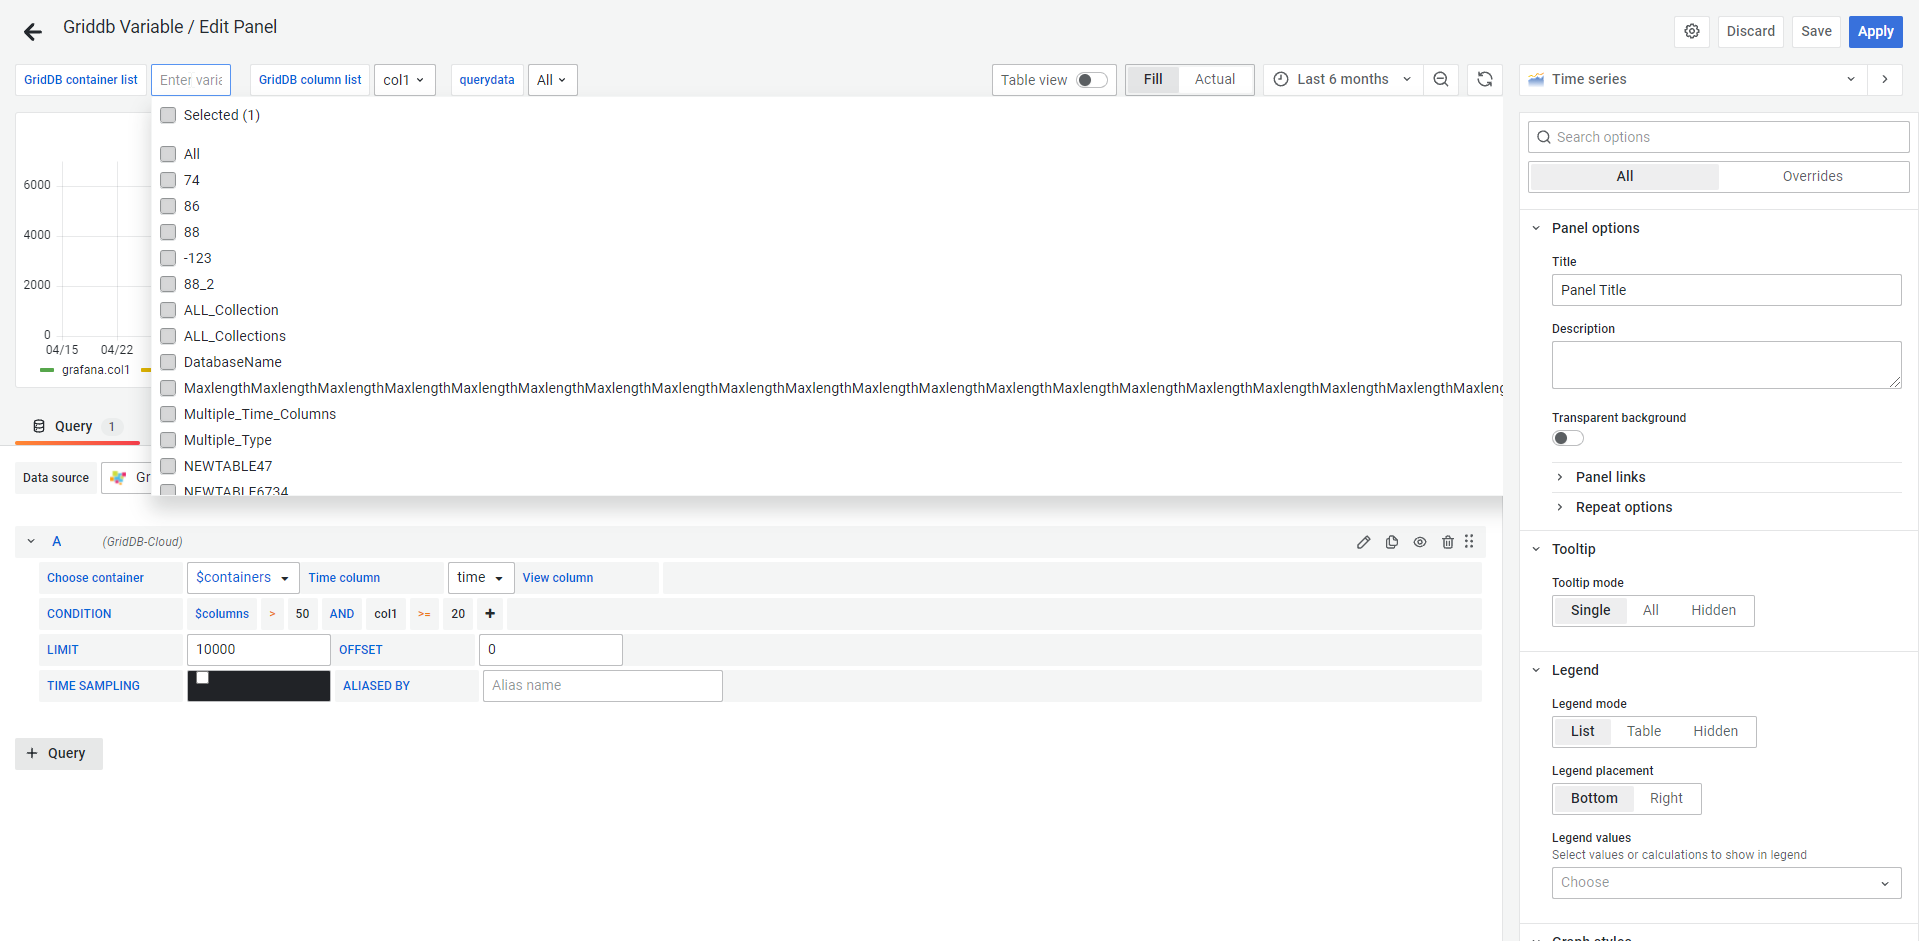
Select one of the container variables created in the section Variable settings.
Selecting container variables Select time columns as shown below:

Selecting time columns If you want to control data displayed in the graph, add one or more conditions in the CONDITION fields, where you can specify the variable you have created. Note that you need to enter a variable name manually due to a limitation. You cannot choose it from a drop-down list.
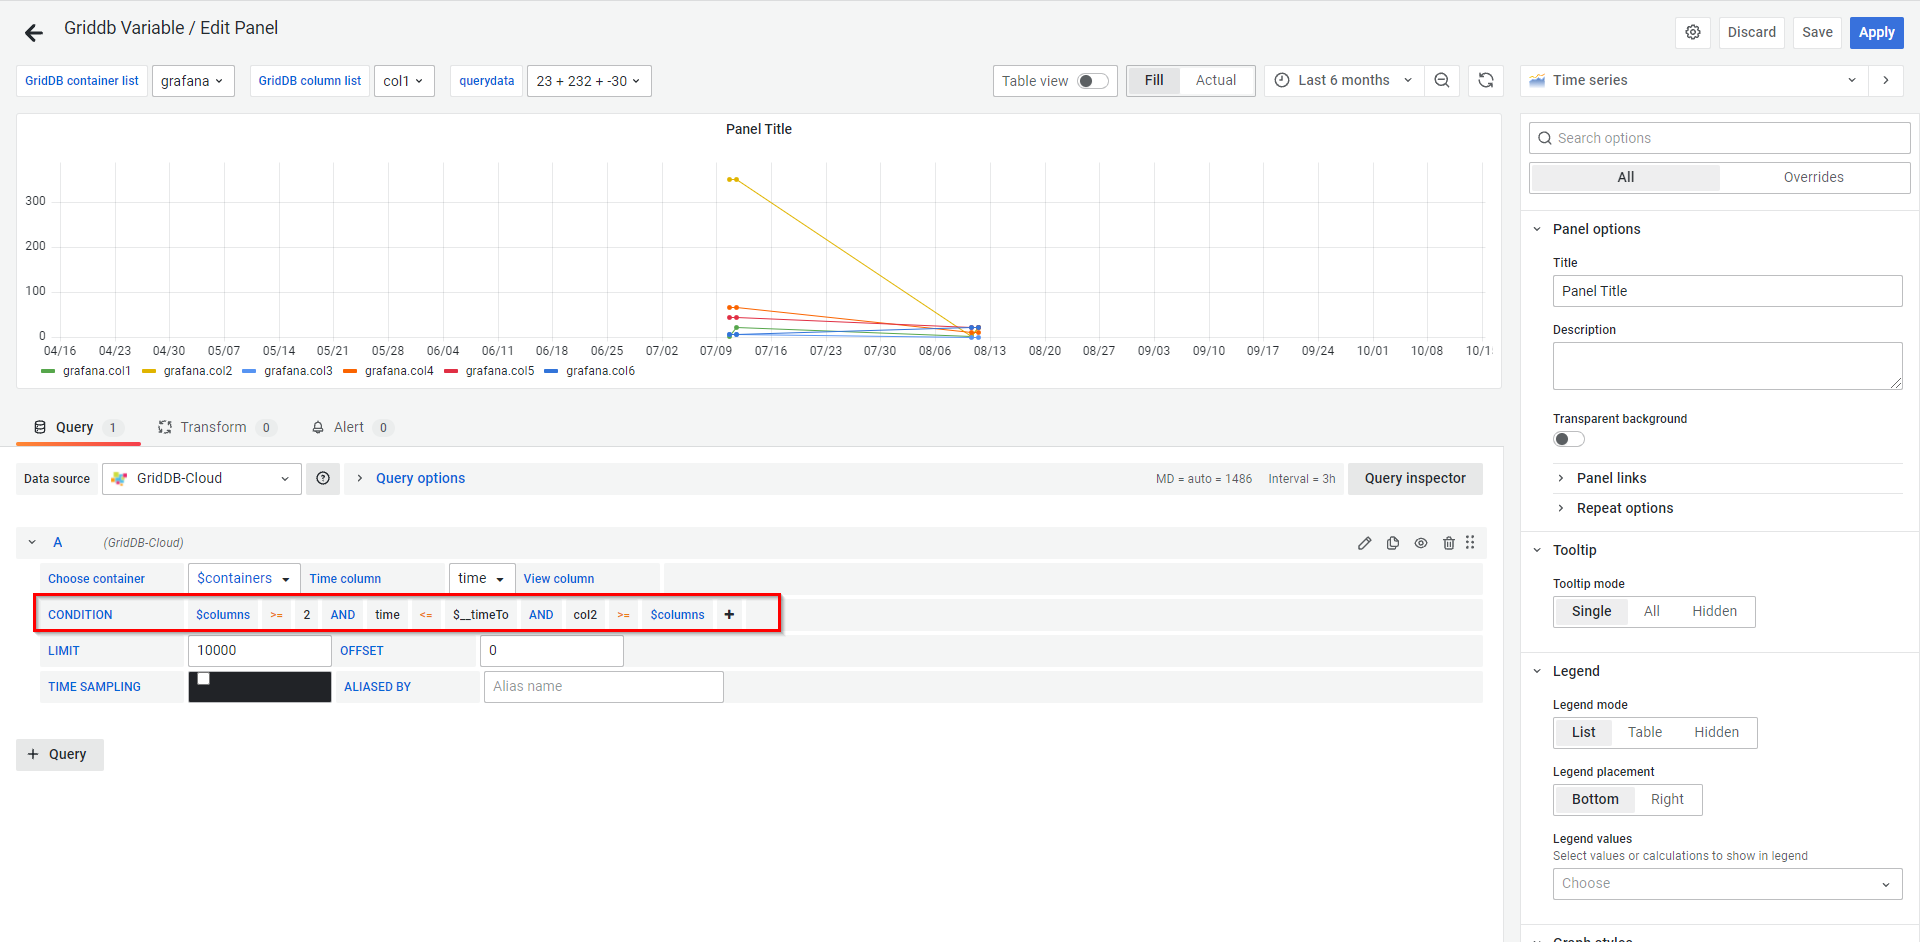
Adding conditions using variables Specify a concrete value in the list above the graph to reflect it to the variable.
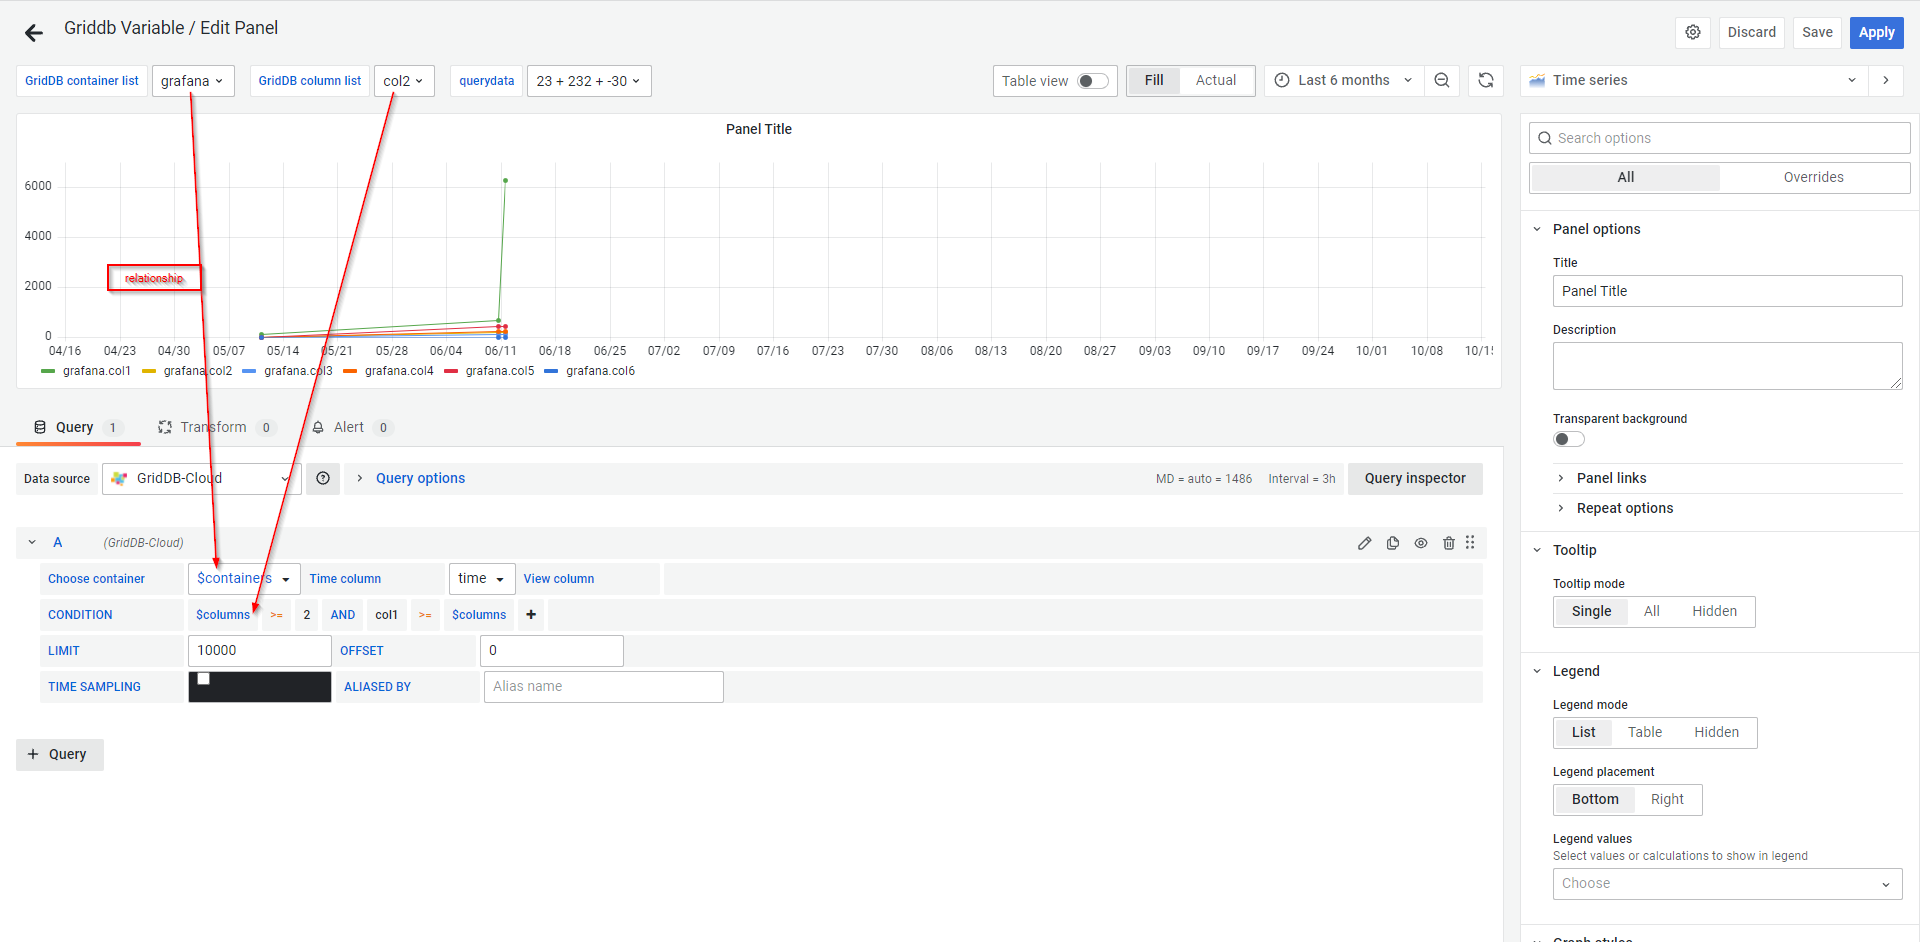
Relationship between a specific value and a variable
4.1.2.2 Annotations
In addition to creating a dashboard for visualization as explained in the section Creating a dashboard for visualization and visualizing data with variables, you can set annotations to mark points on the graph with rich events. When you hover the mouse cursor over an annotation you can obtain event description and event tags. The text field can include links to other systems with more detail.
For more details, refer to Grafana annotations.
4.1.2.2.1 Annotation settings
Open any panel and click the Settings button on the top screen.
In the side menu under Settings, click the link named Annotations.
Click the + Add Annotation Query button.
Currently, the GridDB input plugin supports two annotation types, i.e., annotation and region annotation. The region annotation is used for a container with multiple time columns (e.g., Multiple_Time_Columns).
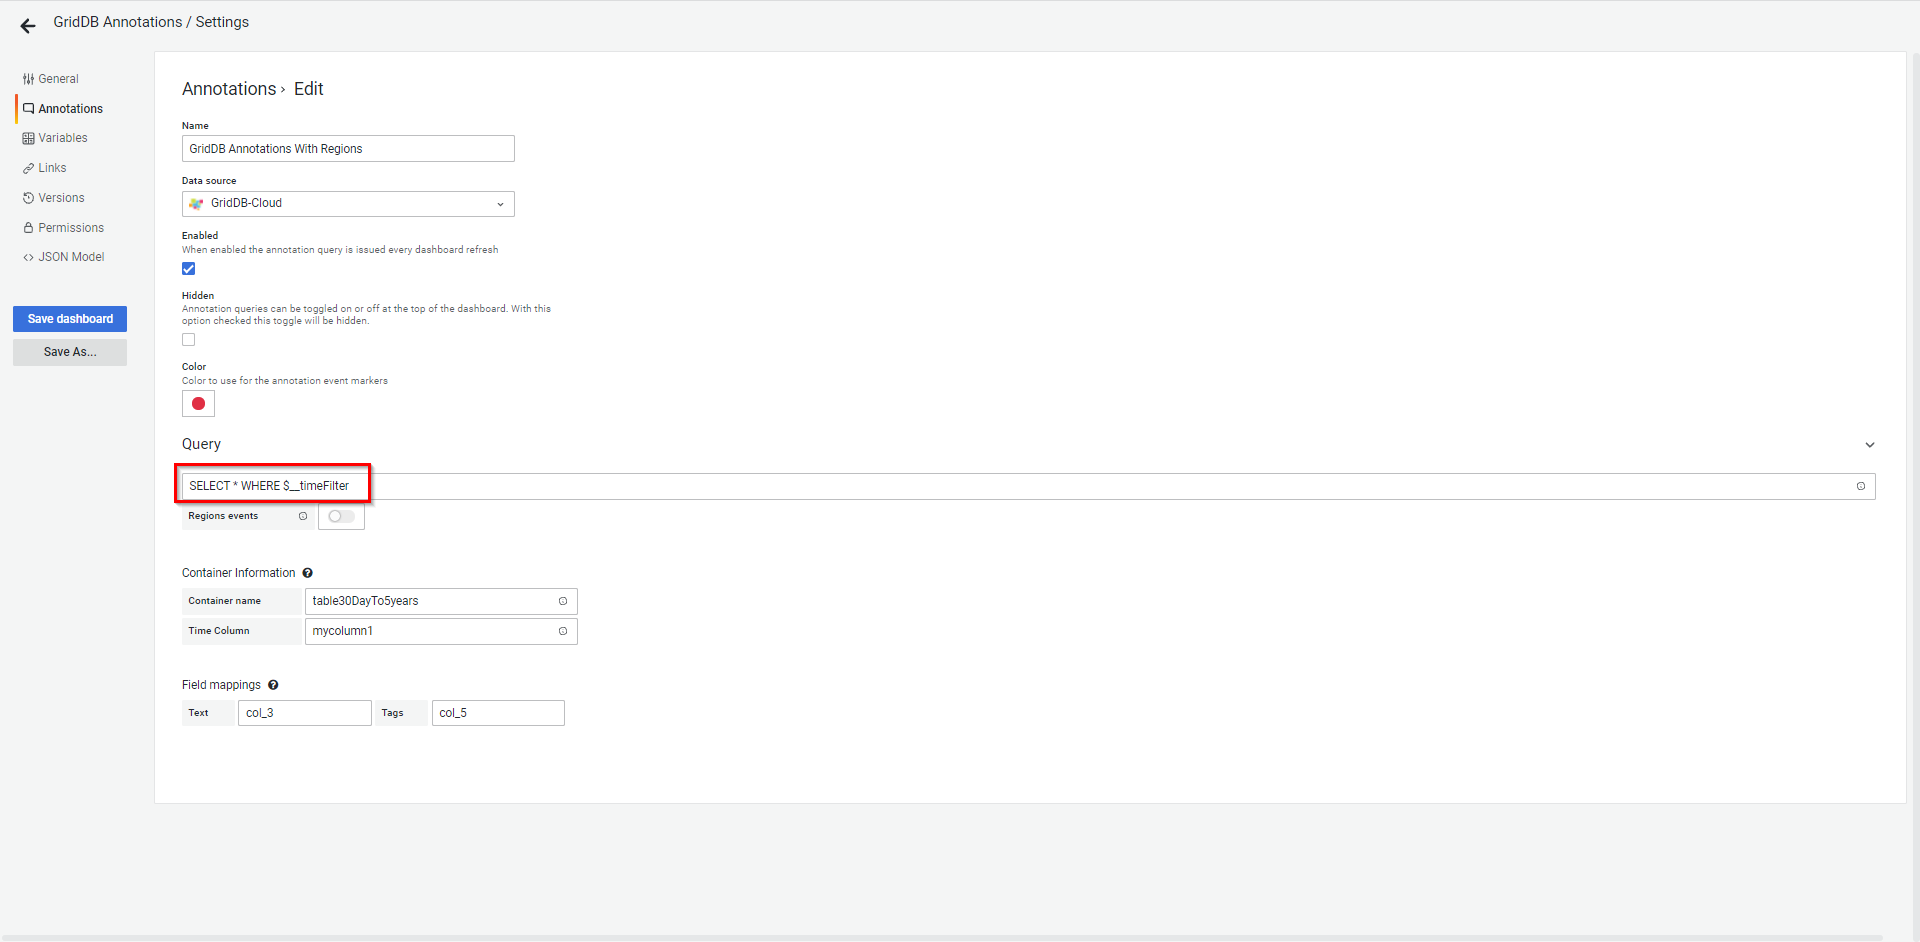
4.1. Enter the following data to create a annotation.
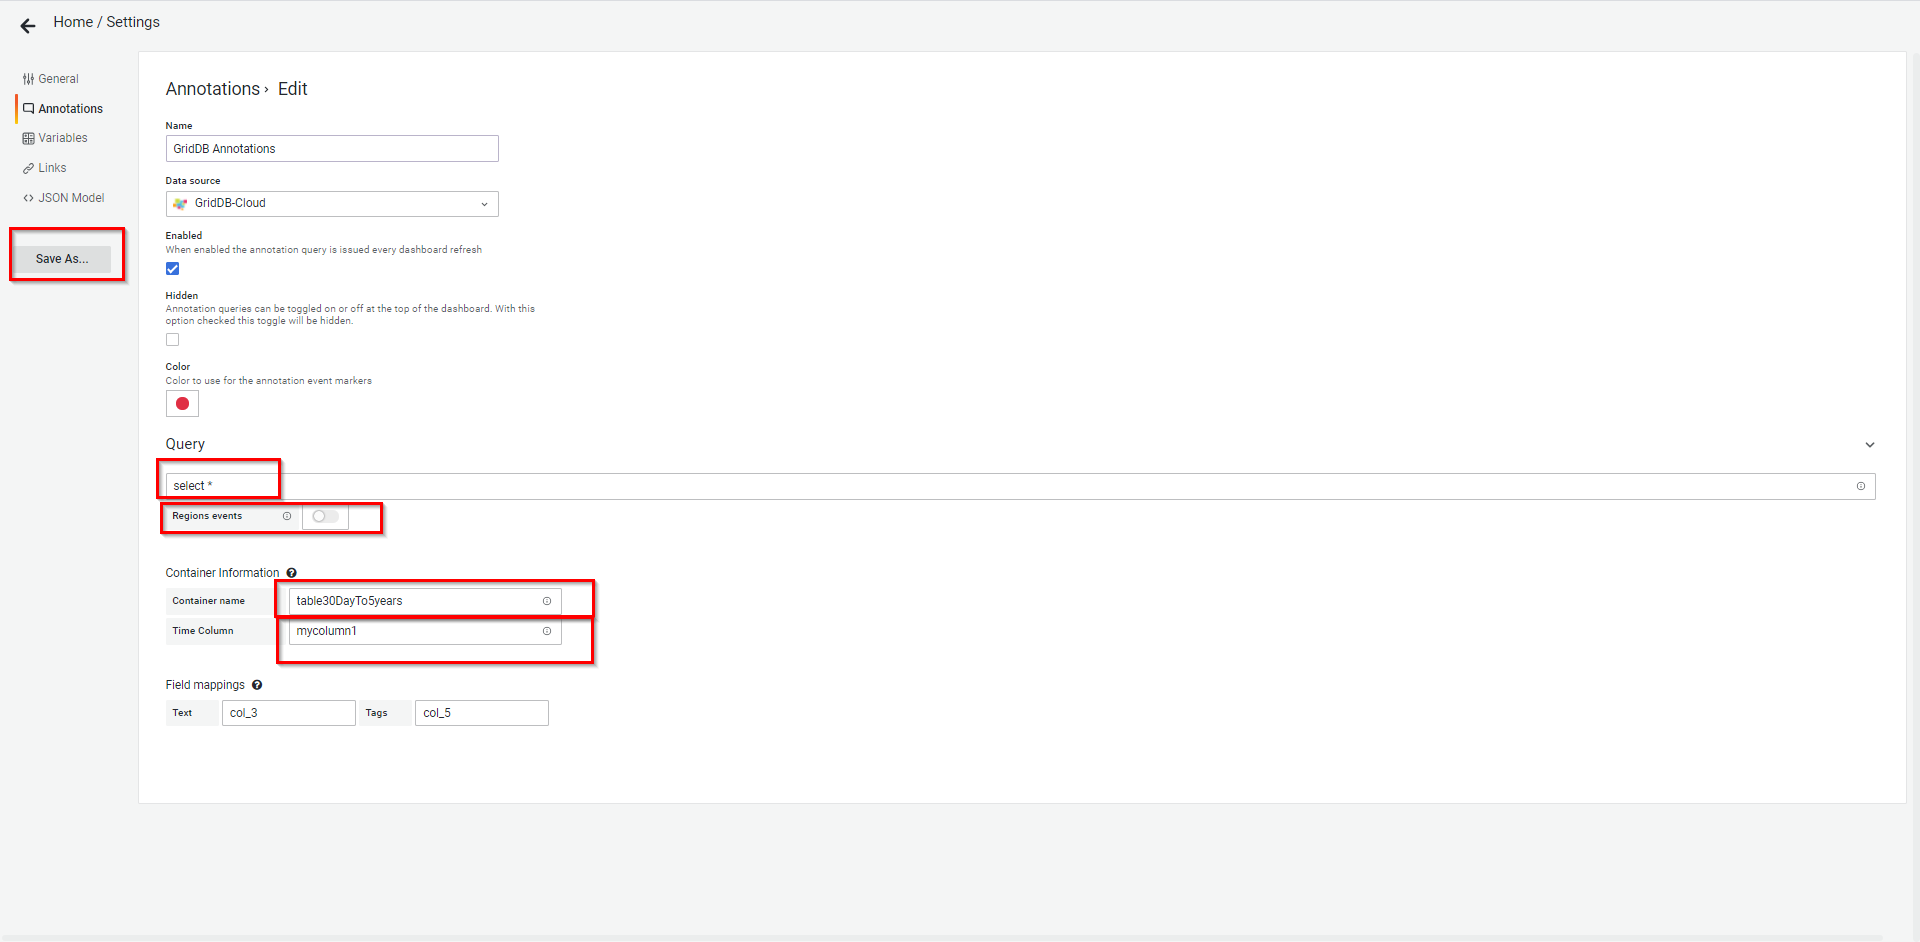
Creating annotations
4.2. Enter the following data to create a region annotation.
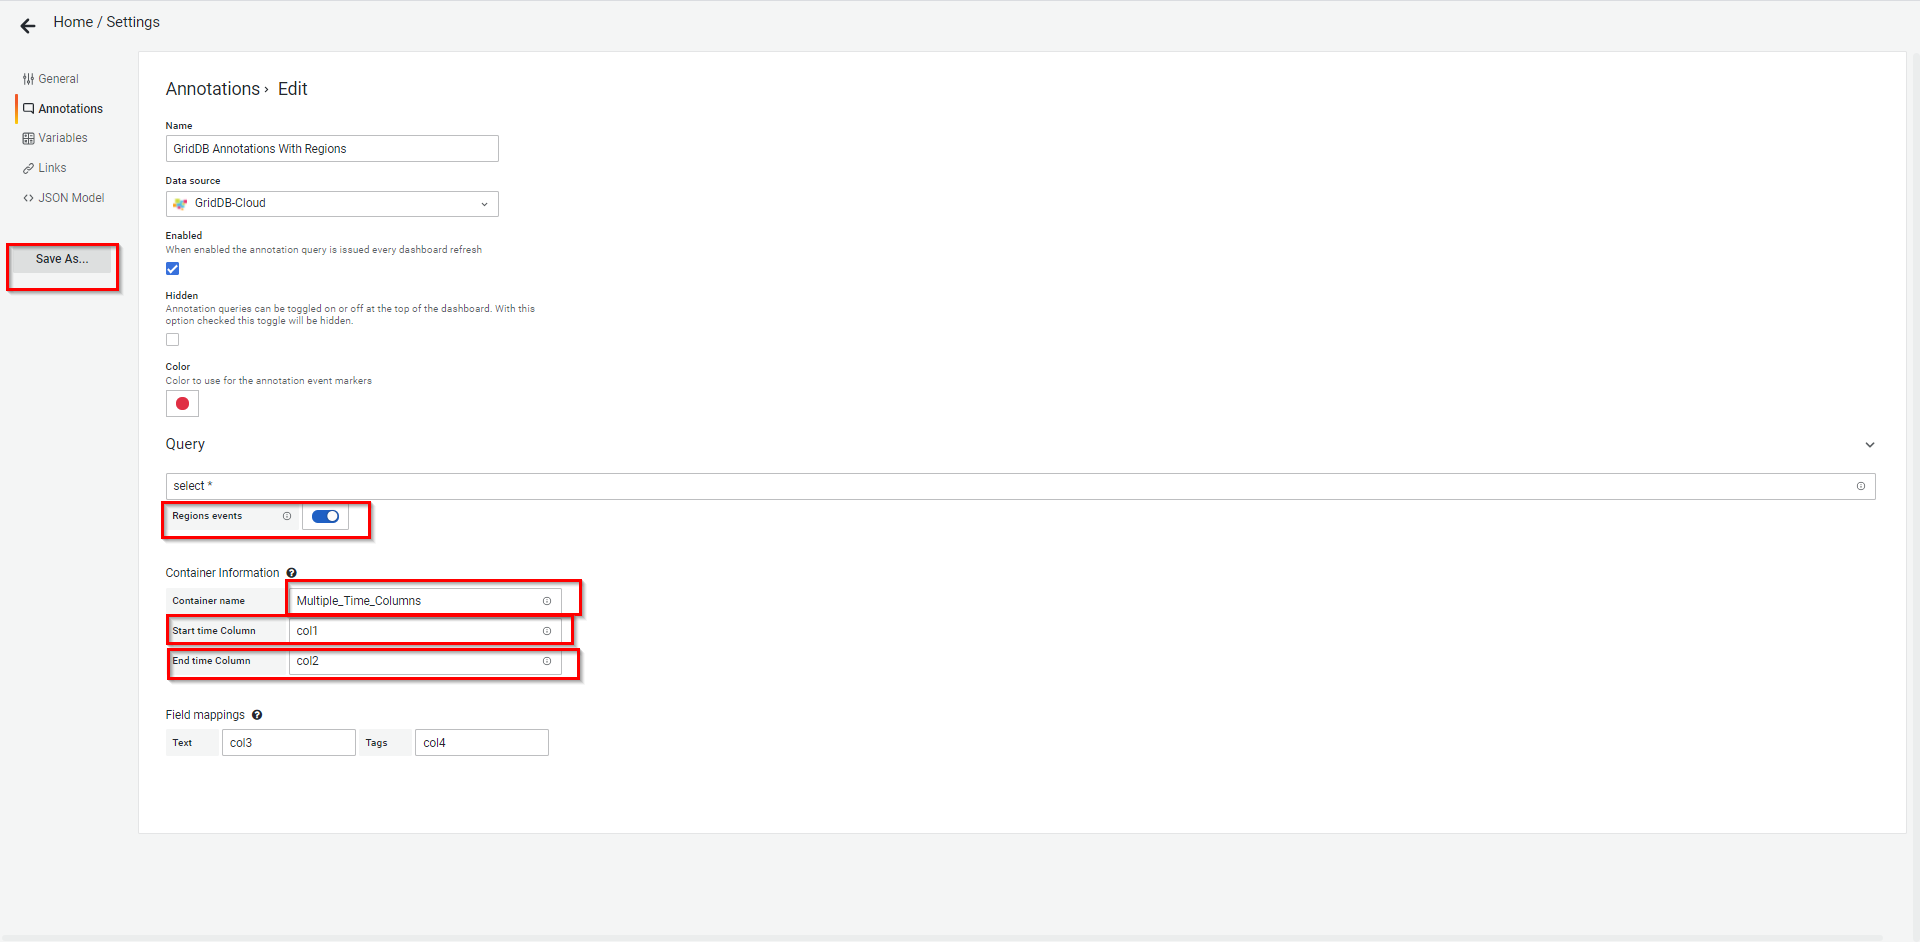
Refer to Appendix to learn about some of the arguments you can add to the query field to create a dynamic query.
Click the Save As... button to create an annotation.
Add dashboard information in the Save dashboard as... dialog in a similar manner to the way that you have created a variable and click the Save button to save the dashboard.
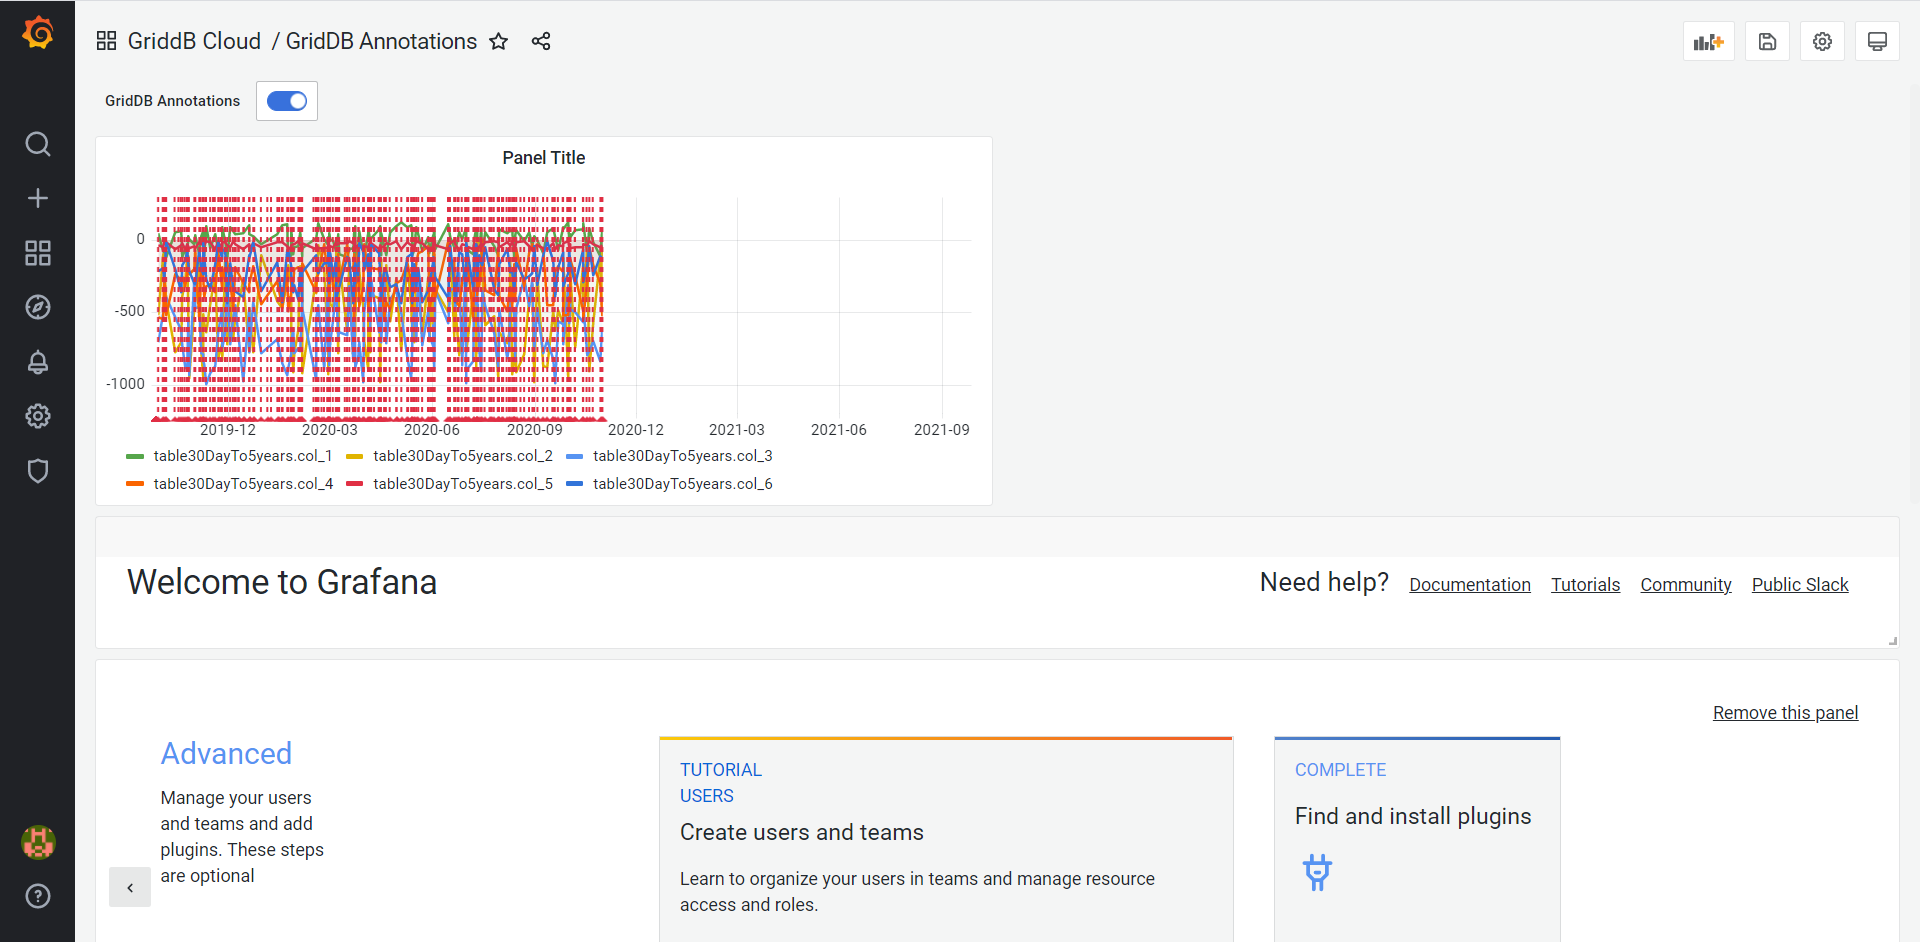
After saving the dashboard, a dashboard will which has the annotation that you have created previously is created.
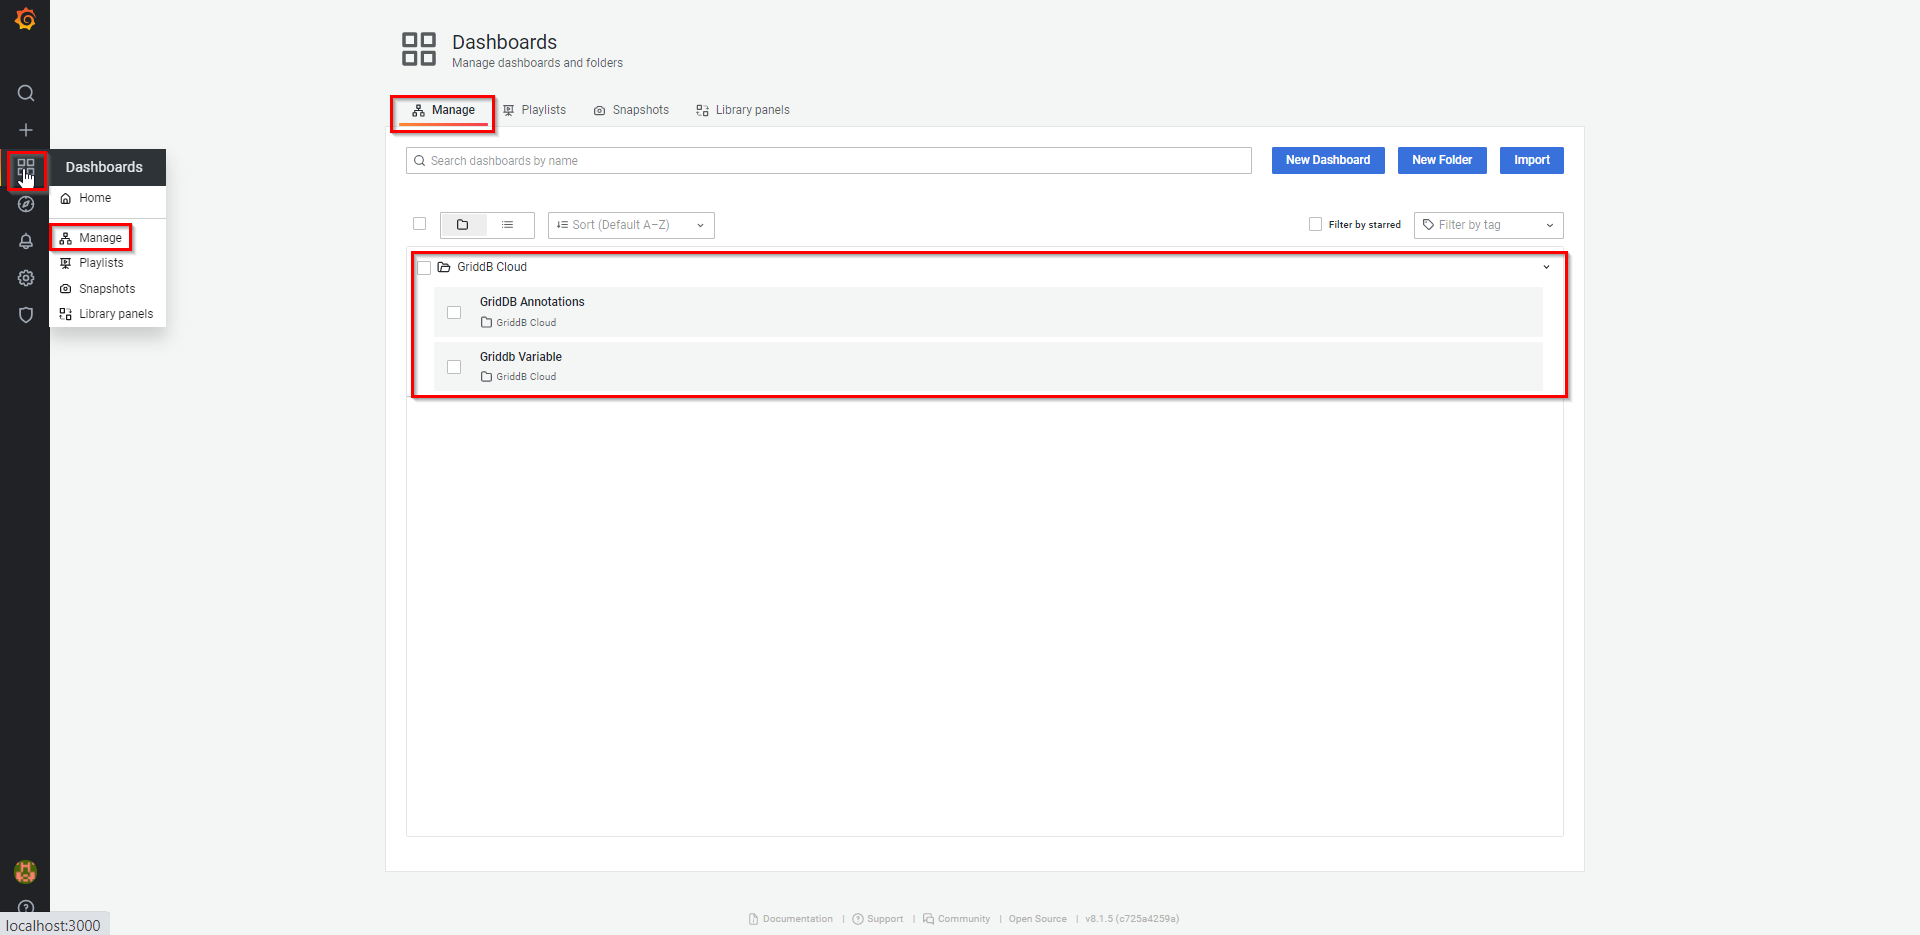
After completing dashboard settings, in the side menu under the Dashboards link, click the link named Manage. Under the Manage tab, the following screen will appear, displaying a list of the dashboards you have set up.
4.1.2.2.2 Visualizing data with annotations
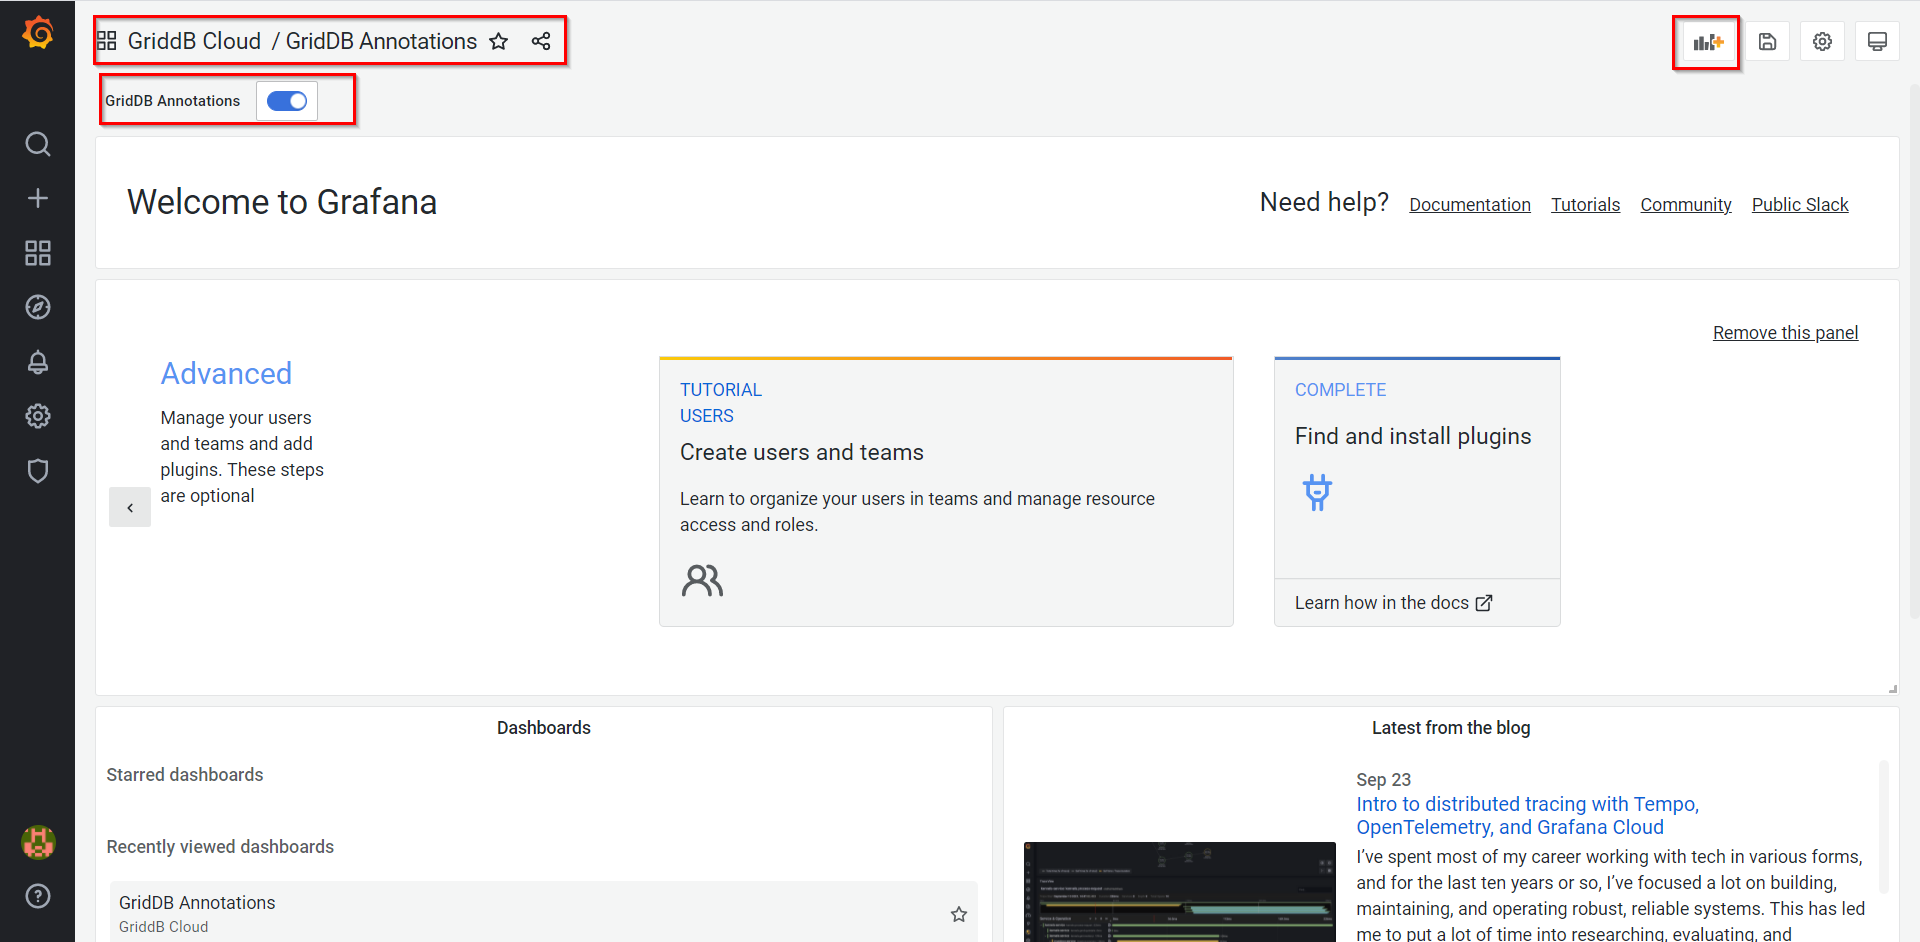
If an annotation has been successfully created in the section Annotation settings, the system will redirect you to the screen for the annotation you have created.
Select a container name from the drop-down list and click the Add panel button as shown below.
Annotation screen An annotation panel will appear. Add a query in a similar manner to the way that you have added a query in the previous section for data visualization.
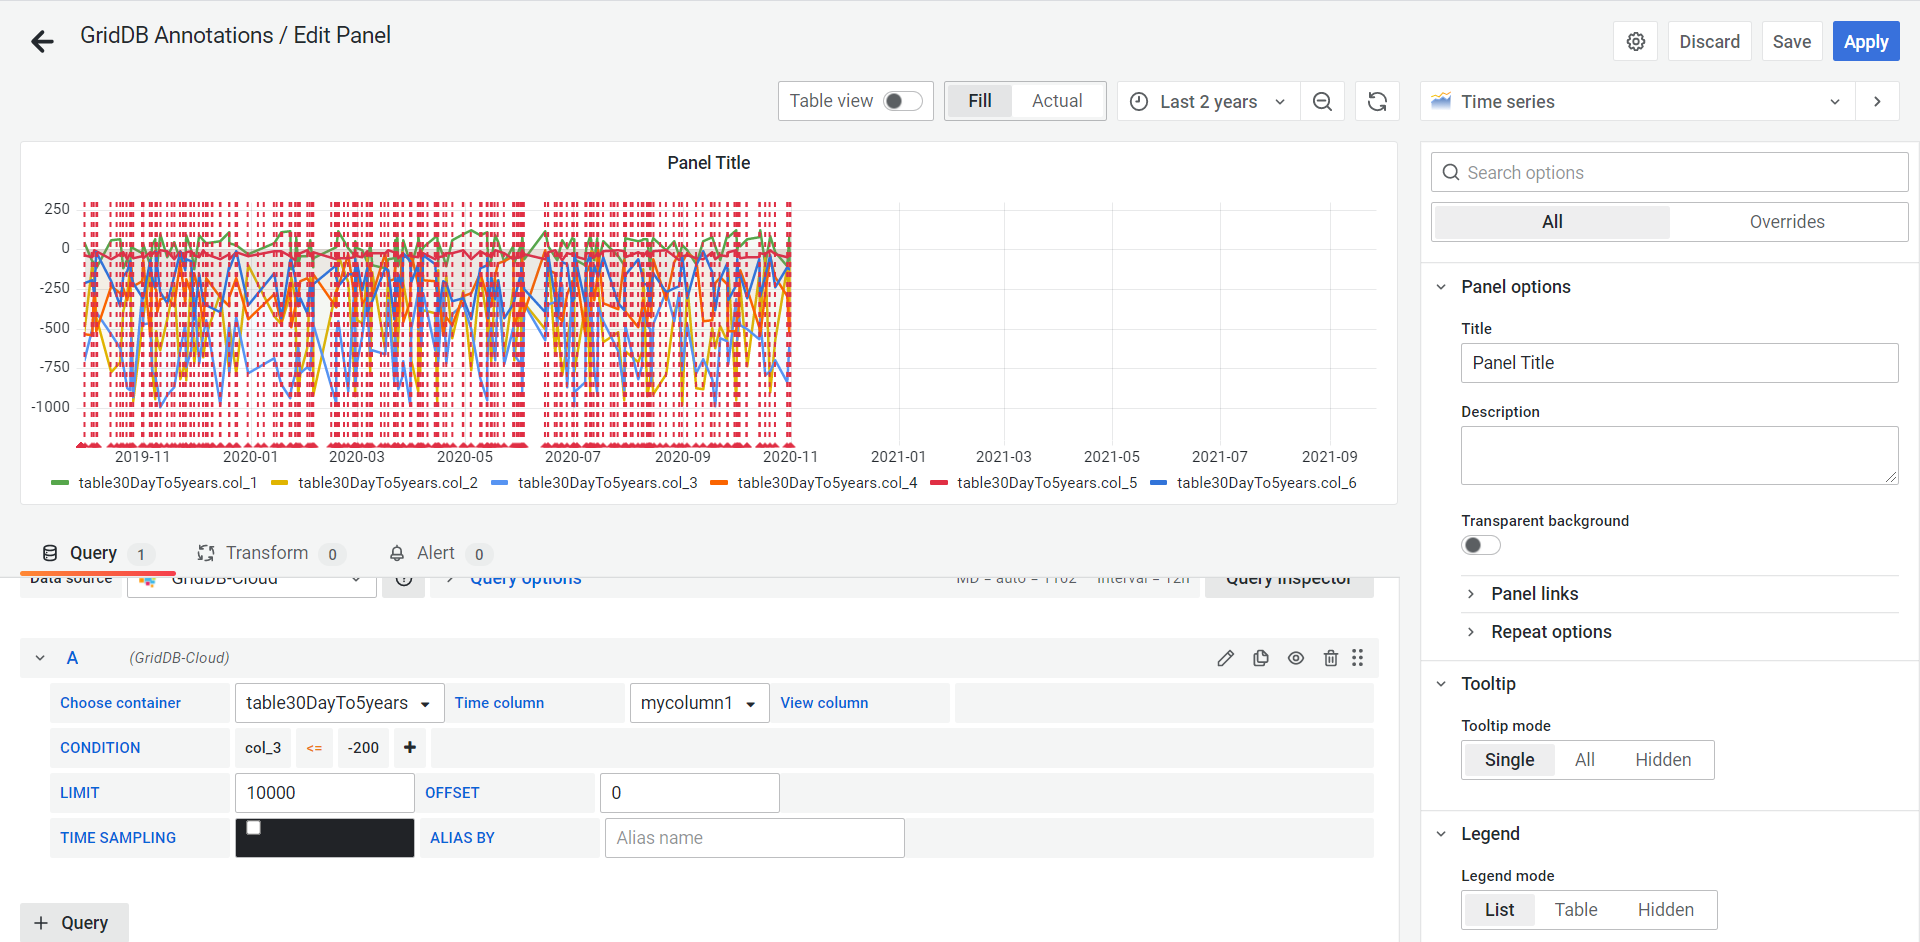
Annotation panel The following annotation screen will appear.
4.2 Explore
The Explore screen can be accessed in two different ways (1.1. and 1.2.).
1.1. Click Explore in the side menu.
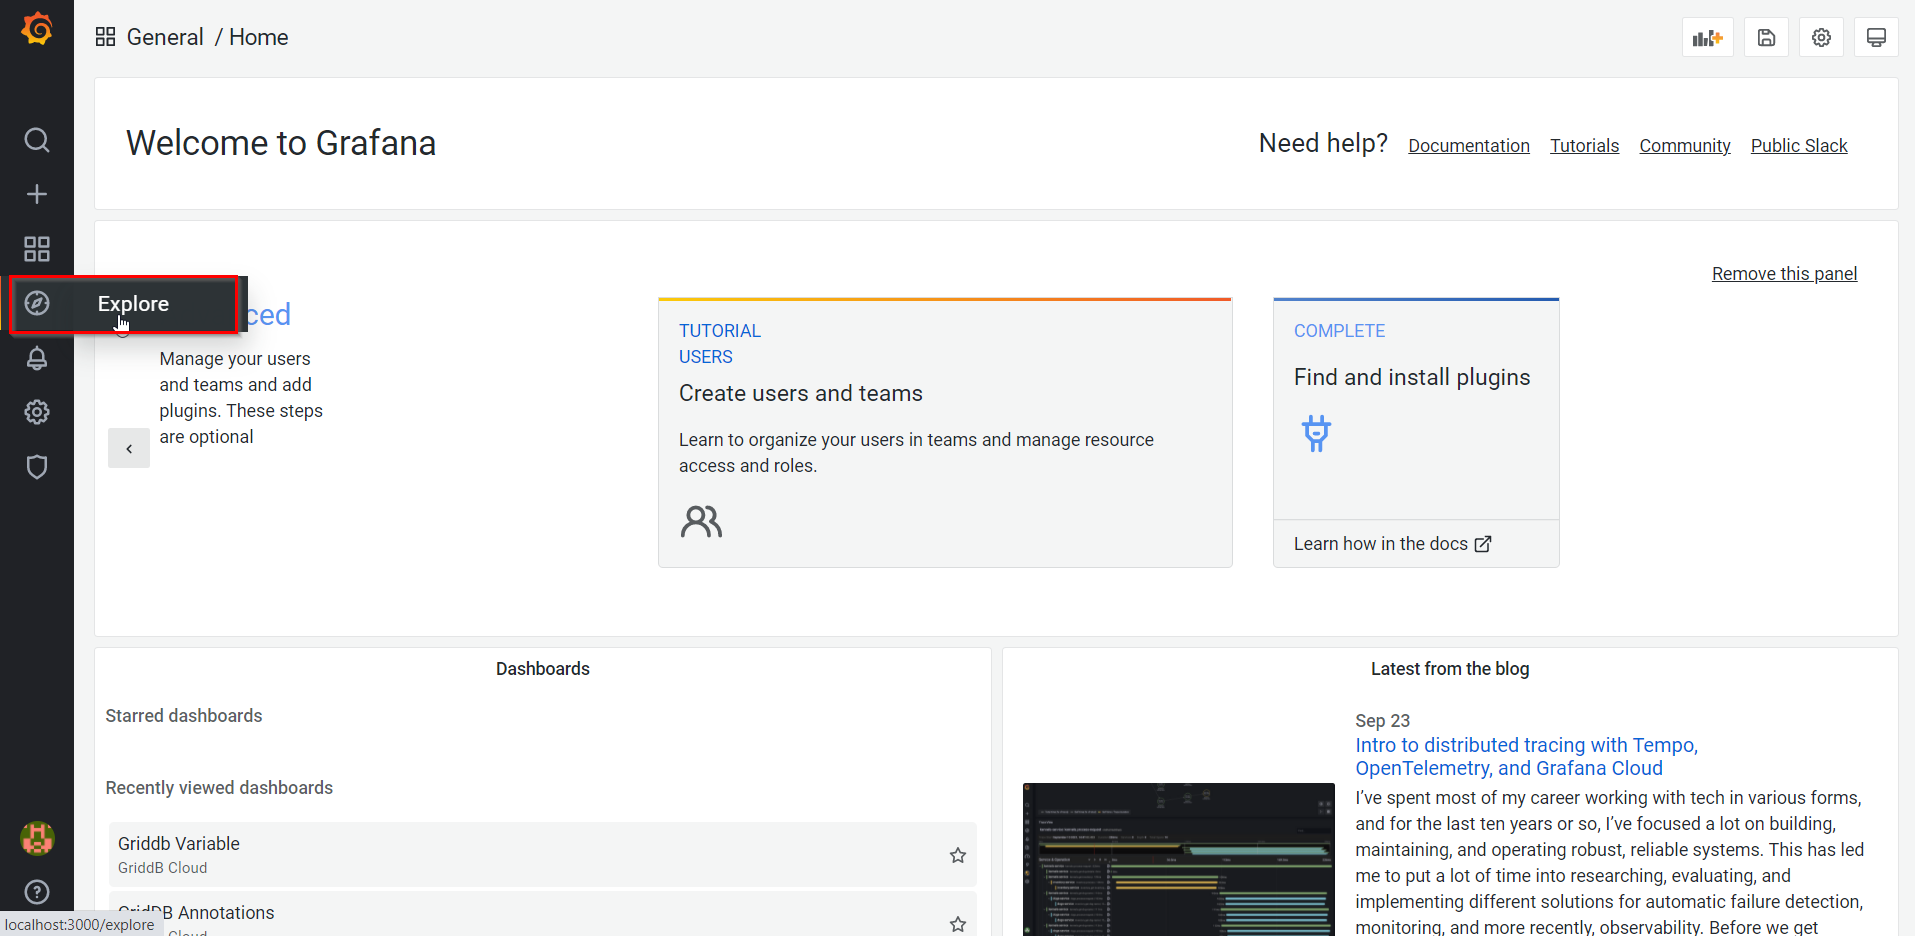
Clicking Explore in the side menu The system displays the following screen without selecting any data.
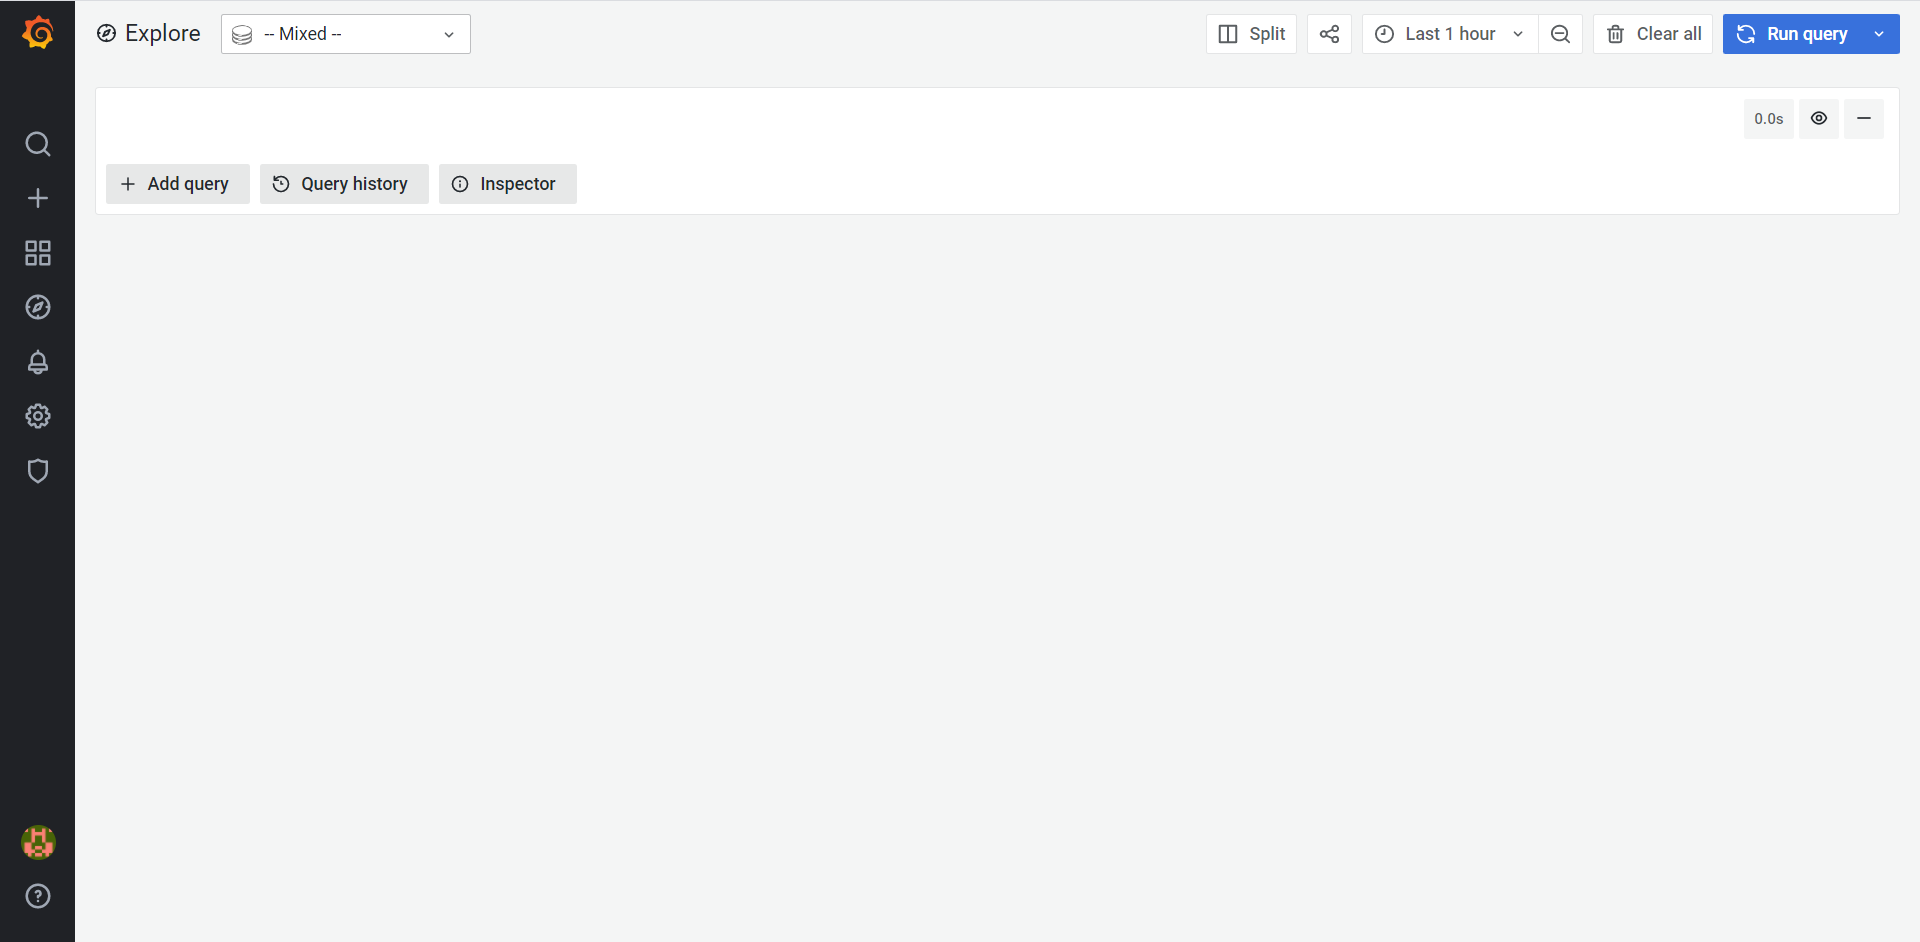
Explore screen from the side menu 1.2. In the variable or annotation screen for visualization, click the option Explore from the Panel Title drop-down list.
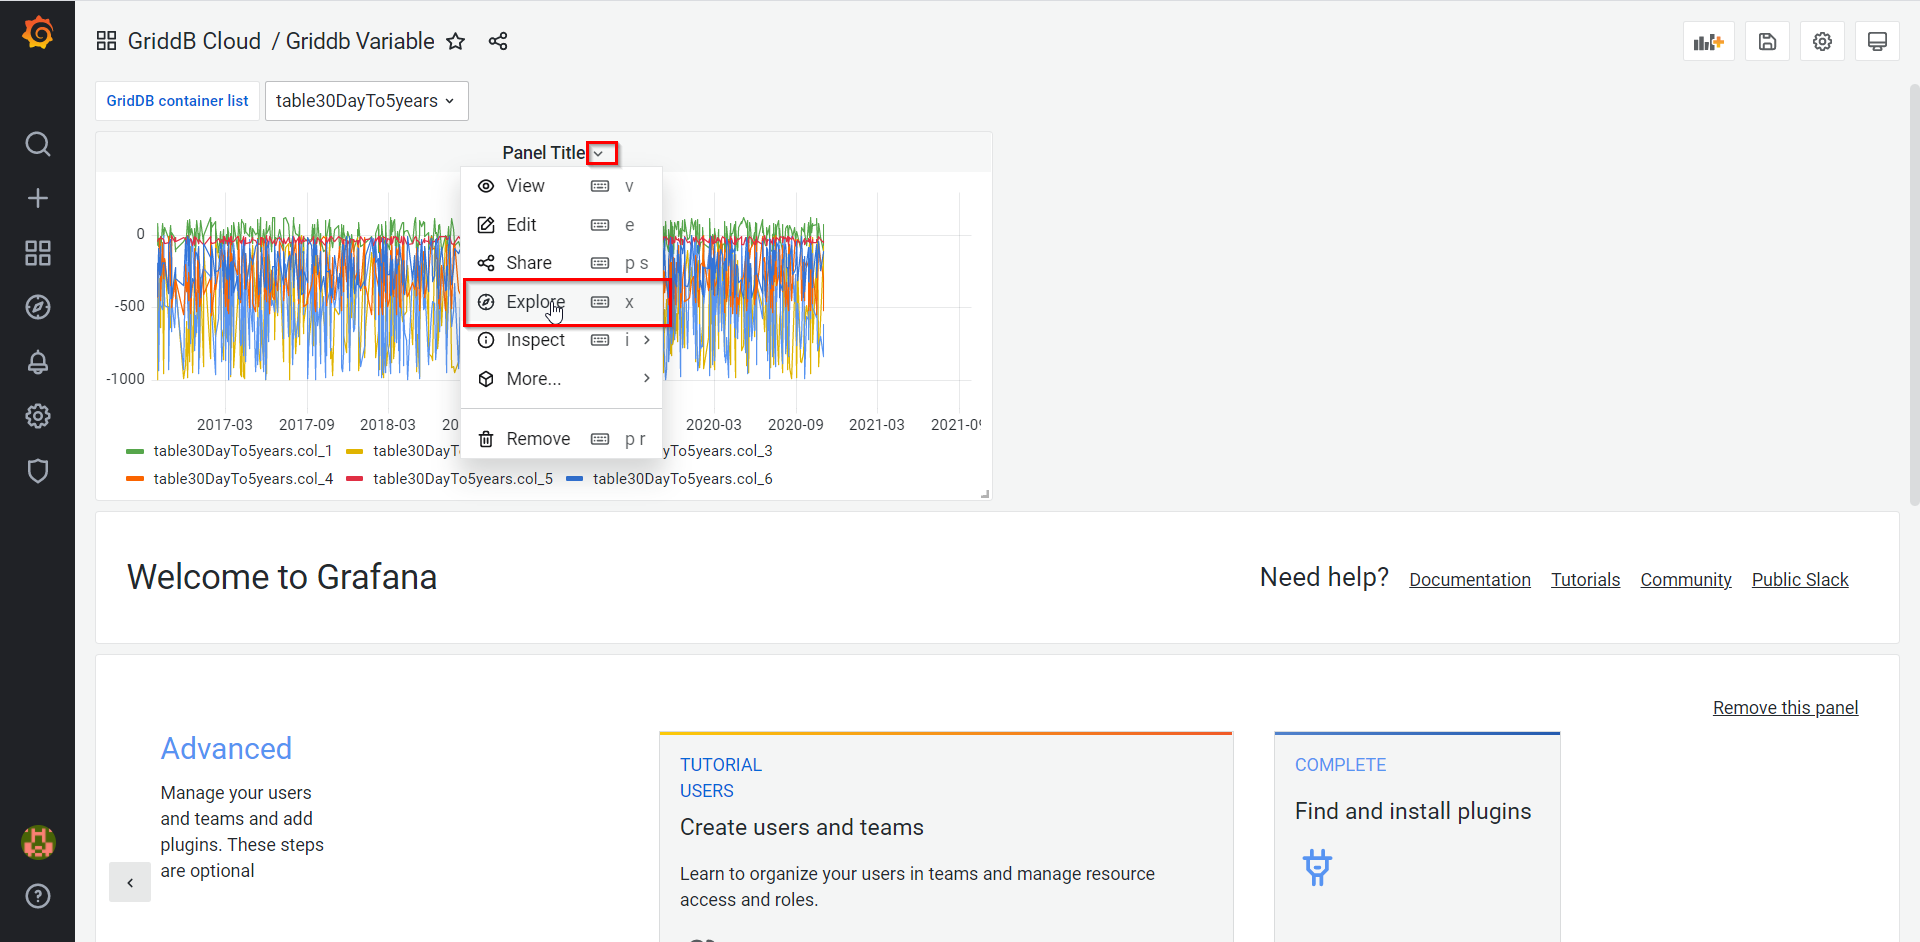
Explore screen from a visualization screen The system displays the Explore screen with a time range obtained from the currently selected visualization dashboard.
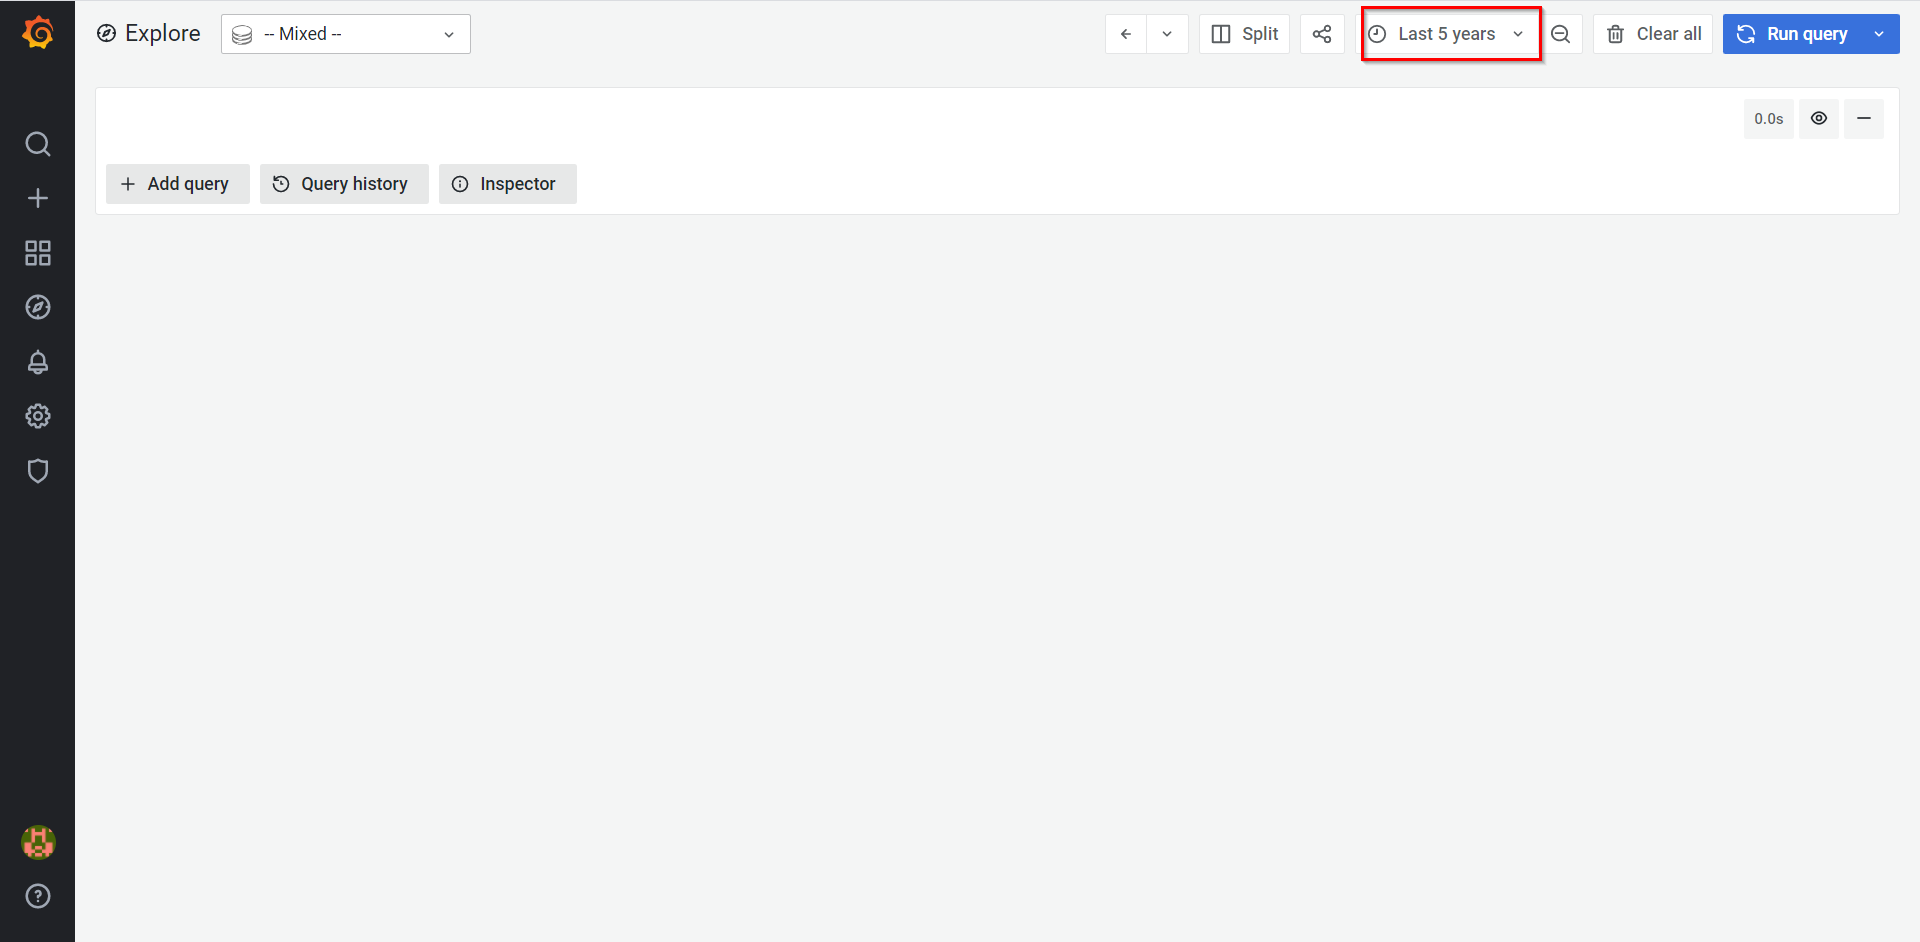
Explore screen with a time range obtained from a visualization dashboard Add a query in a similar manner to the way that you have added a query in steps 4, 5, and 7 in the section Creating a dashboard for visualization.
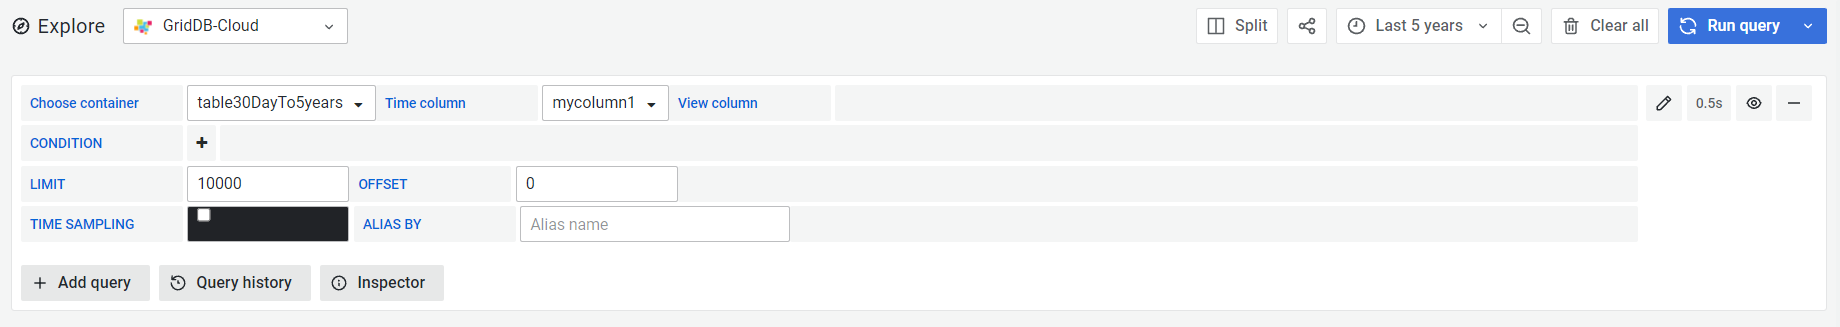
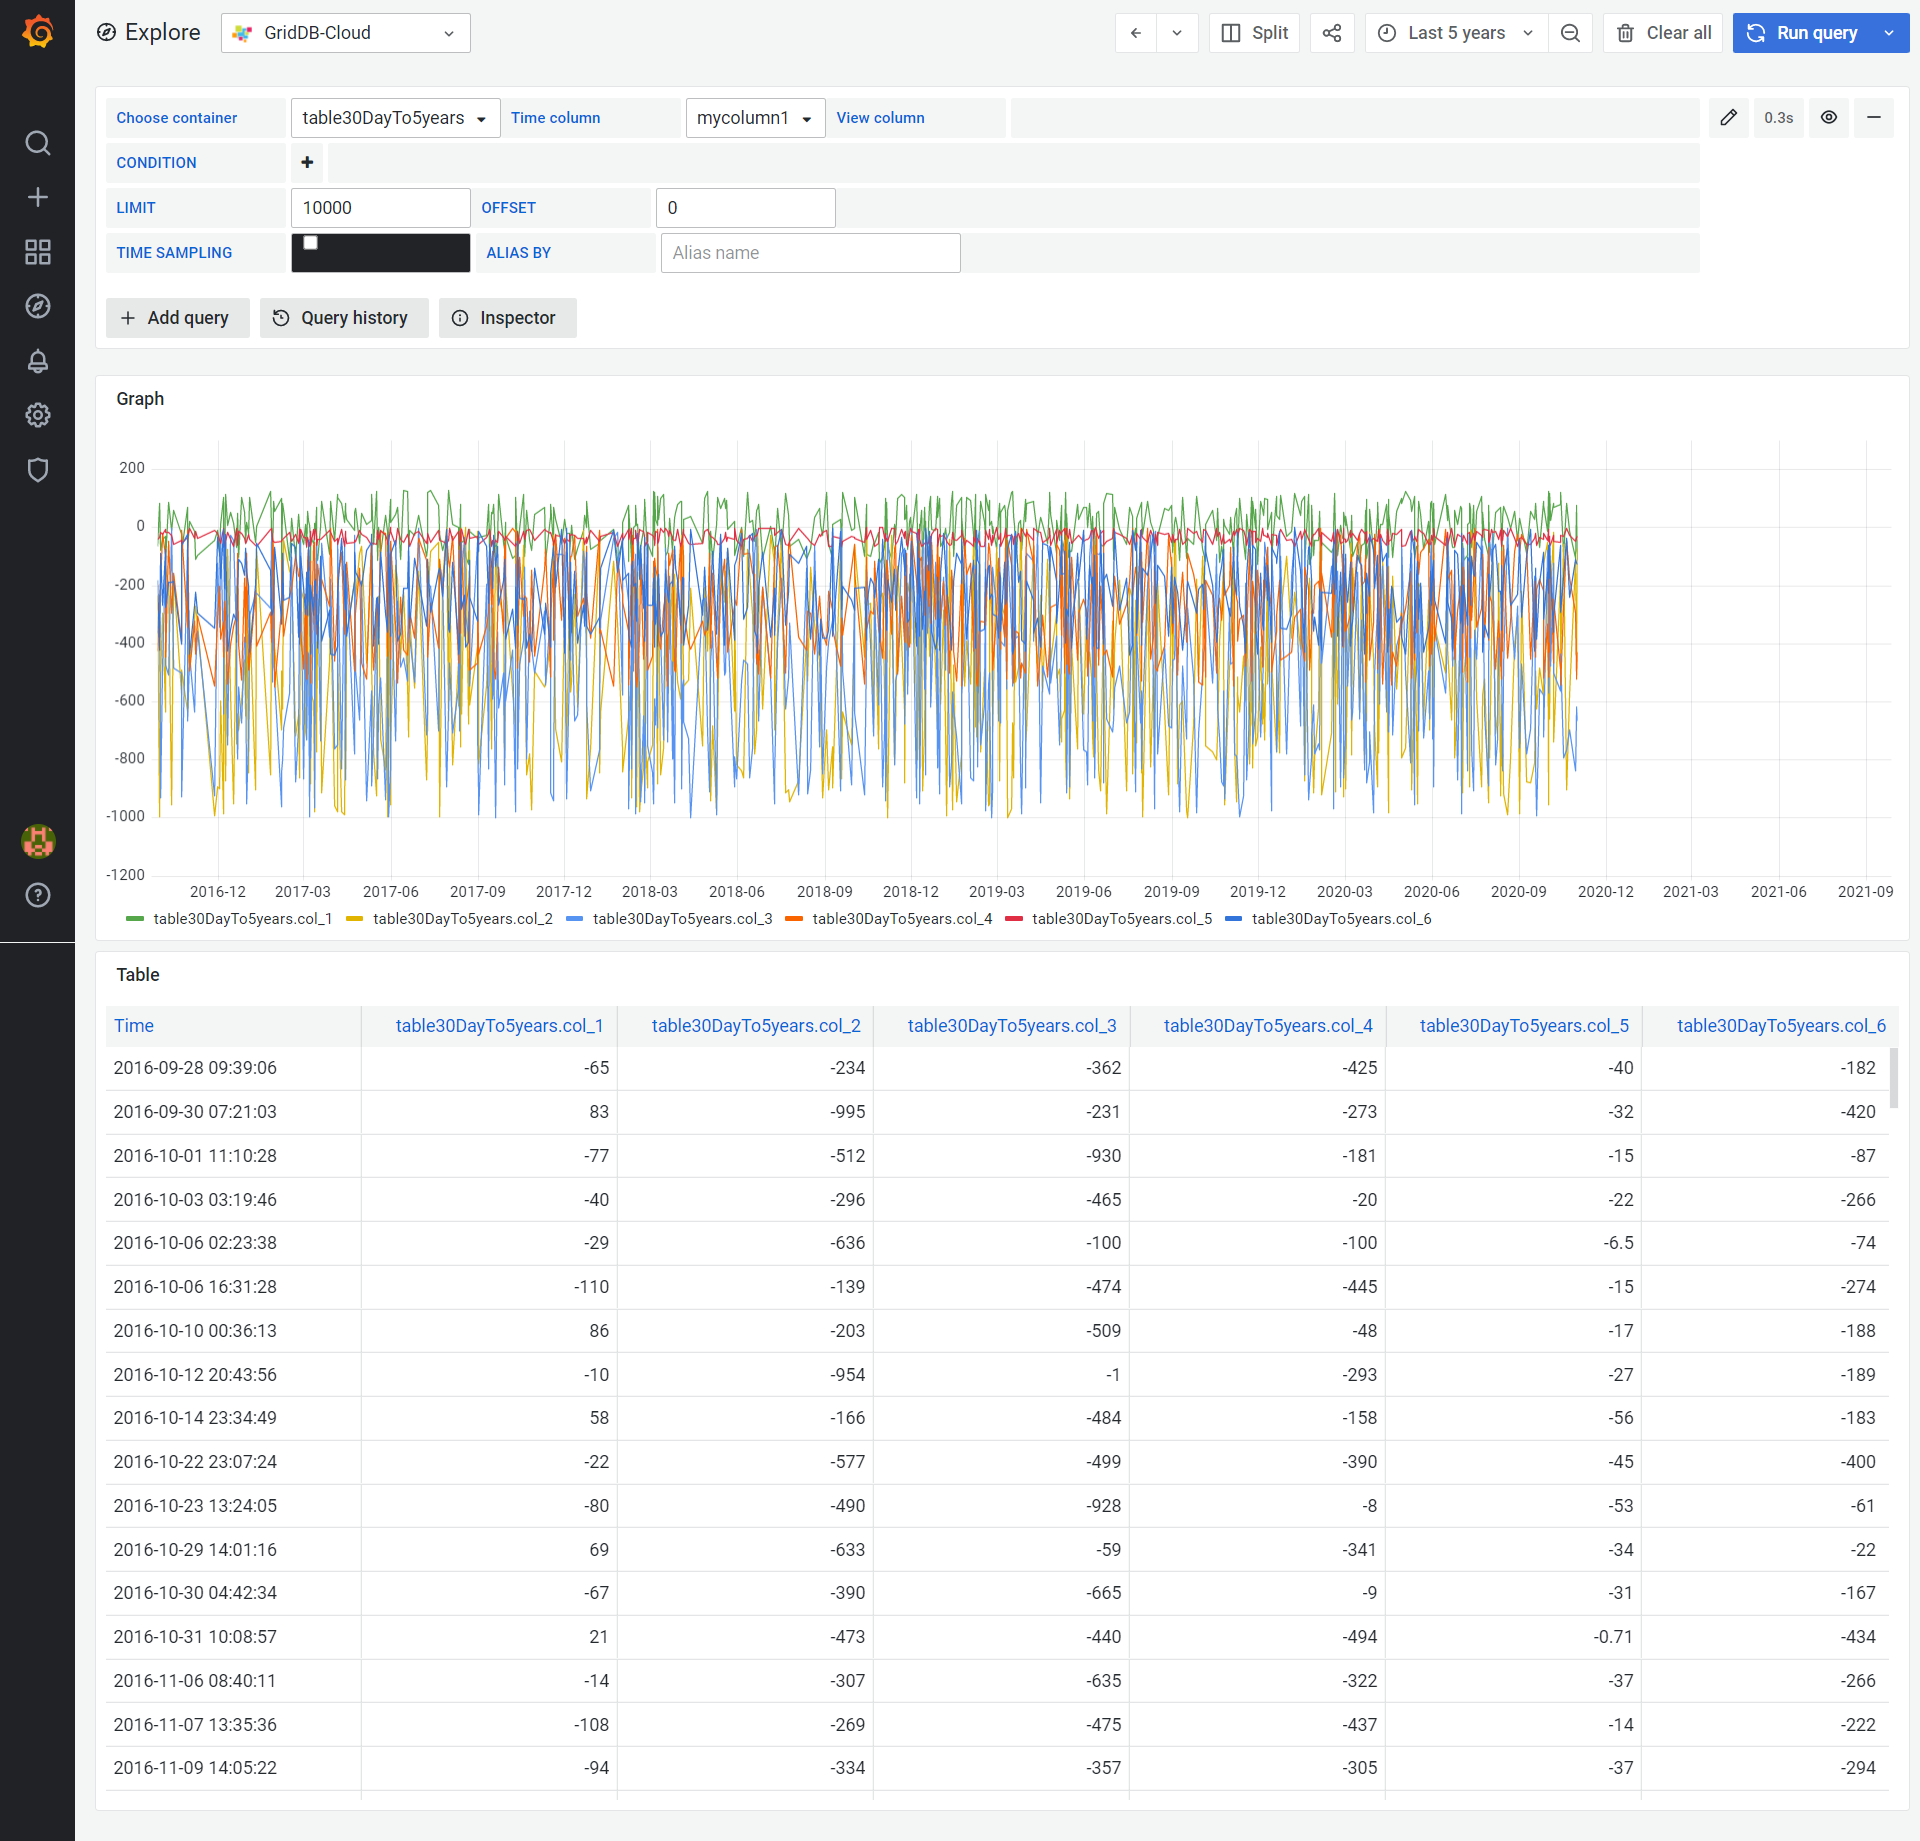
Adding a query on the Explore screen Click the Run query button to update the data.
The following Explore visualization screen is displayed.
5 Related content
6 Appendix
6.1 Special query expressions
The following expressions can be used in queries to create a dynamic query.
6.1.1 Available special query expressions
| Name | Description |
|---|---|
| Special variables: The following syntax is replaced by a special value defined by the GridDB input plugin for Grafana. | |
| $__timeFrom | The start of the current time range of a dashboard to be replaced by: TIMESTAMP({Dashboard start time}) 📝 : The current time range is on the top right corner of the dashboard. |
| $__timeTo | The end of the current time range of a dashboard to be replaced by: TIMESTAMP({Dashboard end time}) 📝: The current time range is on the top right corner of the dashboard. |
| $__col | Used in alias patterns. Replaced by a specific column name. |
| $__container | Used in alias patterns. Replaced by a specific container name. |
| $__interval | Used only in a $__timeSampling macro. The value for this variable will scale with a dashboard time range. Example: When the dashboard shows one year of data, then $__interval = 1 day. When the dashboard shows one day of data, then $__interval = 1 minute. A lower limit of this variable is specified by a $__minInterval variable. When used in a query, this variable is replaced by a Grafana time interval. 📝: A Grafana time interval is a special auto option that automatically changes the time interval relative to the current time range on the top right corner of the dashboard. |
| $__minInterval | A lower limit of a $__interval variable. Defined in the Create Data Source screen. |
| Variables: The following syntax is replaced by a value of a custom variable defined by a user. | |
| ${variable name} | Replaced by the current value of a variable. |
| Macro: The following syntax is replaced by a TQL expression. | |
| $__timeFilter | Used to limit data. Replaced by the following condition: {time column} > $__timeFrom AND {time column} < $__timeTo |
| $__rangeFilter | Used to limit data with a region annotation. Only used in a region annotation. Replaced by the following condition: ({start time column} > $__timeFrom AND {start time column} < $__timeTo) OR ({end time column} > $__timeFrom AND {end time column} < $__timeTo) |
| $__timeSampling({column name}, {time interval}) | Use this variable to display sample data for a certain period of time instead of displaying all time periods. Replaced by the following expression: TIME_SAMPLING ({column name}, $__timeFrom, $__timeTo, {time interval value}, {time interval unit}) The input {time interval} is determined by the value of a Grafana time interval. |
6.1.2 Availability of special query expressions for each data field
The following table shows the availability of special query expressions for each data field.
| Expression | ALIASED BY field in the Edit Panel screen | Query field in the Edit Variables screen | Query field in the Edit Annotation screen |
|---|---|---|---|
| $__timeFrom | - | x | x |
| $__timeTo | - | x | x |
| $__col | x | - | - |
| $__container | x | - | - |
| $__interval | - | x | x |
| $__minInterval | - | x | x |
| Variables created by users: /^${variable name}$/ |
- | x | - |
| $__timeFilter | - | - | x (1) |
| $__rangeFilter | - | - | x (2) |
| $__timeSampling({column name}, {time interval}) | - | x | x |
(1): Used for a query with a single annotation. You must always use $__timeFilter to limit data.
(2): Used for a query with a region annotation. You must always use $__rangeFilter to limit data.

