Management GUI Reference for GridDB Cloud
Revision: 1.6.0-10082-768e556f
1 Introduction
This manual explains how to operate Management GUI for GridDB Cloud. Please refer to this manual when you use Management GUI for GridDB Cloud.
2 Operating environment
| Supported OS | Windows 10 |
| Supported browsers | Google Chrome (version 91), Microsoft Edge (version 91). [Note]: Do not turn off JavaScript. |
| Network | The environment that can connect to the Internet (broadband line recommended) |
| Recommended screen size | 1920x1080 |
3 Screen list
3.1 Available roles
Management GUI for GridDB Cloud has the role of administrator user and general user.
The screen that can be used is determined by the role assigned, as shown in the table below (+: Available, -: Not available).
| No. | Screen Name | Screen Description | General user | Administrator user |
|---|---|---|---|---|
| 1 | Login/Logout | - Prompts the user to enter the login ID/password to log in to the system. - If the user clicks the logout button after login, the system returns to this screen. |
+ | + |
| 2 | Cluster overview | Displays the details of the cluster. | + | + |
| 3 | Cluster monitoring | Displays monitoring data in the form of graphs. | - | + |
| 4 | Database management | Displays a list of databases in the cluster. | + | + |
| 5 | Container management | Displays a list of containers in the database. | + | + |
| 6 | View management | Displays a list of views. | + | + |
| 7 | Node management | Displays a list of nodes in the cluster. | + | + |
| 8 | Node settings | Displays settings for nodes. | - | + |
| 9 | Management GUI user management | Displays all GUI admin users. An admin user can update or delete users. | - | + |
| 10 | User information | Displays the details of user profiles. | + | + |
| 11 | Chart management | Displays all charts and common settings. | + | + |
| 12 | Query | Here, a user can choose a database and then execute an SQL query. | + | + |
| 13 | GridDB user management | Displays all GridDB users. | - | + |
| 14 | Regular export schedule | Displays a list of regular export schedules. | + | + |
| 15 | Regular export job | Displays a list of regular export jobs. | + | + |
| 16 | Export/Import | Displays a list of export and import tasks with the latest status. | + | + |
| 17 | Logs | Displays all log activities of nodes. | - | + |
| 18 | Peering connection | Displays a list of all peering connections. | - | + |
| 19 | WebAPI access | Displays a list of all IP addresses that can access the WebAPI. | - | + |
| 20 | GridDB access | Displays a list of all IP addresses that can access GridDB. | - | + |
| 21 | Backup | Displays backup schedules and a backup list. | - | + |
| 22 | Restore history | Displays the restore history list. | - | + |
| 23 | Supports | Displays notifications and information regarding resources. | + | + |
| 24 | Multiple languages | Changes the language. | + | + |
3.2 Overall screen
- The image below is the overall screen of Management GUI for GridDB Cloud:
- (①) - Displays the header bar of the system, including user information and the settings button.
- (②) - Displays the screen title and main screen of each function.
- (③) - Displays the footer bar.
- (④) - Displays a navigation panel, which allows the user to access other screens.
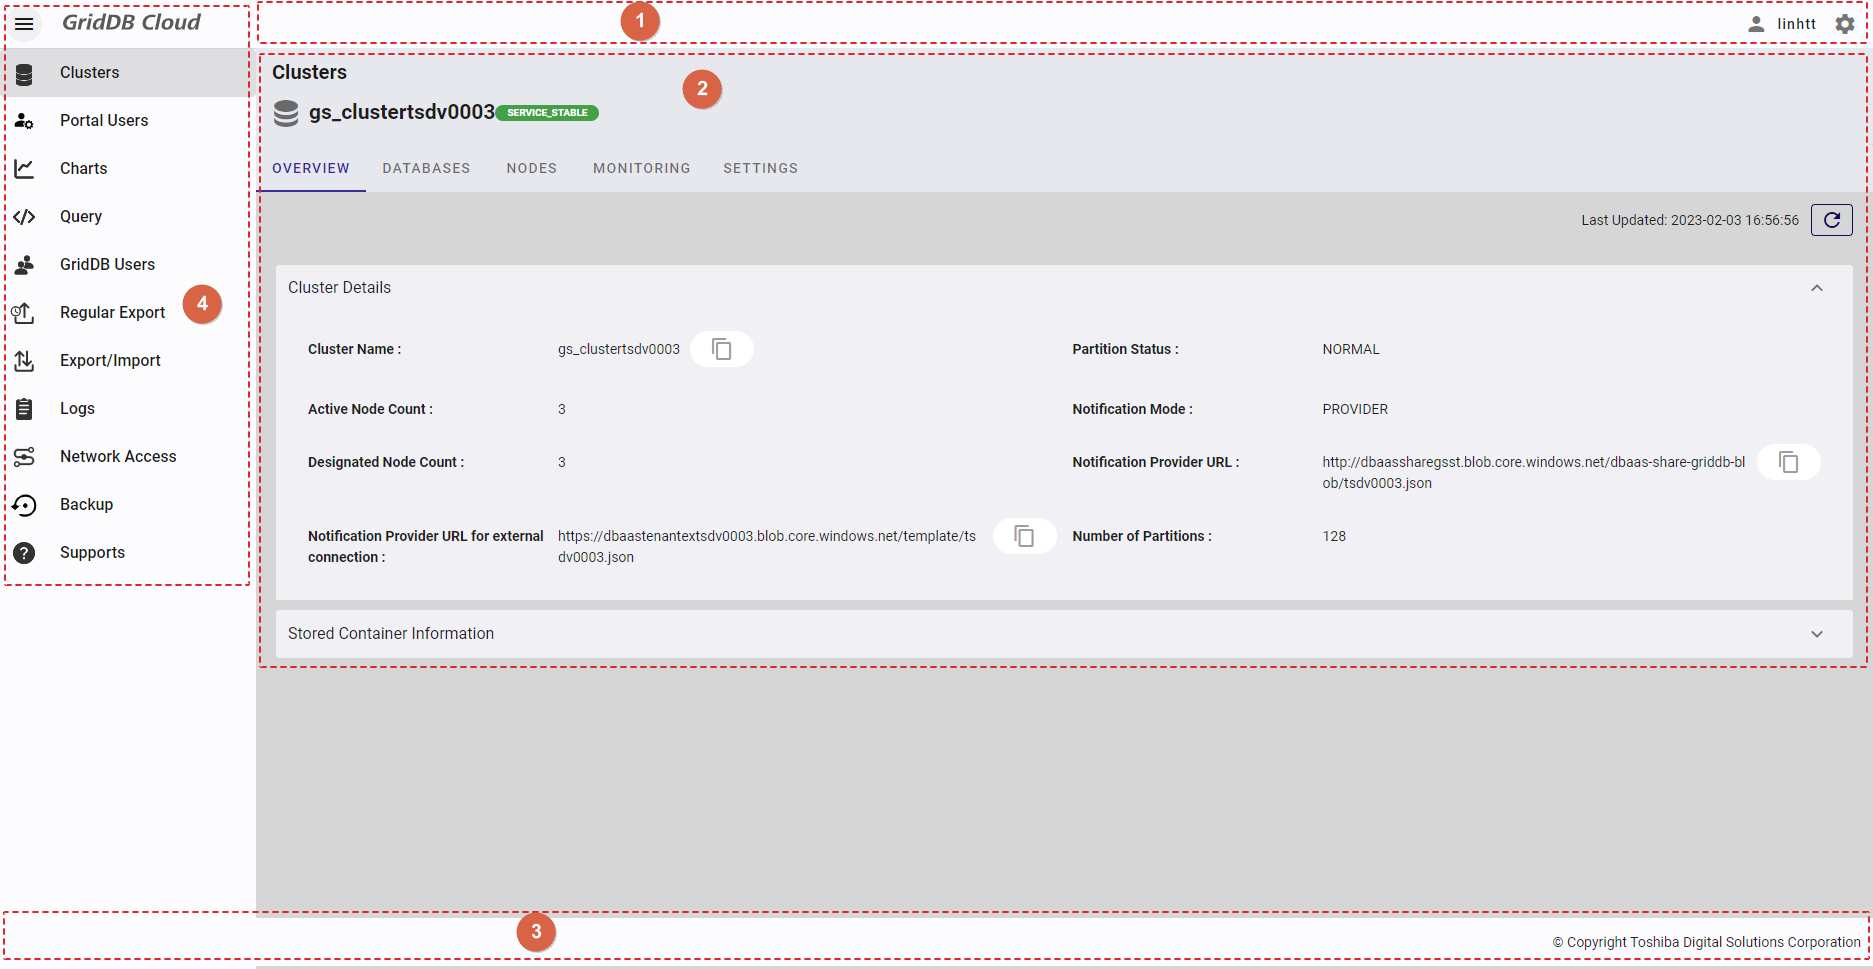
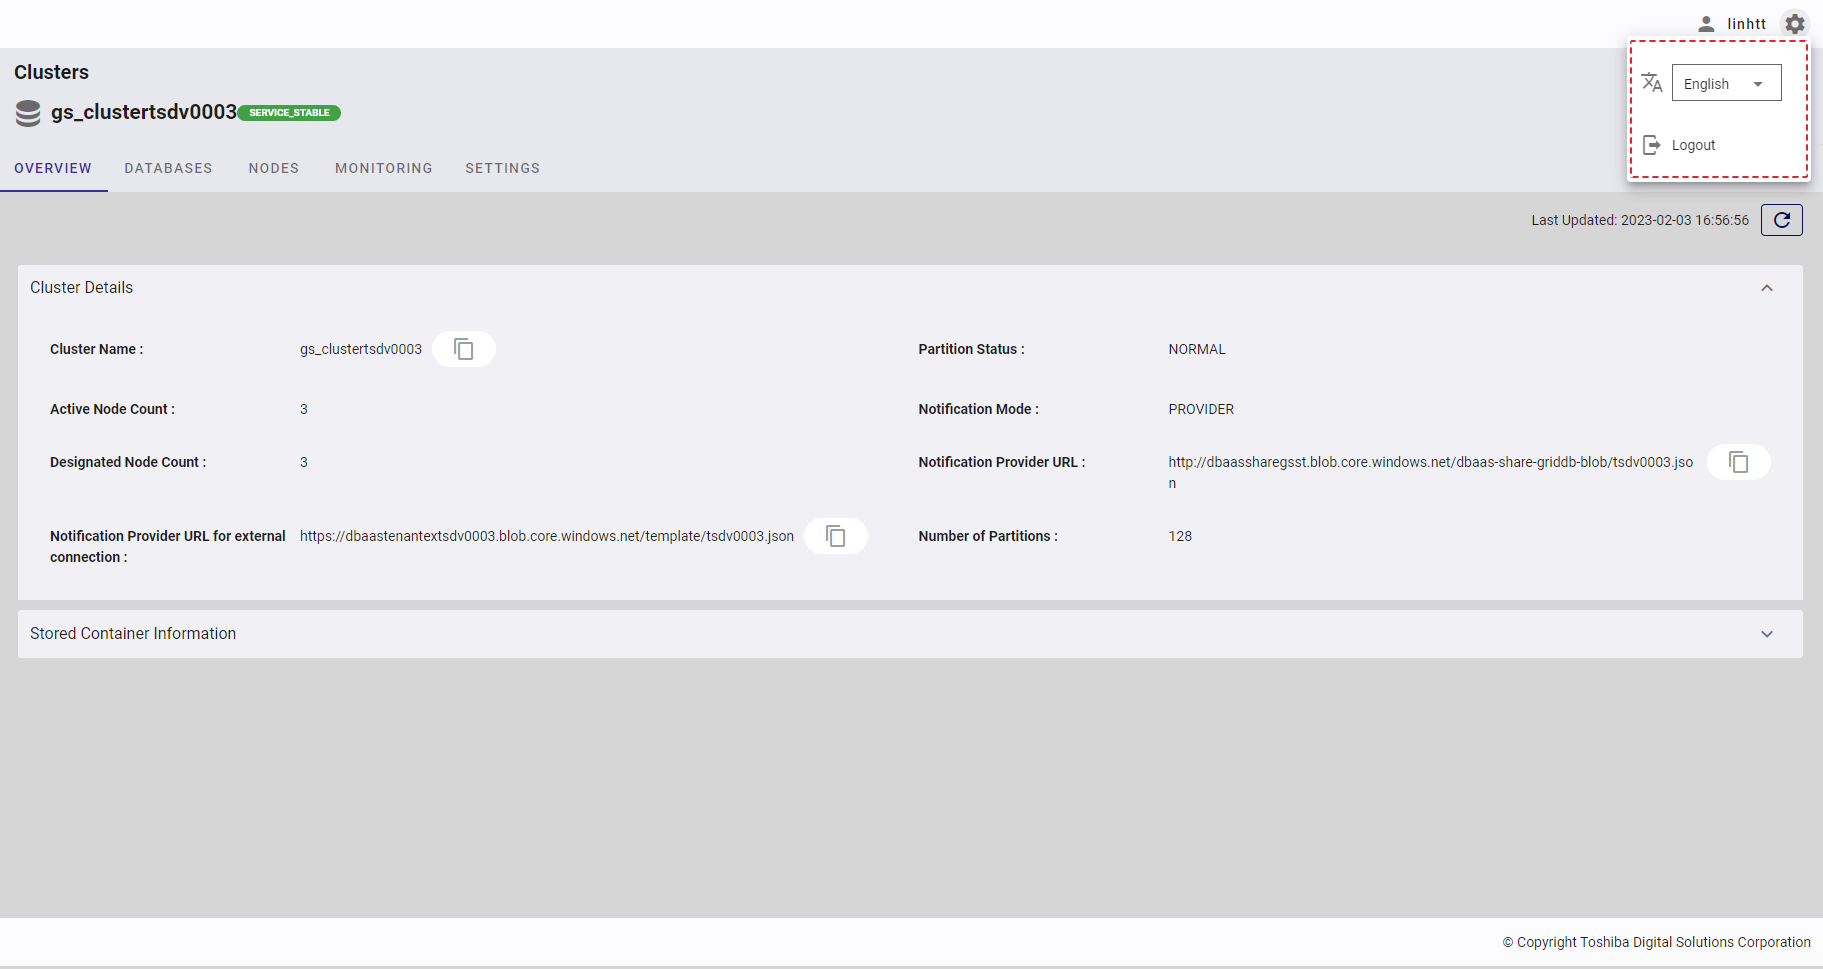
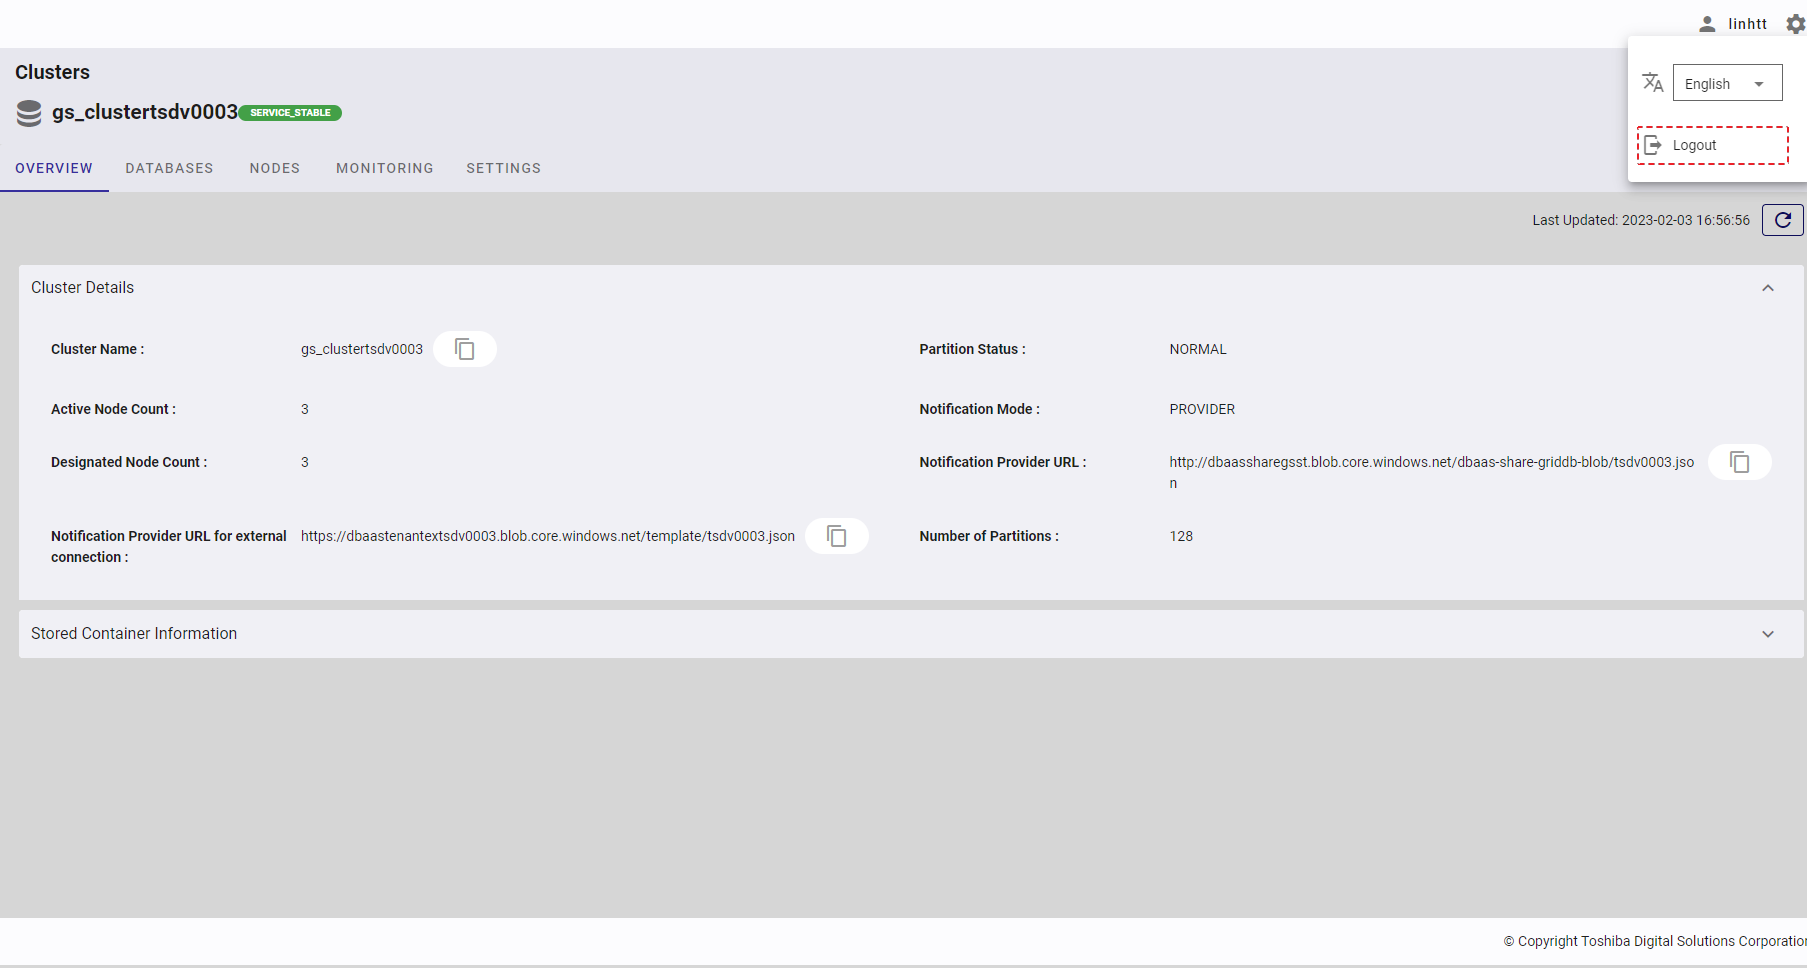
- Click the settings button to display language selection and the logout button.
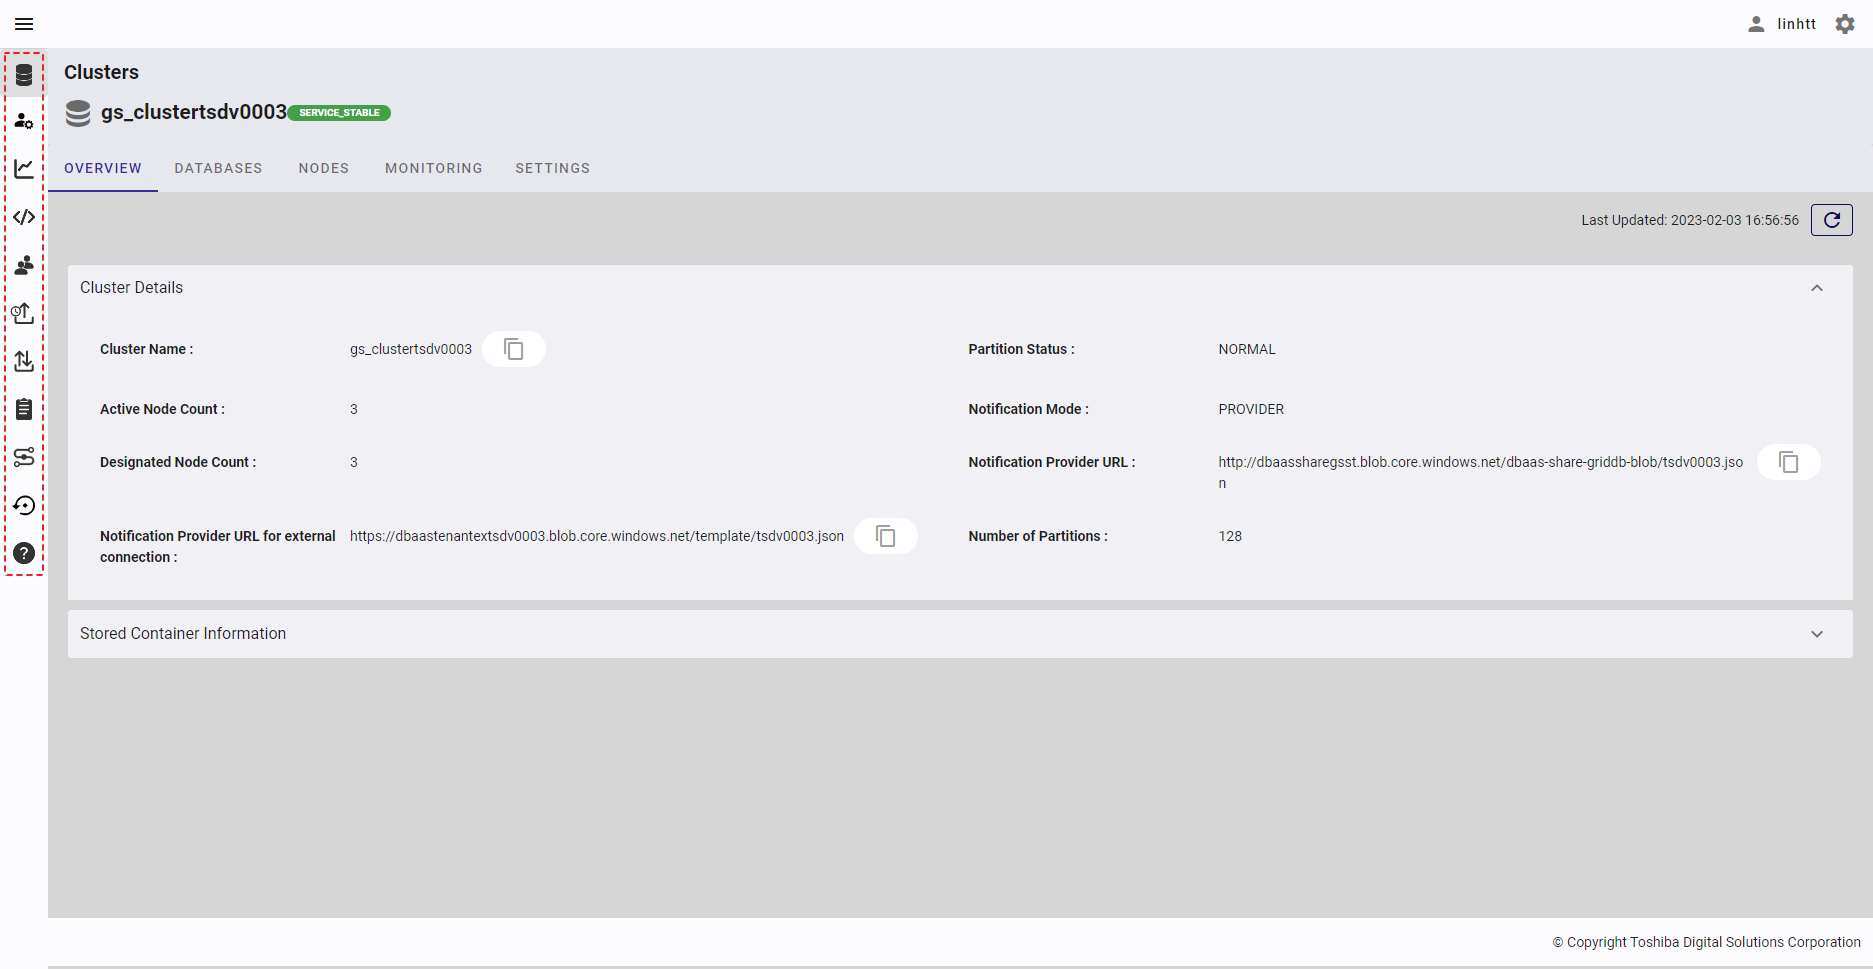
- Click outside the navigation panel to collapse it. Click the [NAVIGATION] button at the top of the left screen to display the navigation panel again.
4 Screen detail
4.1 Login/Logout function
This function is provided for the user to log in or log out Management GUI for GridDB Cloud.
4.1.1 Available roles
In the table below, the role with a plus sign (+) can use the function on the left.
| No. | Function | General user | Administrator user |
|---|---|---|---|
| 1 | Login | + | + |
| 2 | Logout | + | + |
4.1.2 Login
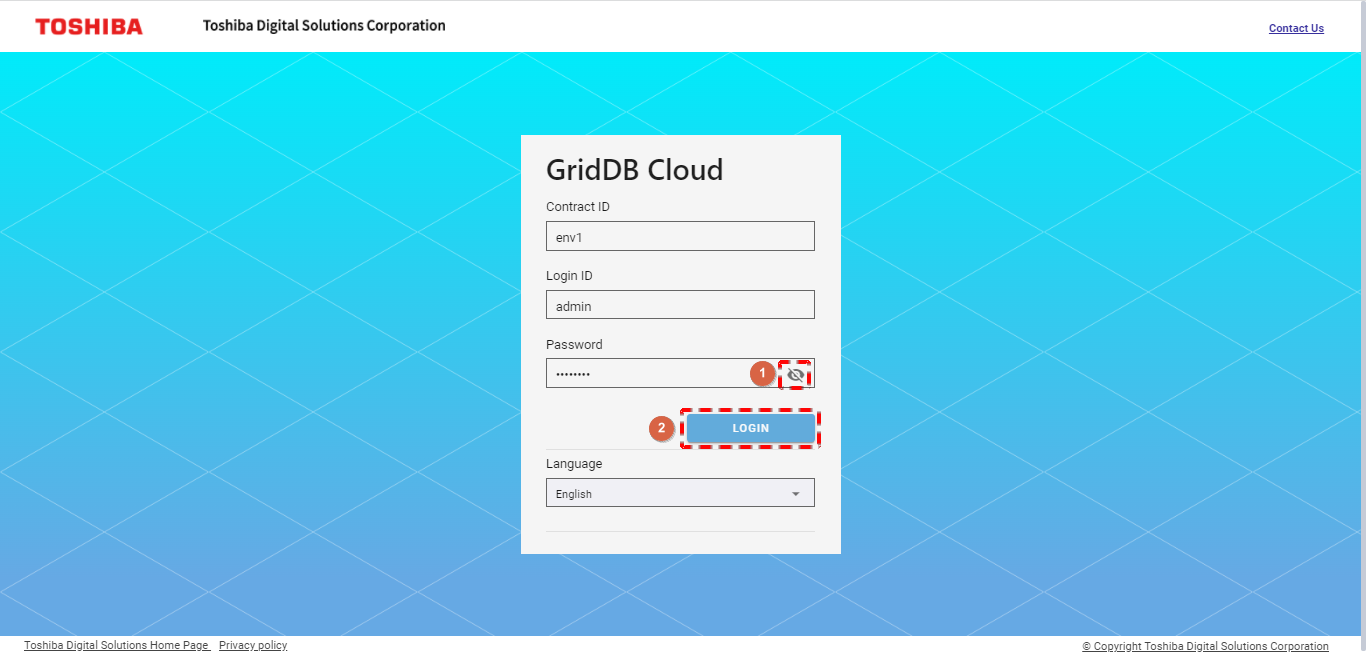
Open the service URL and enter your contract ID, login ID, and password in the input field.
Once a valid contract ID, login ID, and password have been entered, the [LOGIN] button (②) will be enabled. Click the [LOGIN] button to log in. By default, the password information is hidden. You can click the [Show/Hide] button (①) to see your password in plain text.
4.1.3 Logout
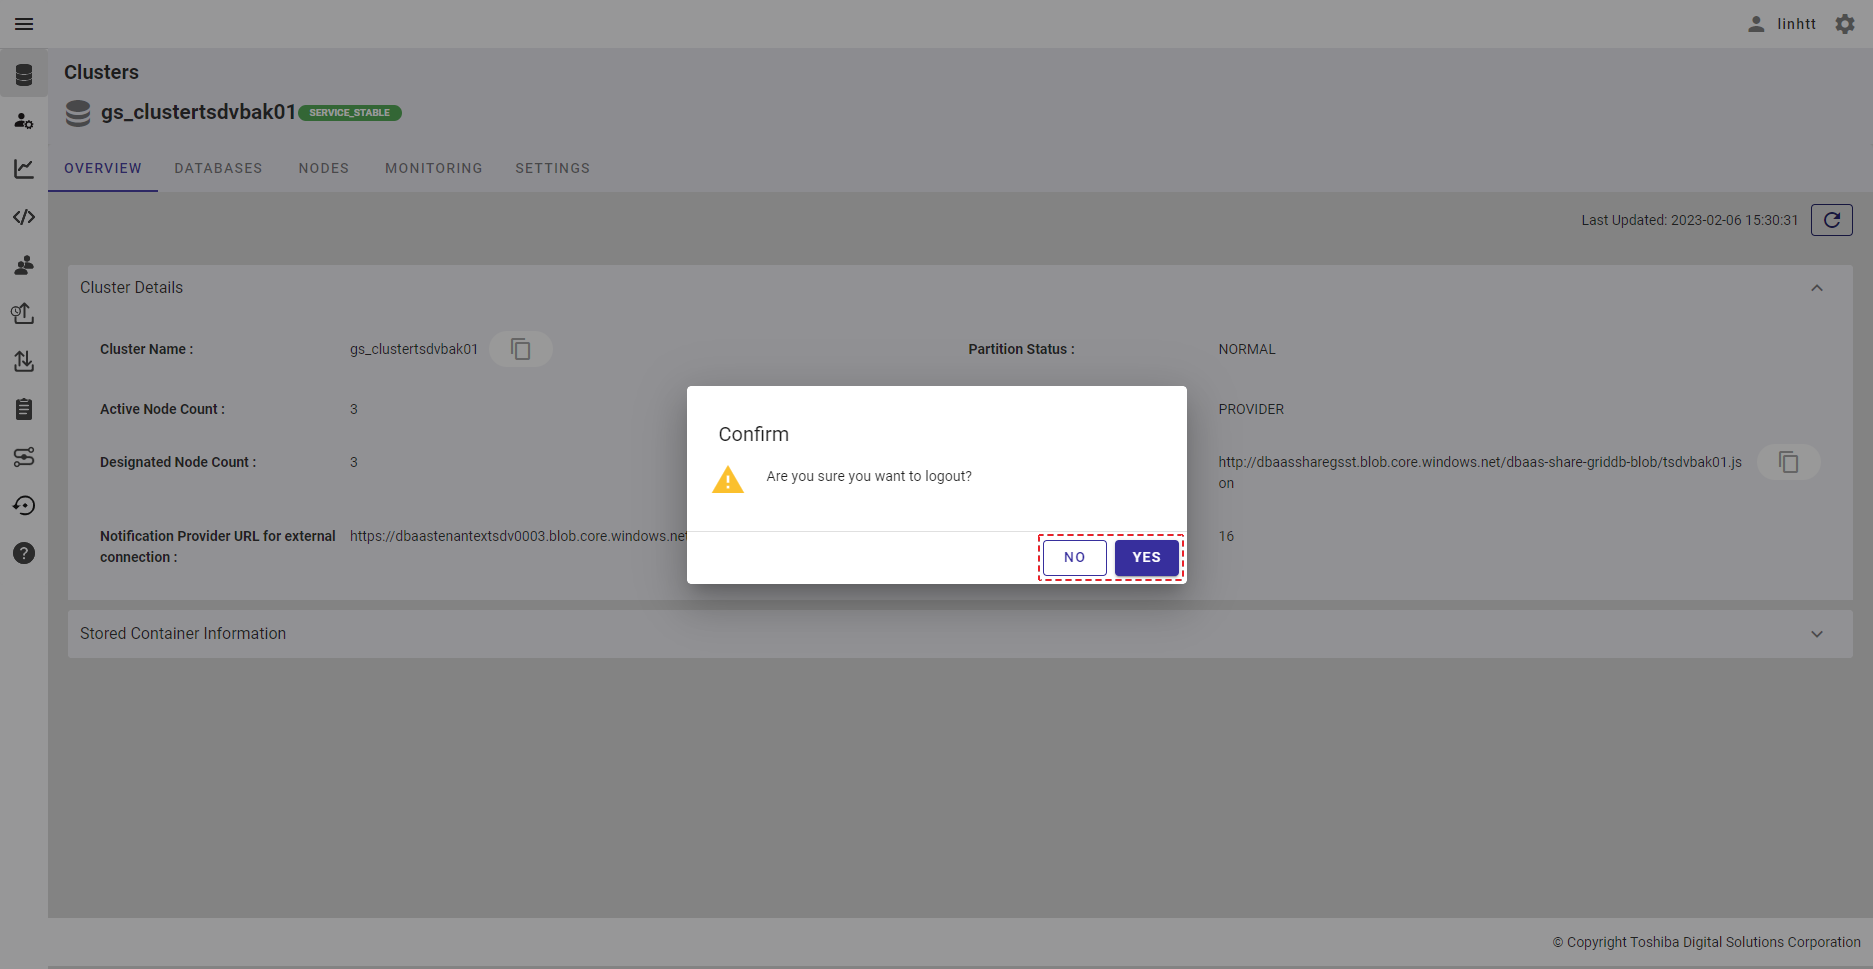
Step 1: Click the [Settings] button first and click the [Logout] button. A confirmation dialog will then be displayed.
Step 2: Click the [YES] button to log out of service. You will then be redirected to the login screen. For details, see login. If you do not want to log out, click the [NO] button to close the dialog and return to the screen.
4.1.4 Password reset
To reset your user password, see Changing your user password.
4.2 Cluster overview function
This function is used for viewing the cluster details and stored container information.
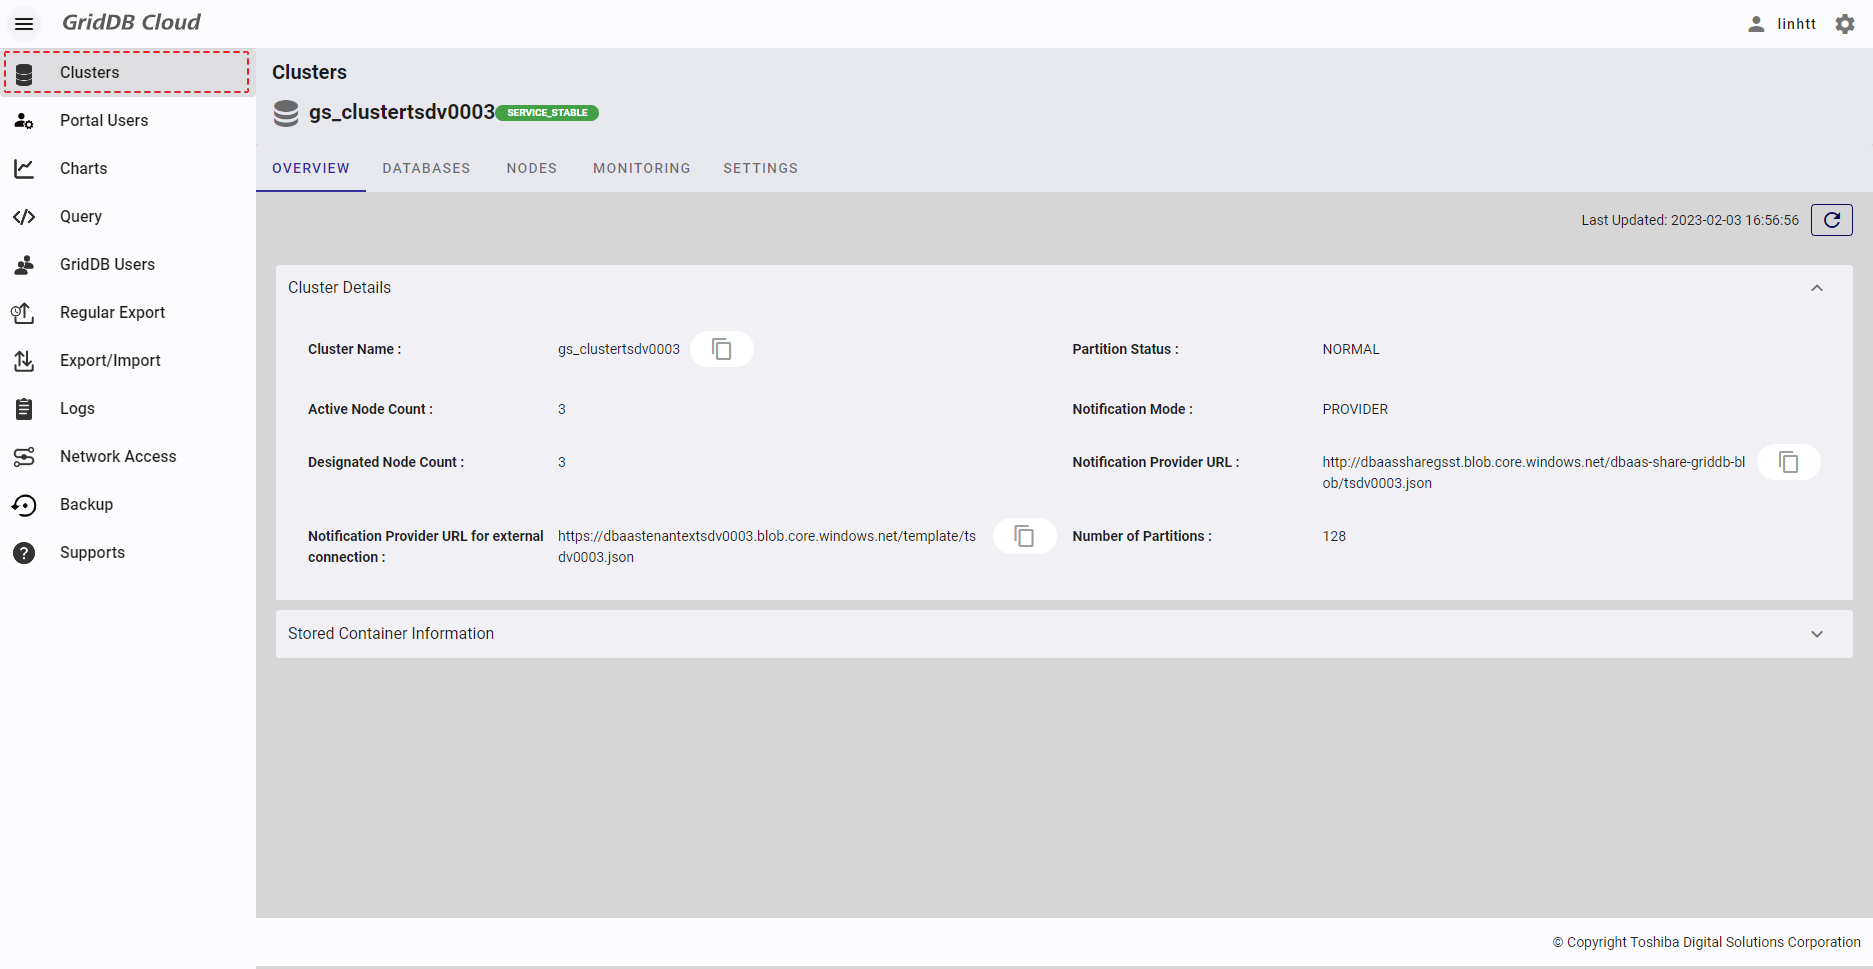
Select the item [Clusters] from the left menu to display the cluster overview screen.
- There are five different cluster statuses, which are described in the table below:
| Cluster status | Condition |
|---|---|
| SERVICE_STABLE | All nodes defined in the cluster configuration have joined the cluster. |
| SERVICE_UNSTABLE | More than half the nodes defined in the cluster configuration have joined the cluster. |
| WAIT | Half or more than half the nodes defined in the cluster configuration have left the cluster. |
| INIT_WAIT | Less than half the nodes defined in the cluster configuration have joined the cluster. |
| STOP | All nodes defined in the cluster configuration have left the cluster. |
The cluster is running if the status is one of these statuses: SERVICE_STABLE, SERVICE_UNSTABLE, WAIT, or INIT_WAIT.
The cluster is stopped if the status is STOP.
4.2.1 Available roles
In the table below, the role with a plus sign (+) can use the function on the left.
| No. | Function | General user | Administrator user |
|---|---|---|---|
| 1 | Display cluster details | + | + |
4.2.2 Displaying cluster details
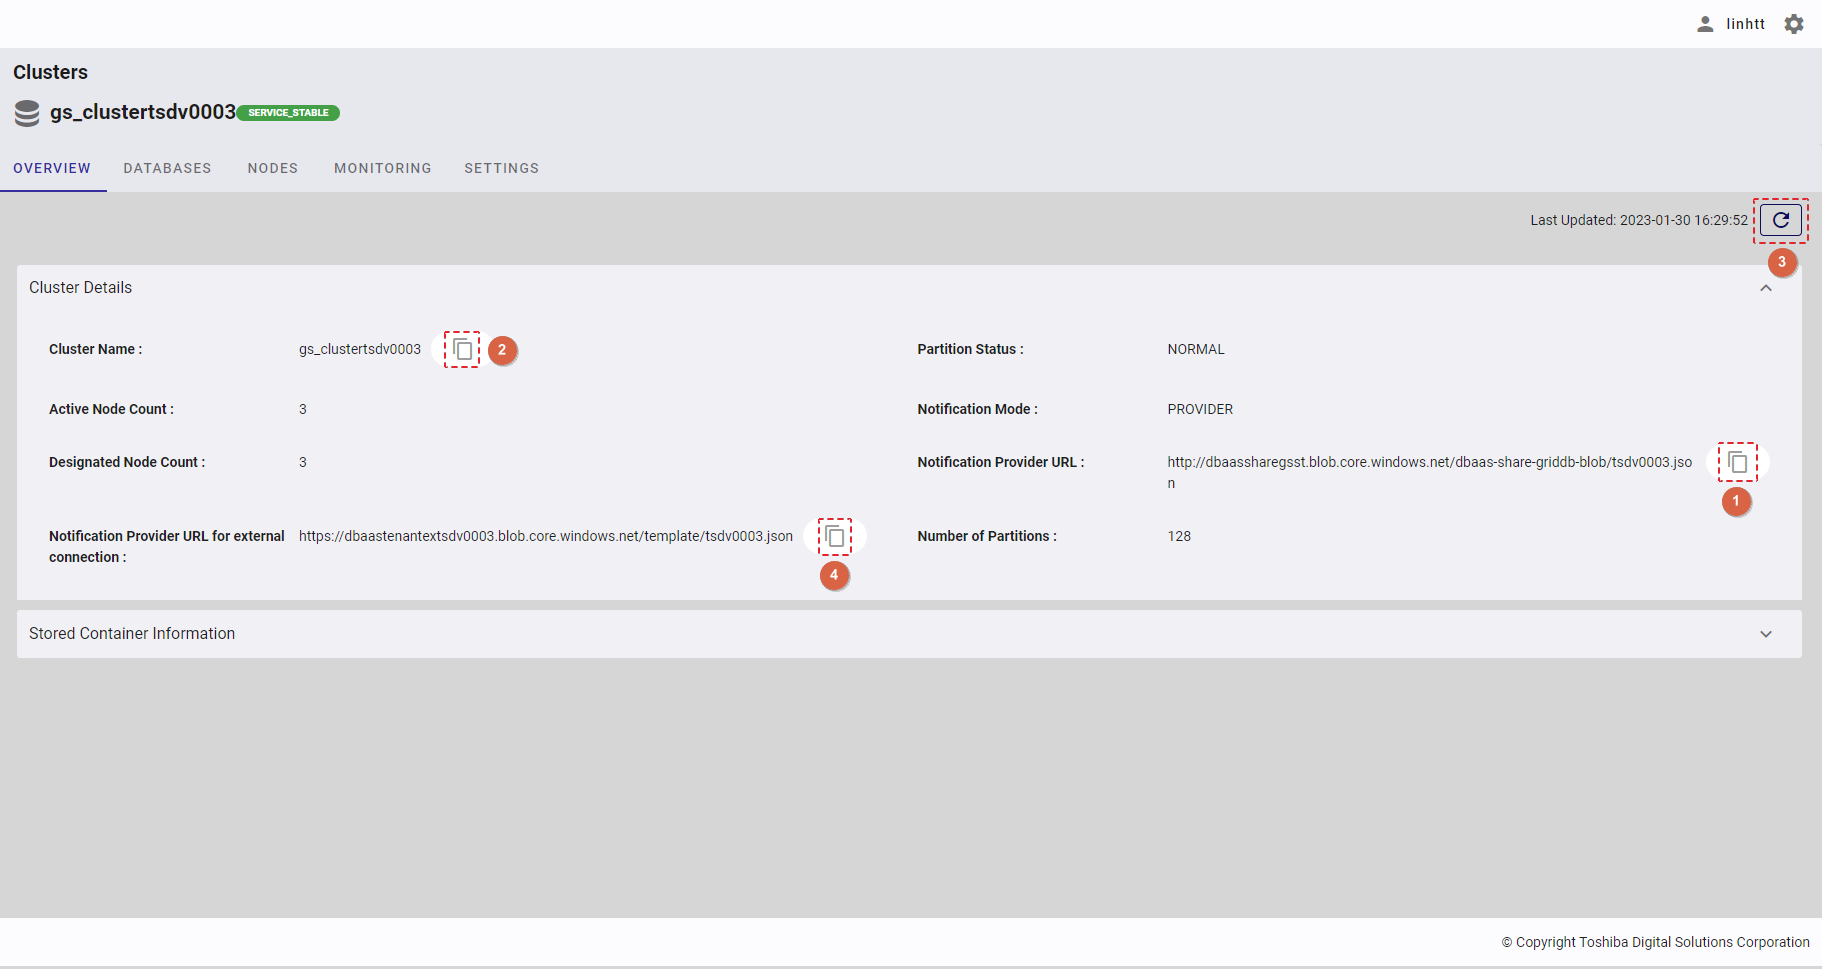
4.2.2.1 Cluster details
Select the item [Clusters] from the left menu to display the cluster overview screen. Click the [Cluster Details] tab to show/hide the cluster details. By default, the [Cluster Details] tab is expanded.
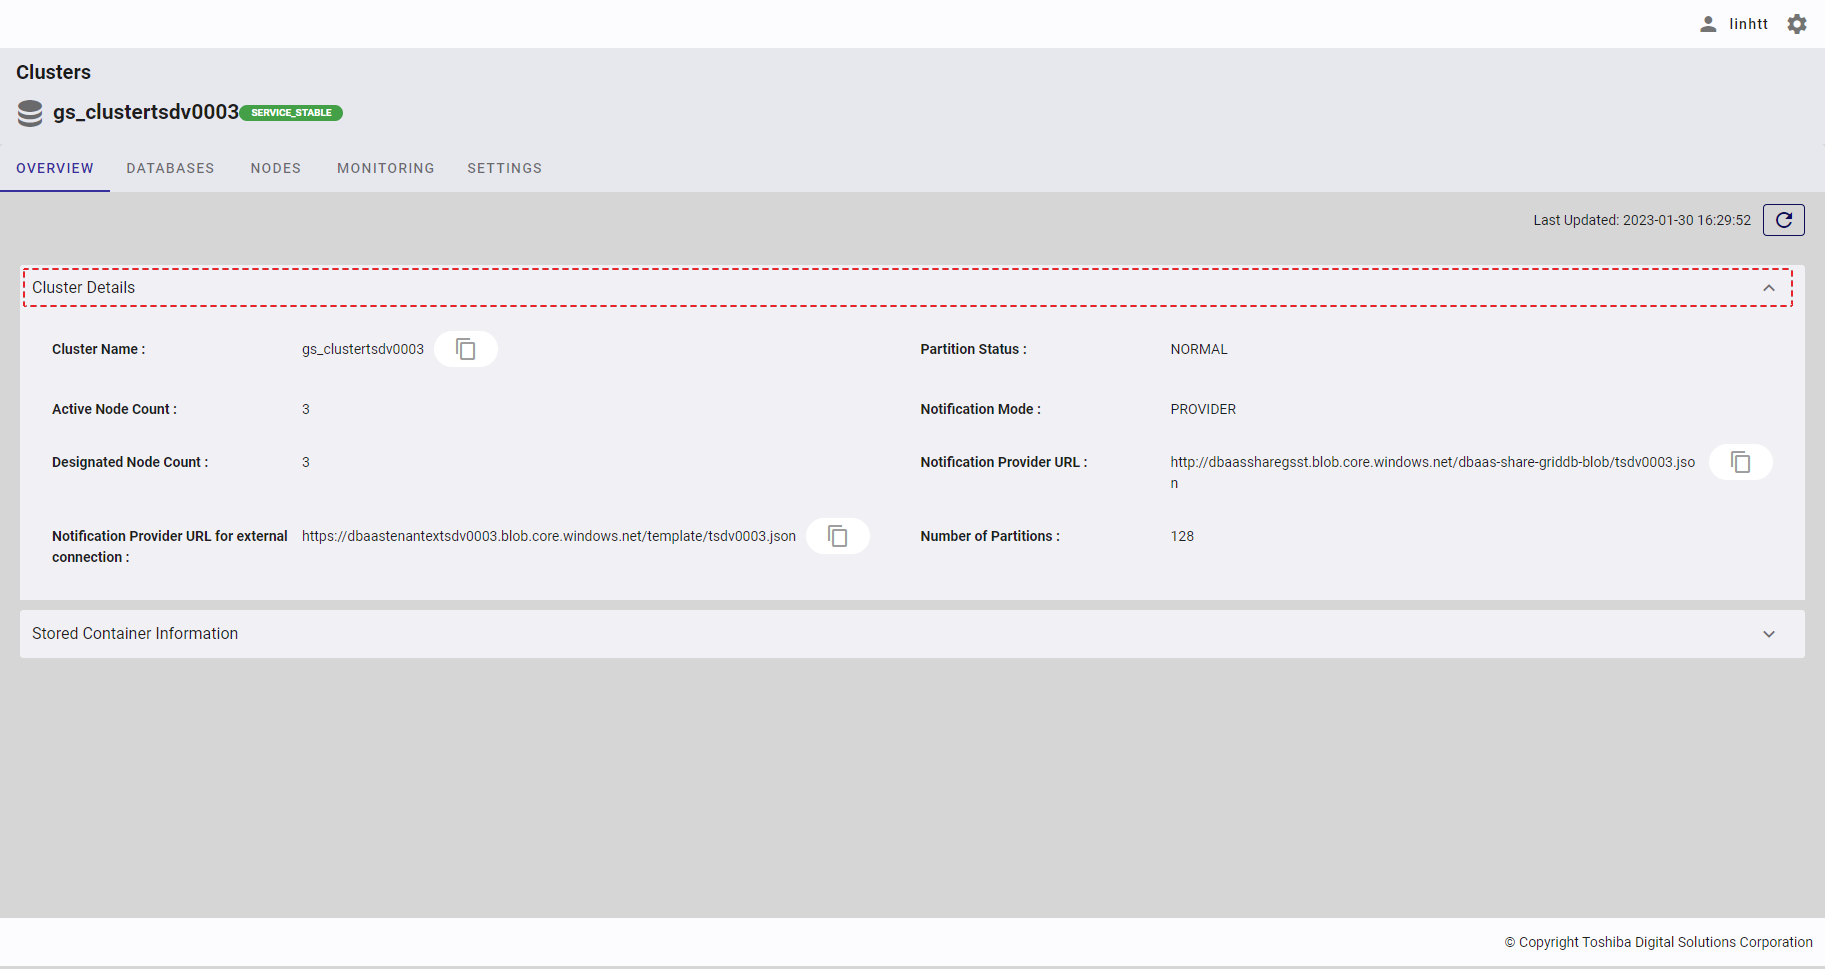
Click the [Refresh] button (③) to refresh the cluster details and get the latest information about the cluster.
Click the [Copy Notification Provider URL] button (①) to copy the Notification Provider URL to the clipboard.
Click the [Copy Cluster Name] button (②) to copy the Cluster Name to the clipboard.
Click the [Copy Notification Provider URL for external connection] button (④) to copy the Notification Provider URL for external connection to the clipboard.
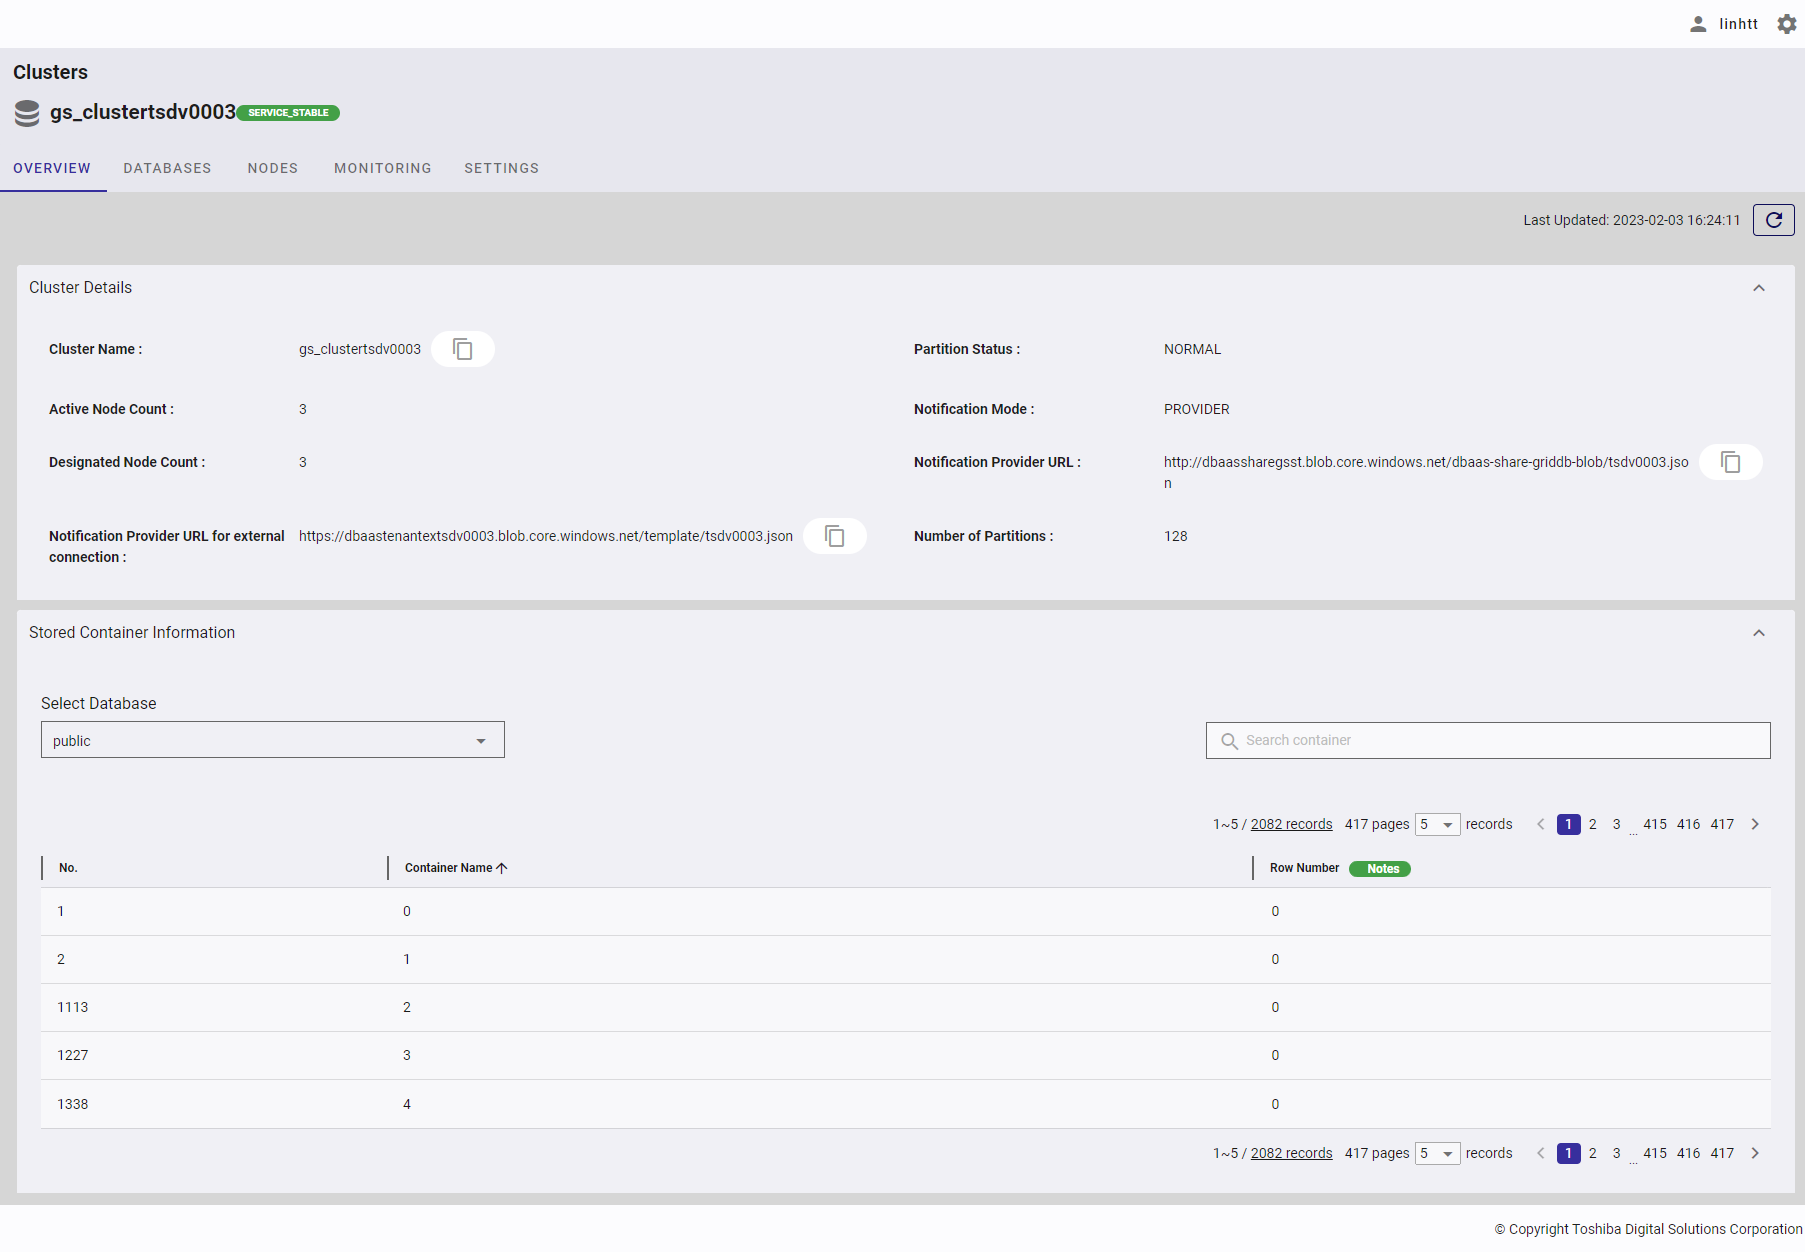
4.2.2.2 Stored container information
Select the item [Clusters] from the left menu to display the cluster overview screen. Click the [Stored Container Information] tab to show/hide the information about the container. You can choose the database that exists in the cluster to see its container information.
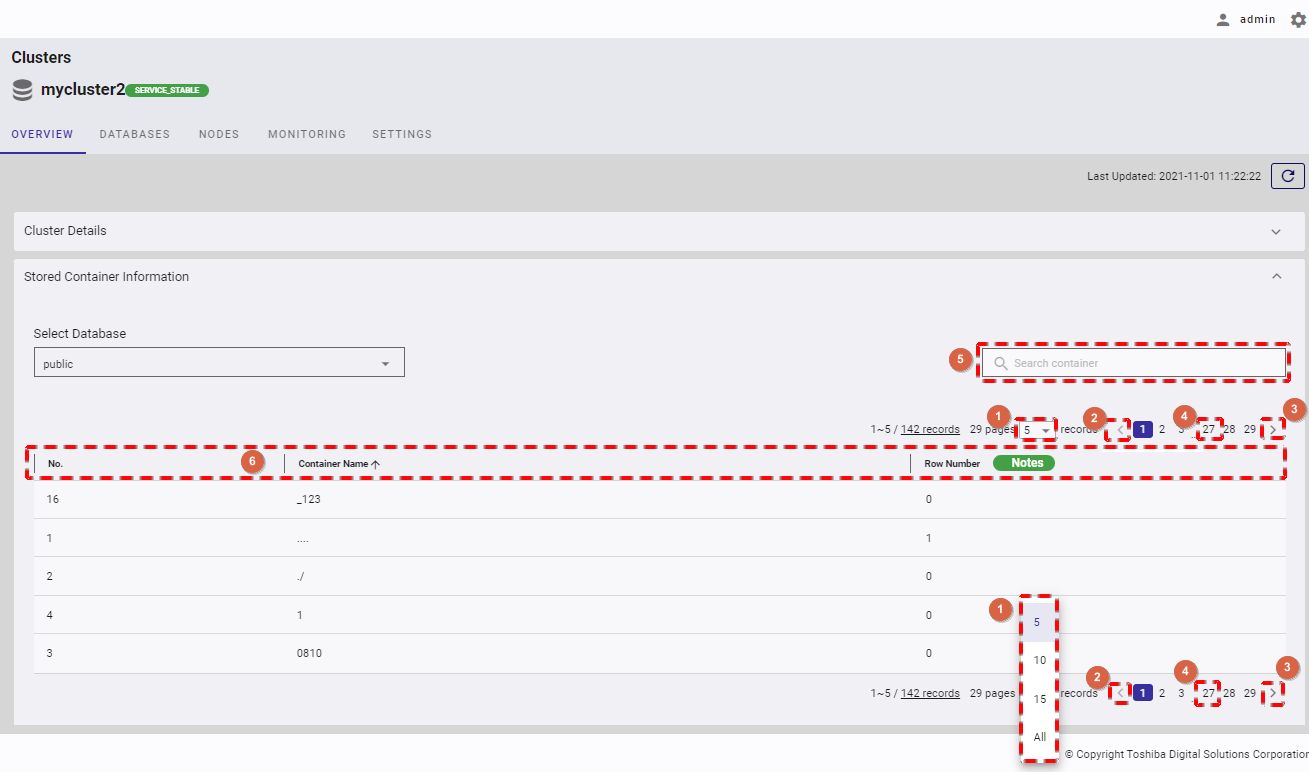
- You can choose the number of containers displayed on one page by selecting the number from [5, 10, 15, All] (①) at the top or bottom of the page. Click the [Next] button (③) or the [Back] button (②), or click the page number (④) to view another page.
- To search a specific container, type the name of the container in the search bar (⑤).
- You can order the list of containers by name or by row number, by clicking the header (⑥) of each column.
- You can adjust the column size by dragging and dropping the vertical bar "|" on the header.
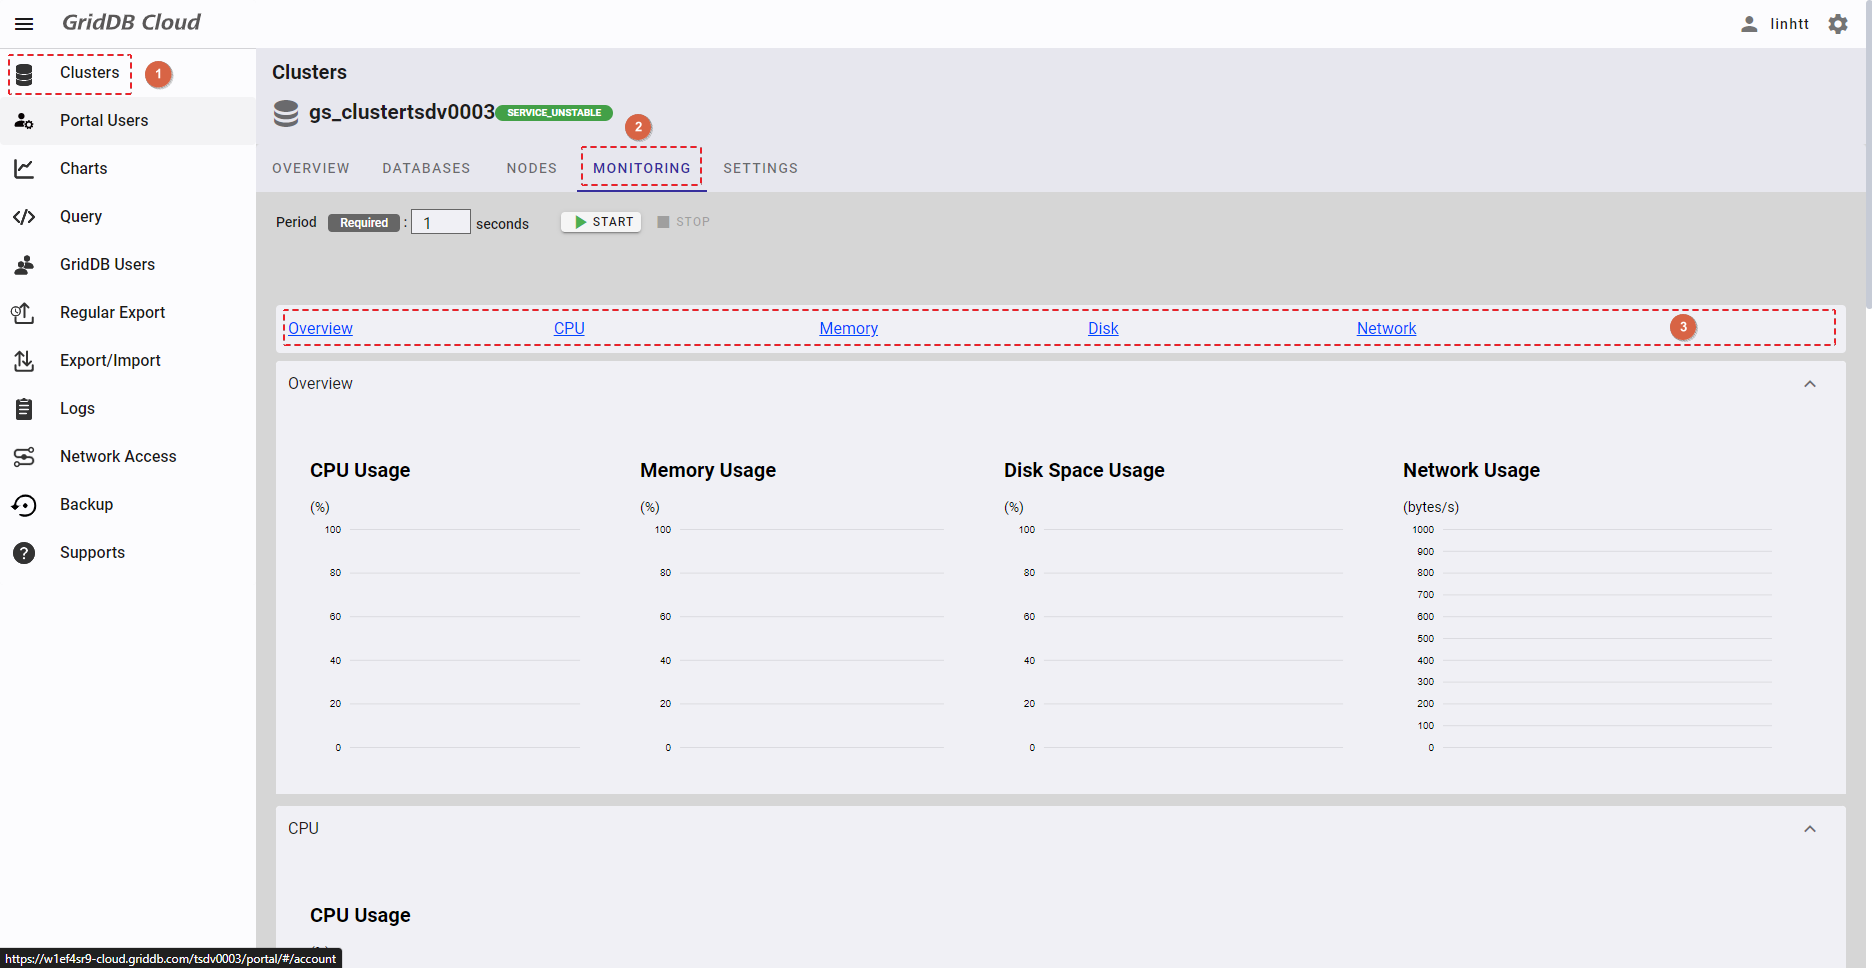
4.3 Monitoring function
This function is for visualizing cluster usage to monitor the cluster.
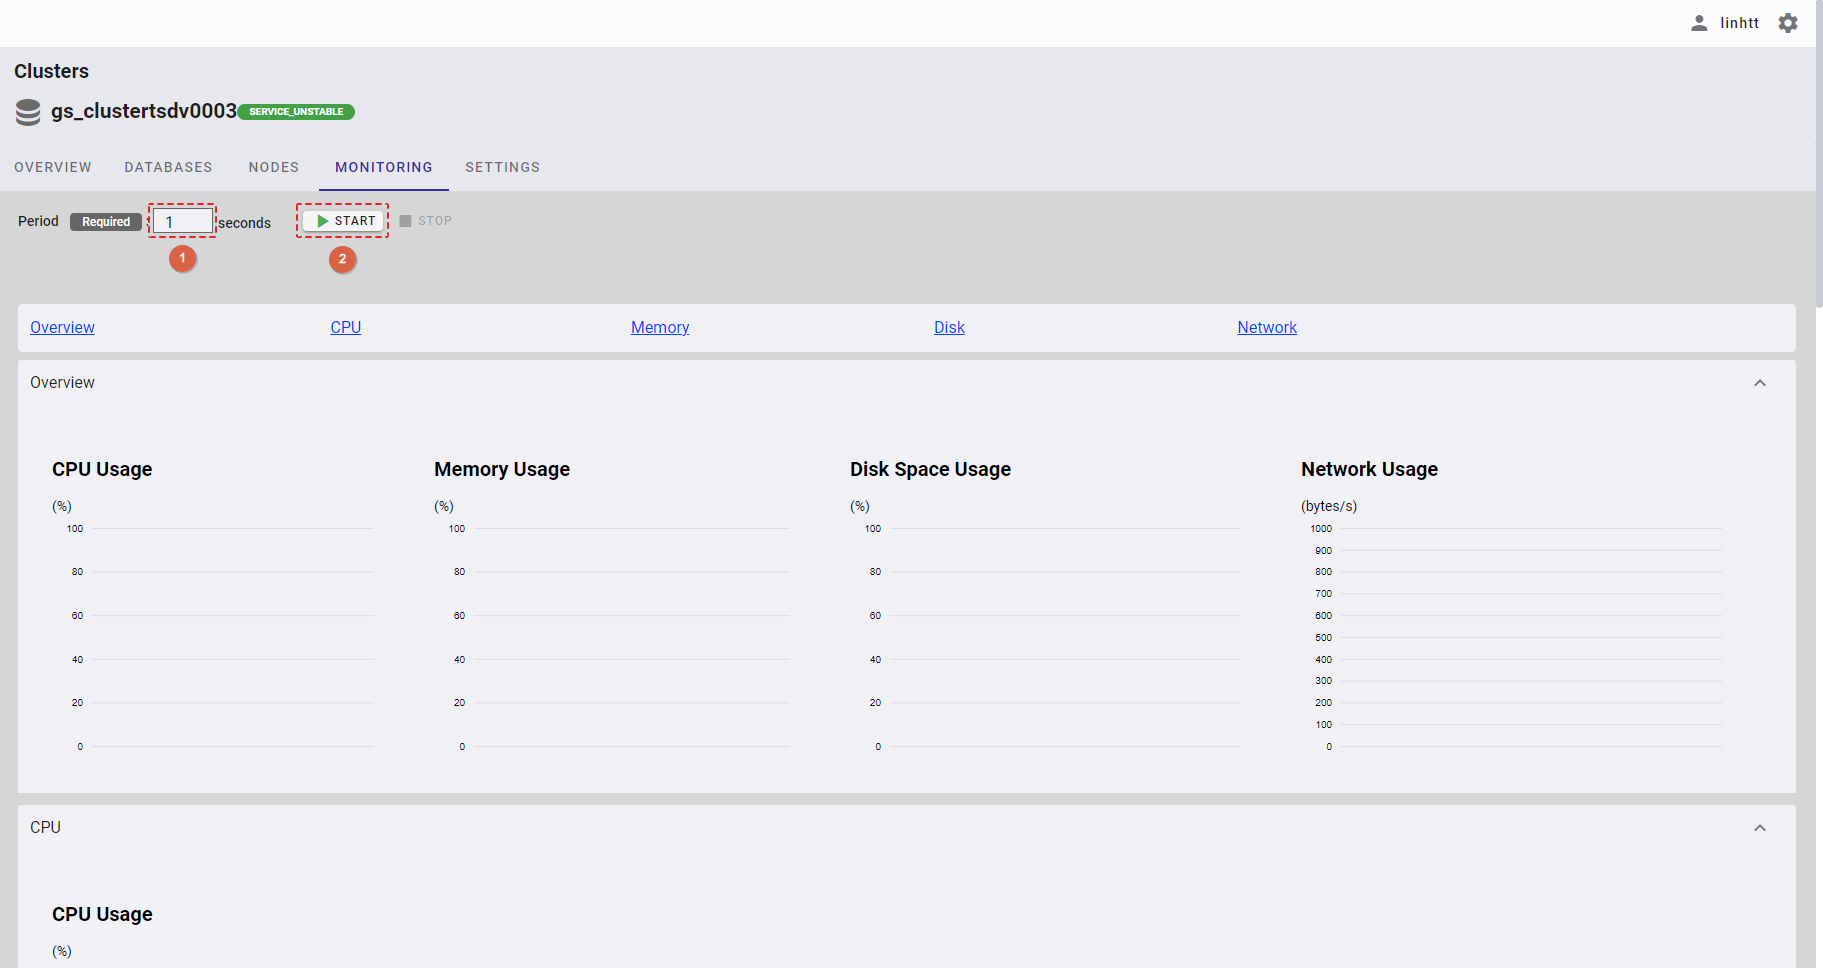
Select the item [Clusters] (①) from the left menu. Then select the [MONITORING] tab (②) to display the monitoring screen.
You can click one of the links (③) to go to the desired tab.
4.3.1 Available roles
In the table below, the role with a plus sign (+) can use the function on the left.
| No. | Function | General user | Administrator user |
|---|---|---|---|
| 1 | Start monitoring | + | + |
| 2 | Stop monitoring | + | + |
| 3 | Display monitoring usage | + | + |
| 4 | Export data to a CSV file | + | + |
4.3.2 Start monitoring
In the monitoring screen, you can choose the period in seconds for which cluster usage is retrieved by entering the number in the period input field (①). Then, click the [▶ START] button (②) to start monitoring cluster usage.
4.3.3 Stop monitoring
In the monitoring screen, click the [■ STOP] button to stop monitoring cluster usage.
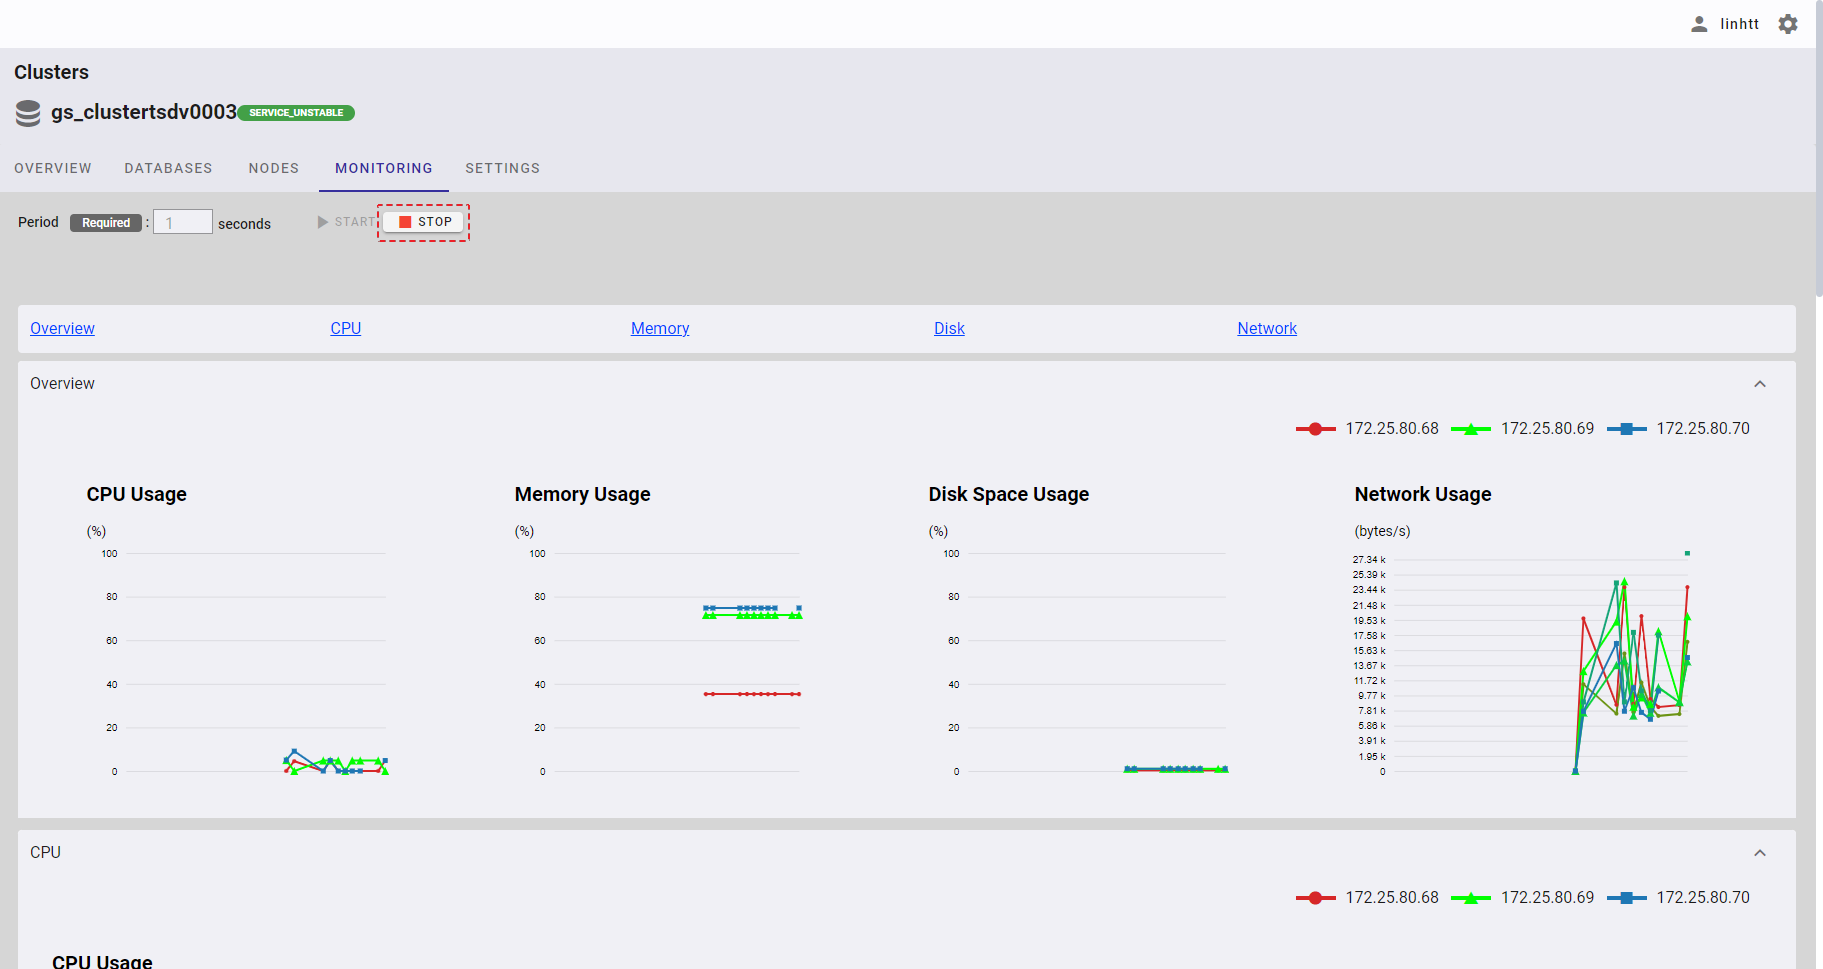
[Note]: If you go to another screen, monitoring will automatically stop.
4.3.4 Display cluster usage
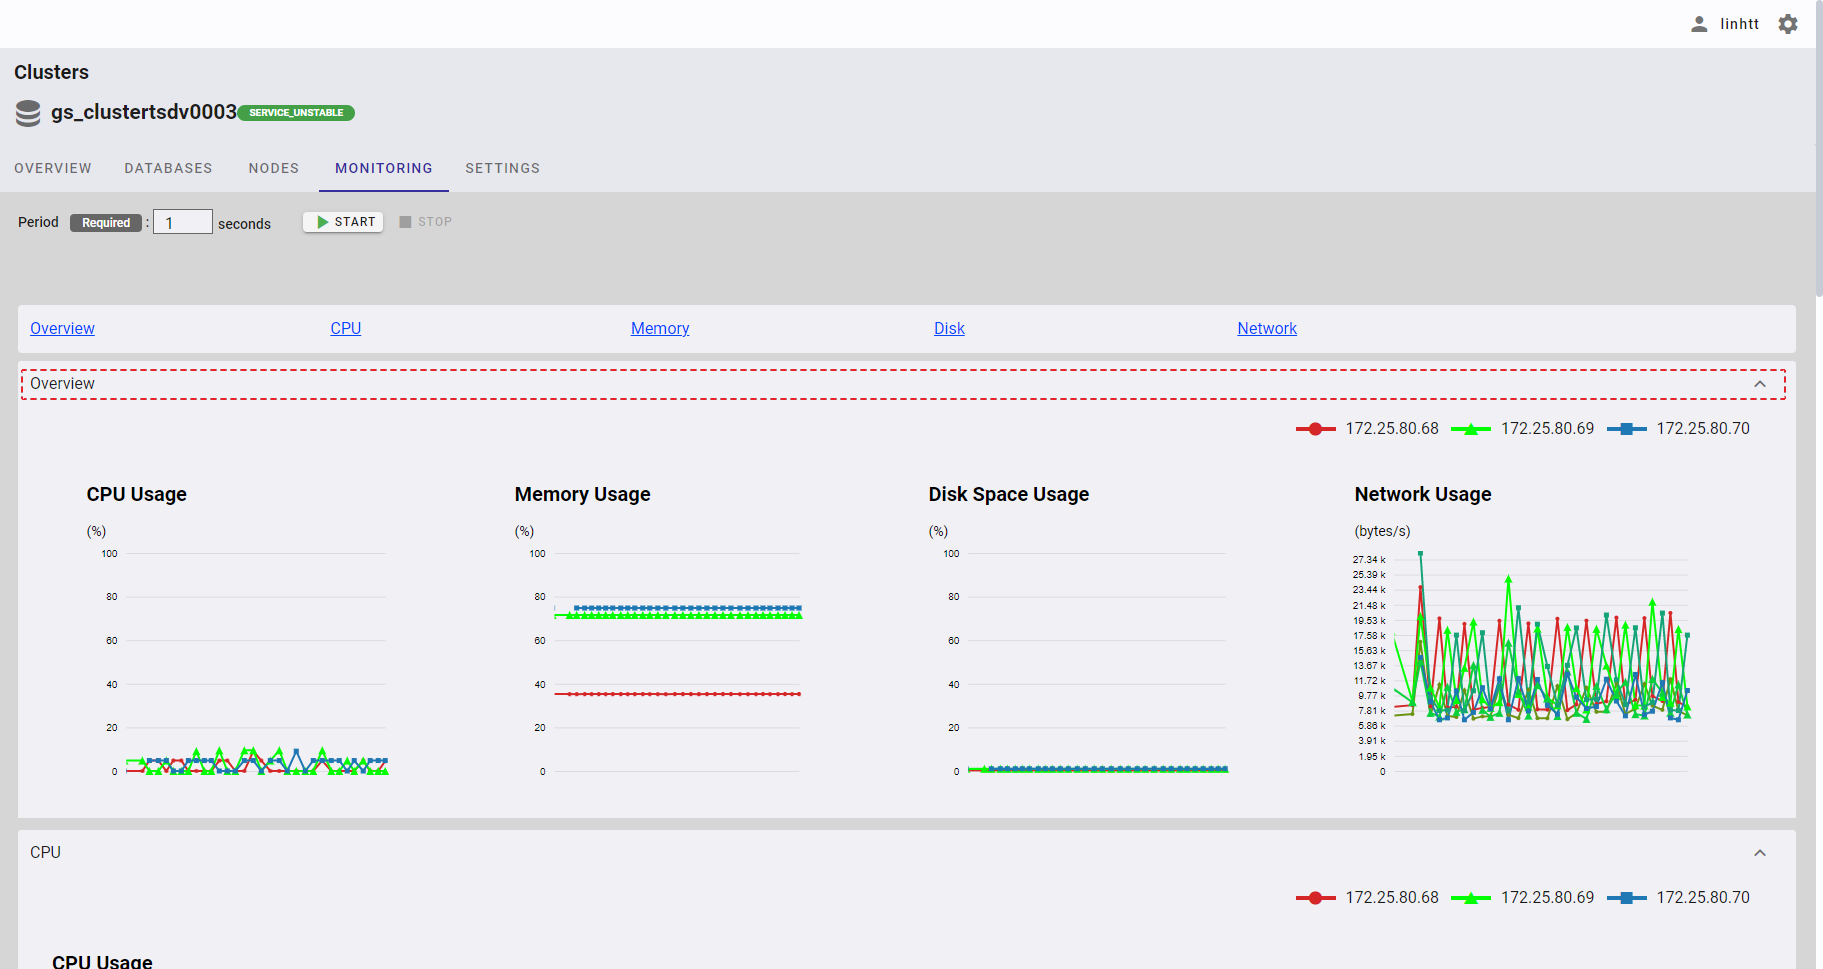
4.3.4.1 Overview usage
You can click the [Overview] tab to show/hide the overview usage of the cluster, including the following four types of real-time data:
- CPU usage
- memory usage
- disk space usage
- network usage
To see the detailed information about the usage of the cluster at a particular point of time, you can hover the mouse pointer over a point in a chart.
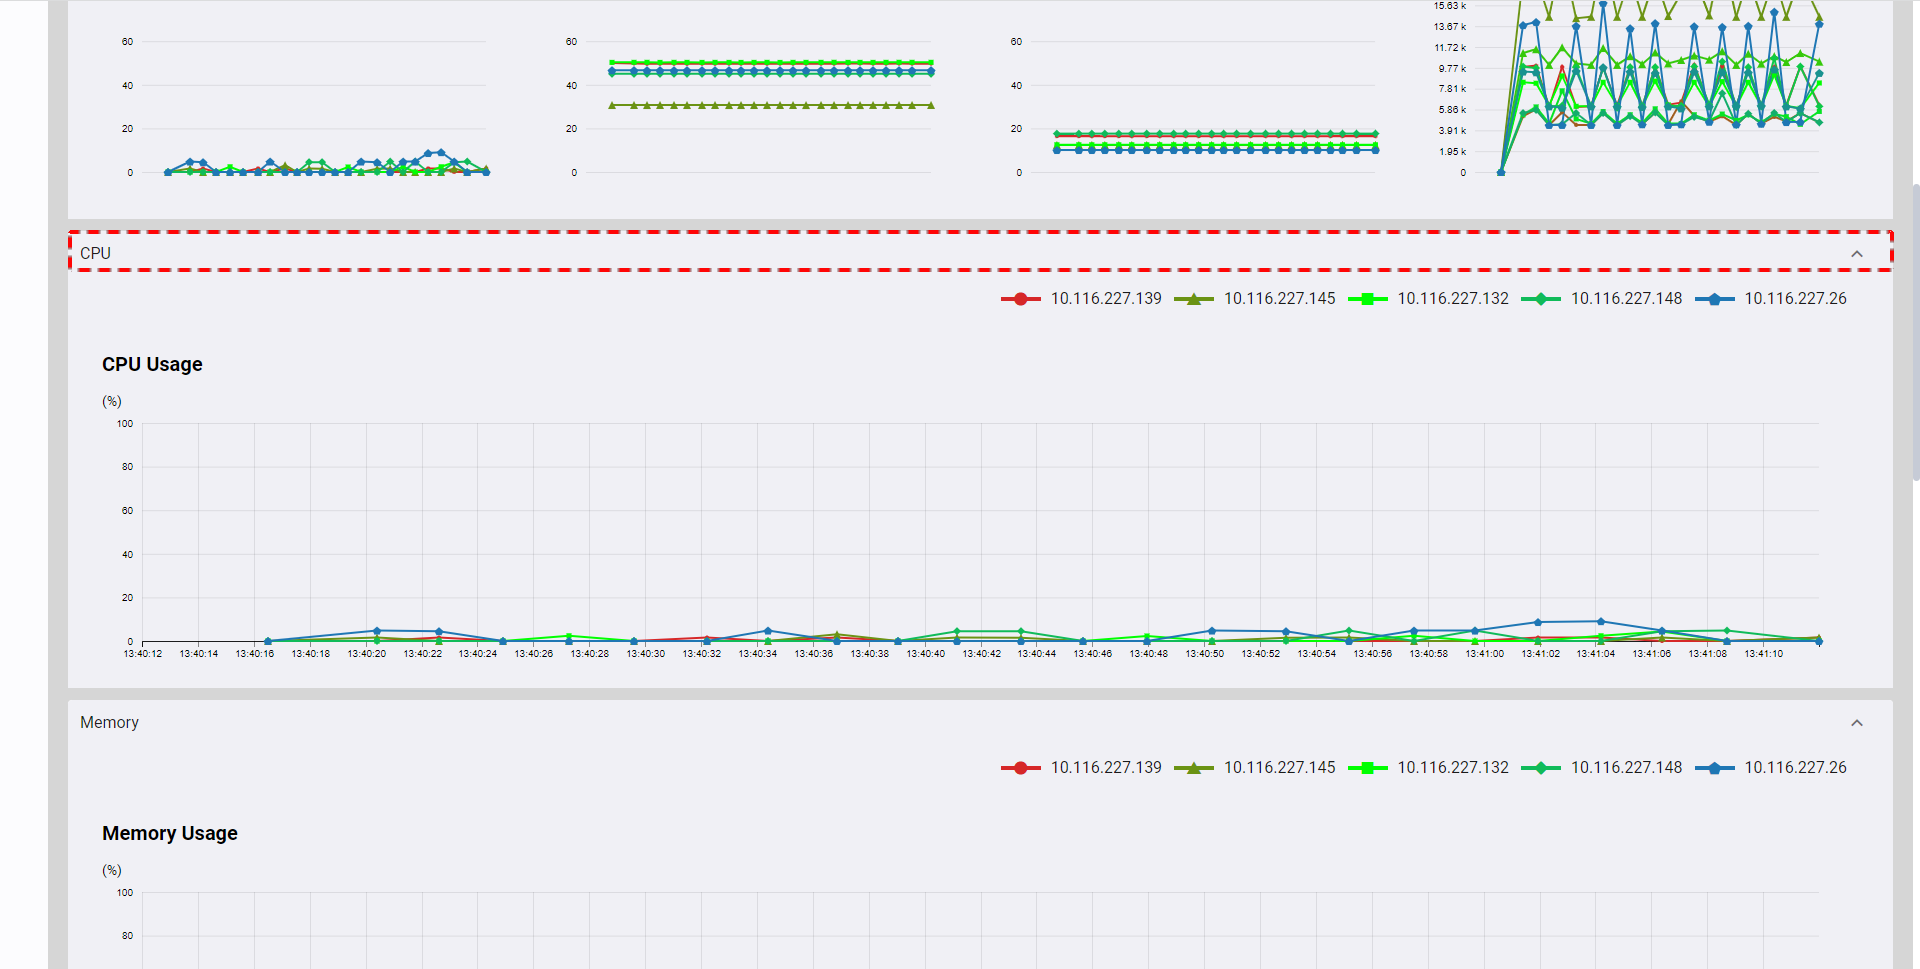
4.3.4.2 CPU usage
You can click the [CPU] tab to show/hide the CPU usage of the cluster. This chart provides a visual representation of the real-time data on CPU usage for each node. Each line in the chart corresponds to the usage for each node in the cluster.
4.3.4.3 Memory usage
You can click the [Memory] tab to show/hide the memory usage of the cluster. This chart provides a visual representation of the real-time data on memory usage for each node. Each line in the chart corresponds to usage for each node in the cluster.
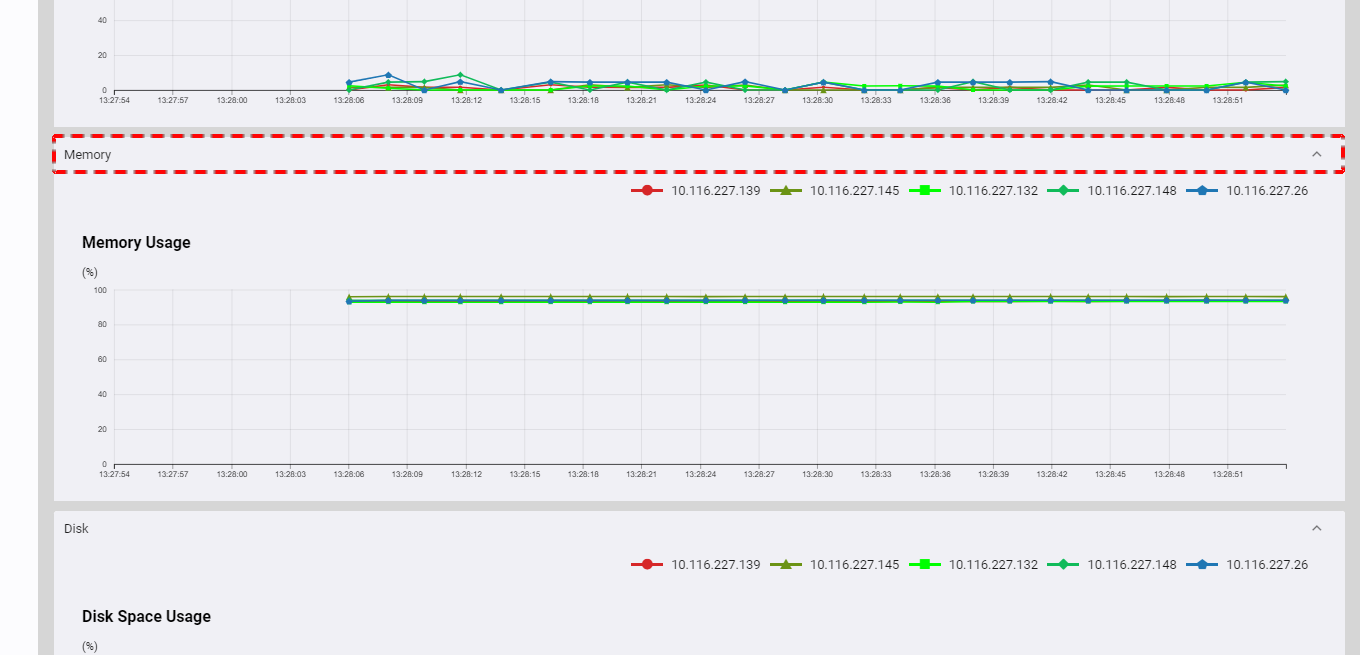
4.3.4.4 Disk space usage
You can click the [Disk] tab to show/hide the disk space usage of the cluster. This chart provides a visual representation of the real-time data on disk space usage for each node. Each line in the chart corresponds to usage for each node in the cluster.
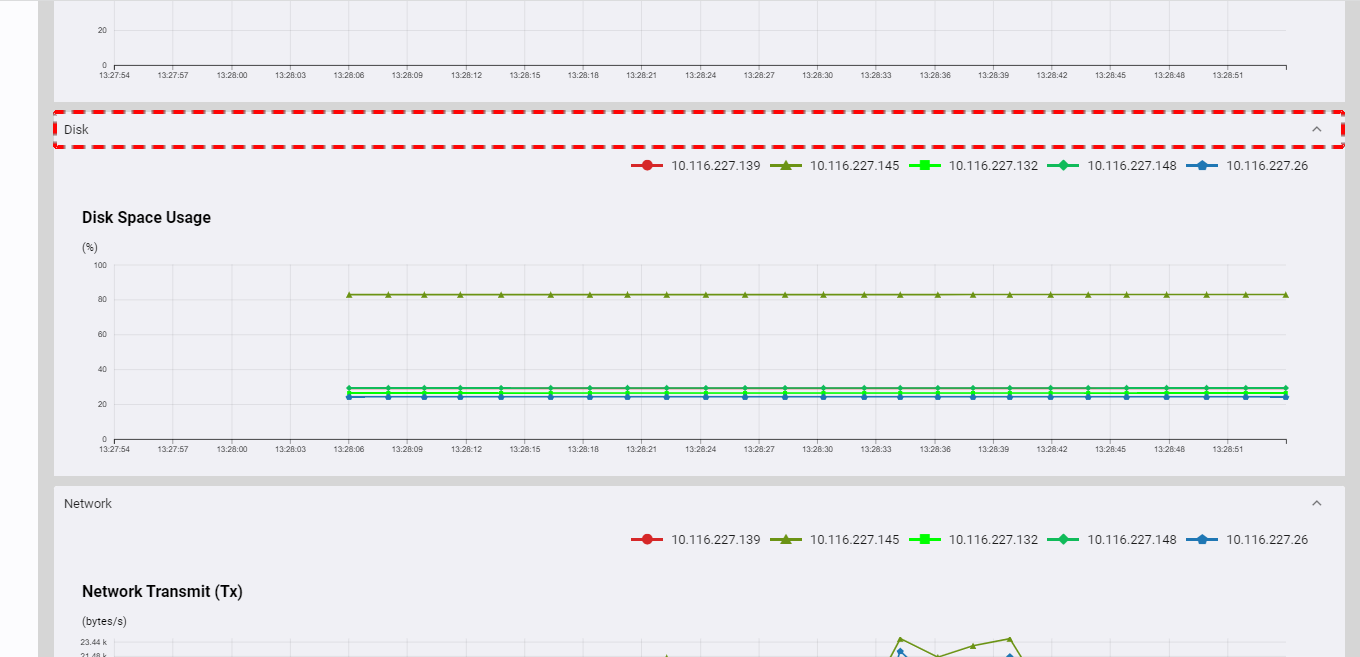
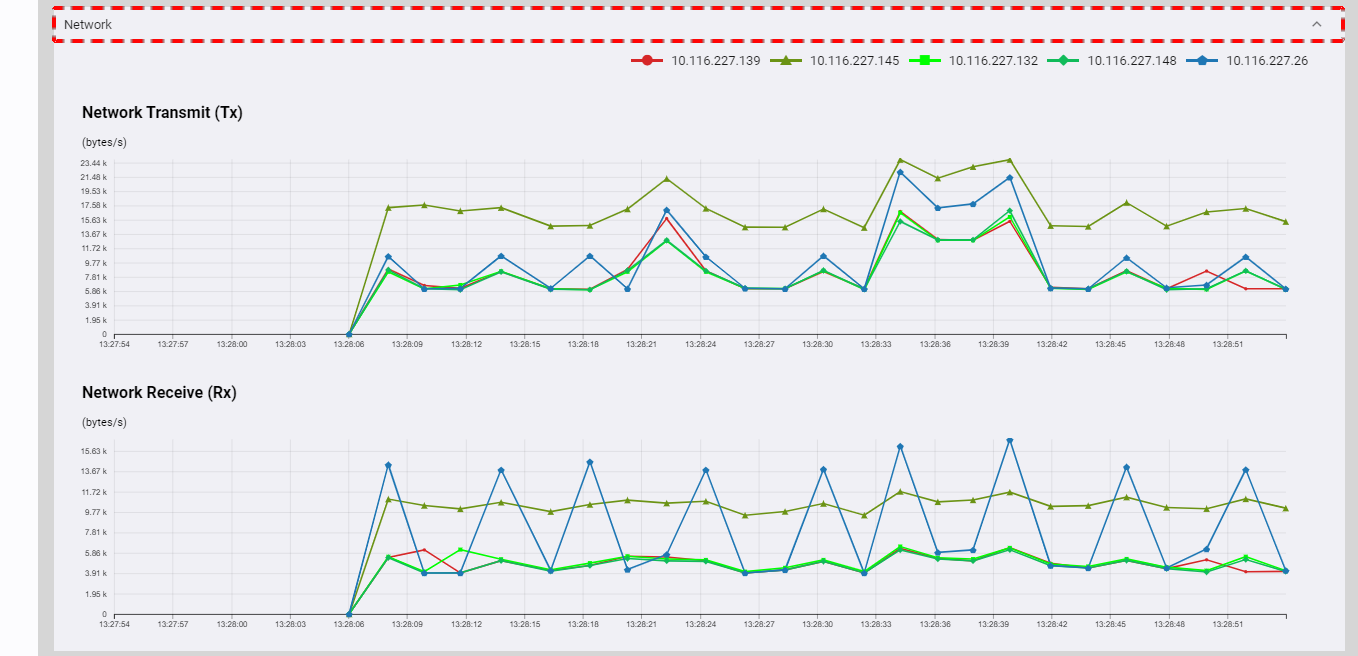
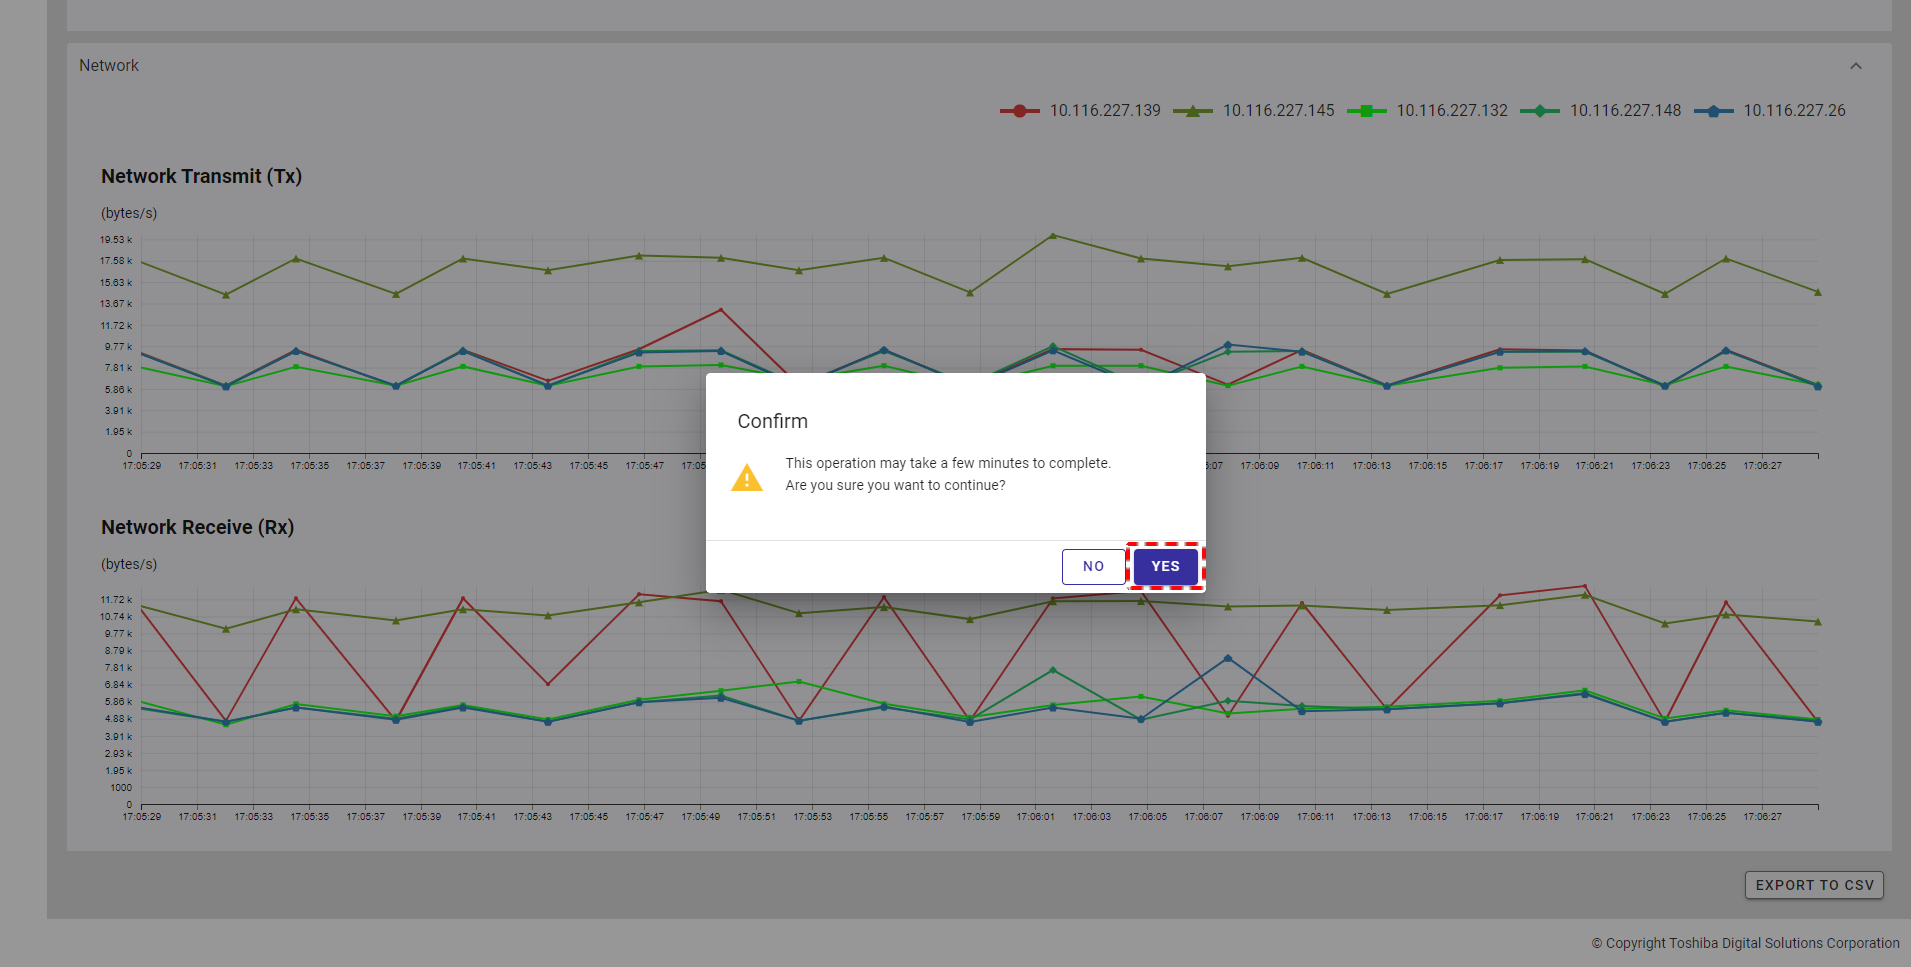
4.3.4.5 Network usage
You can click the [Network] tab to show/hide the network usage of the cluster. The two charts as shown below provide a visual representation of the real-time data on network usage for each node. One is for transmitting usage and another is for receiving usage. Each line in the chart corresponds to usage for each node in the cluster.
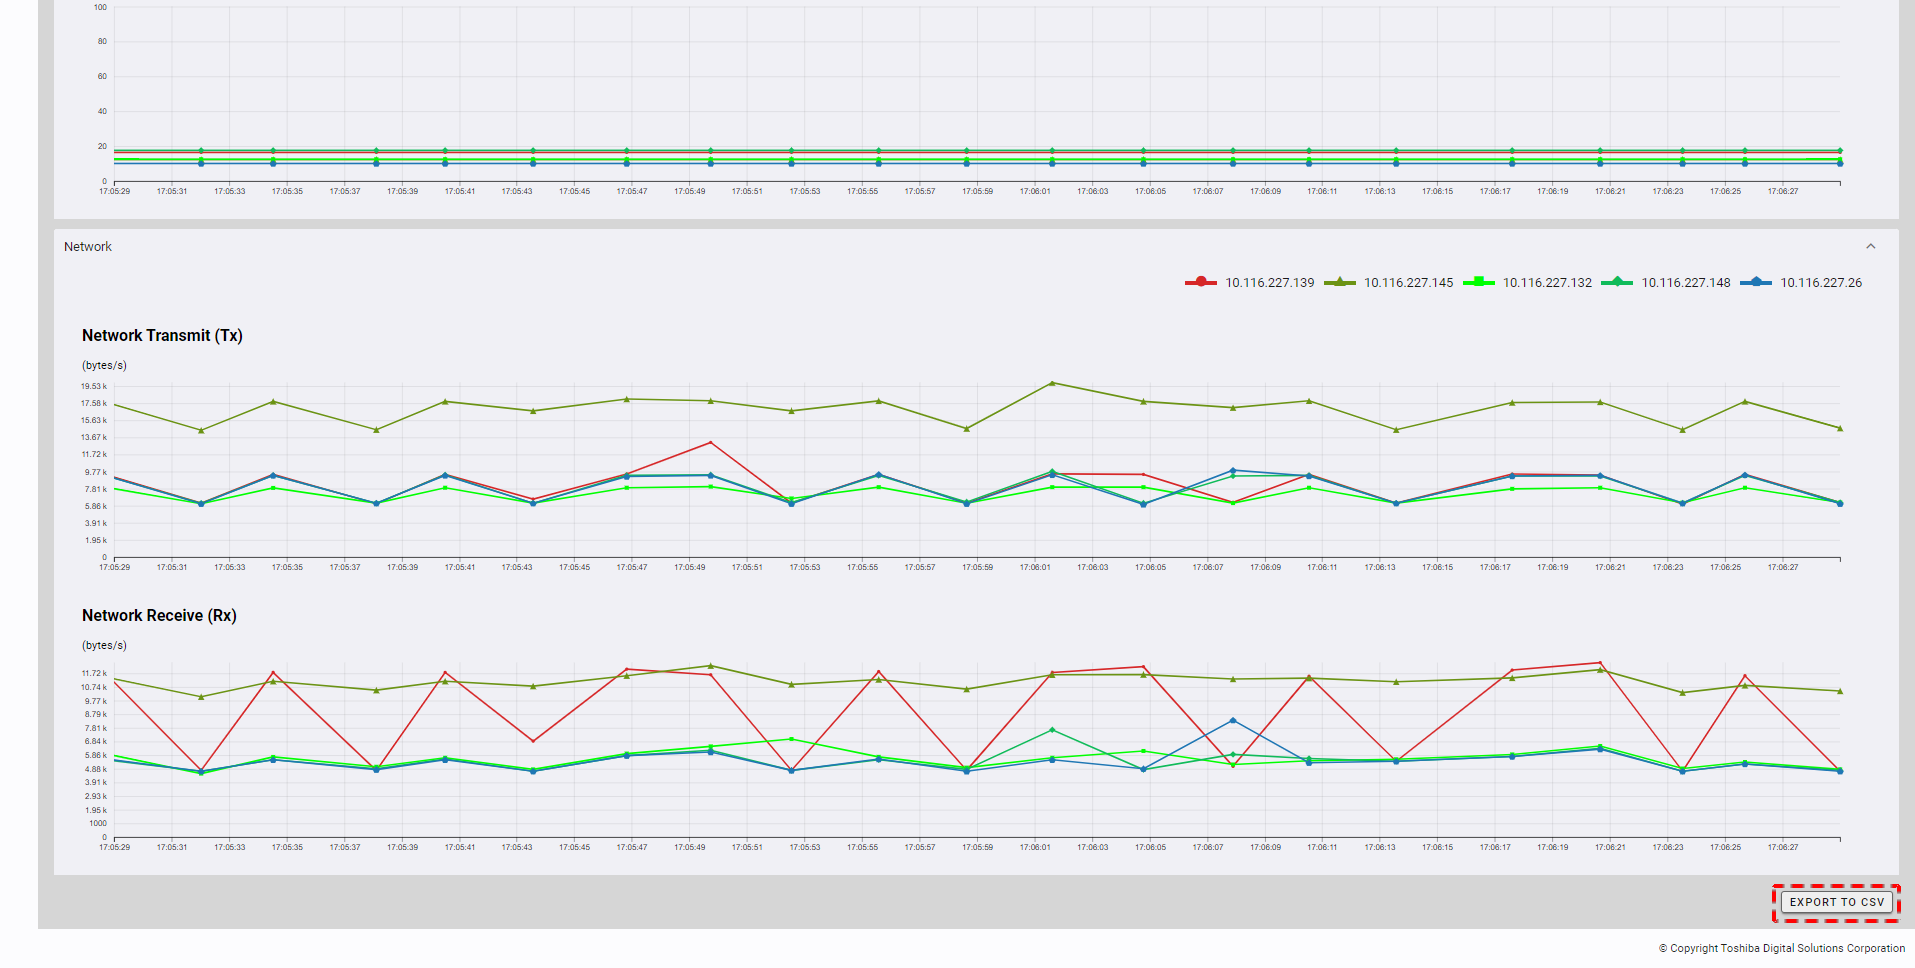
4.3.5 Exporting data to a CSV file
Step 1: To export data to a CSV file, click the [EXPORT TO CSV] button.
[Note]: The [EXPORT TO CSV] button is deactivated when charts have no data and monitoring is running.
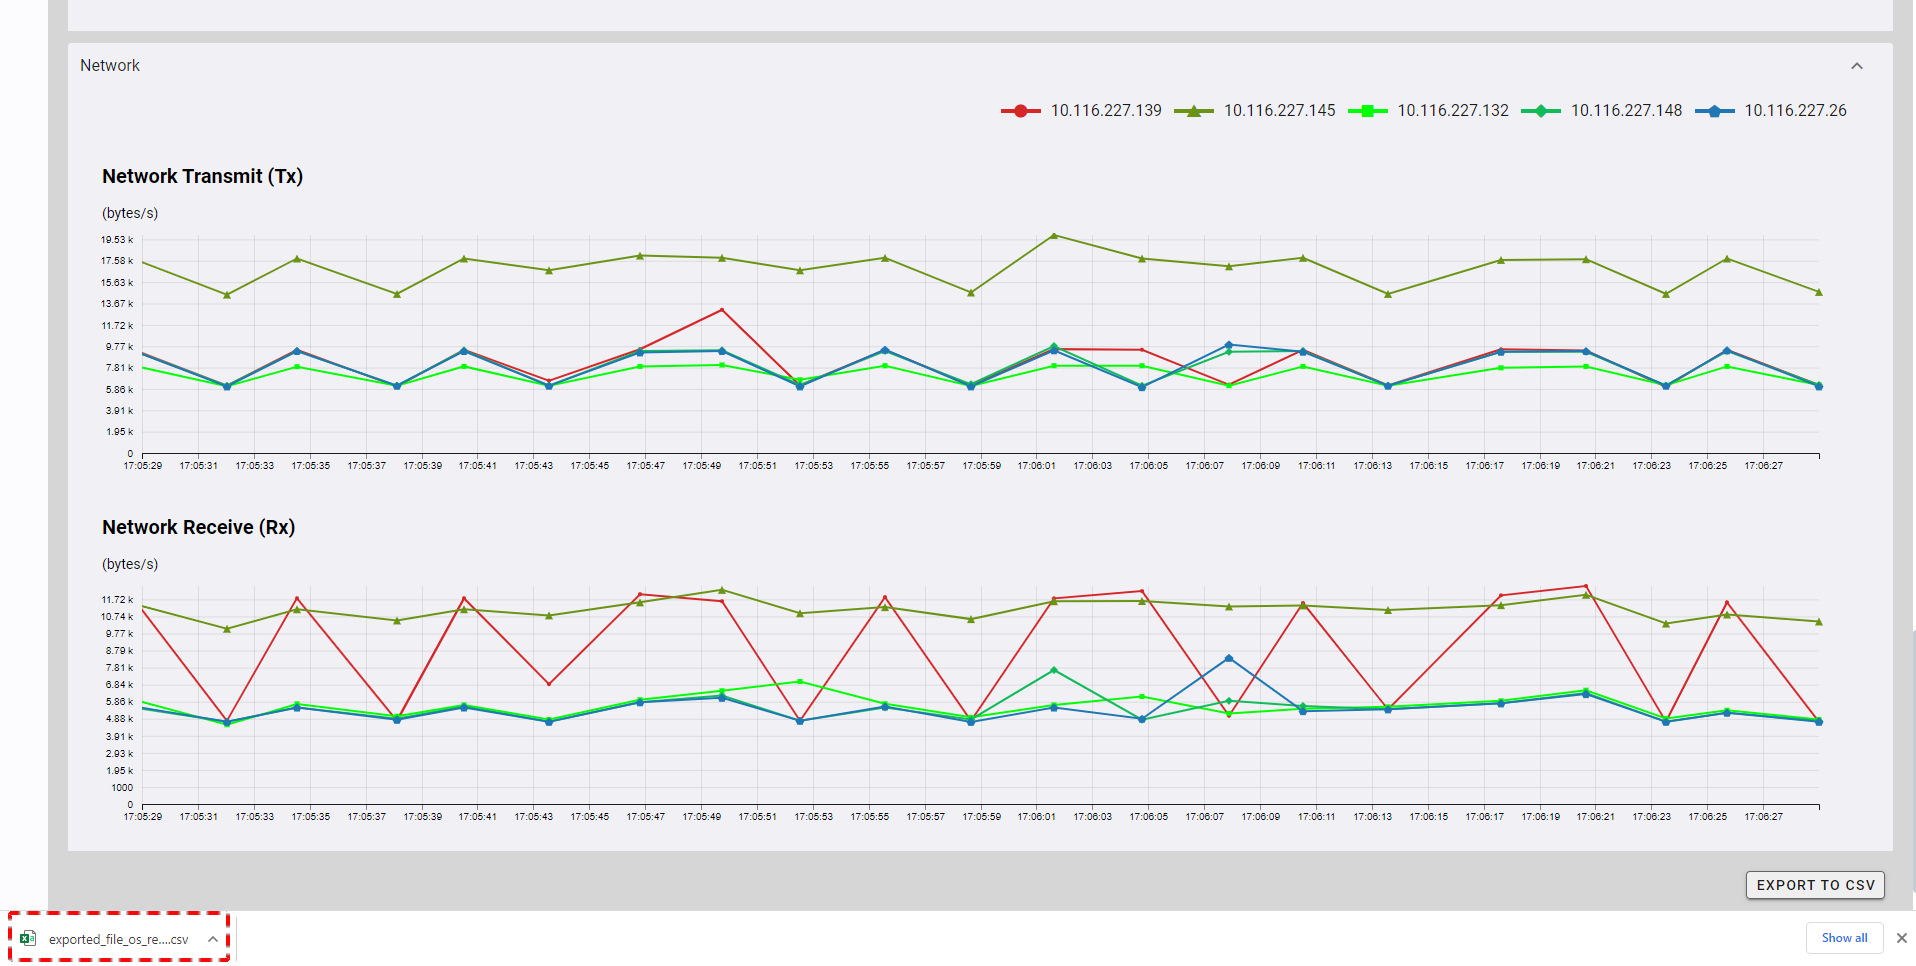
Step 2: Once the [EXPORT TO CSV] button is clicked, a confirmation dialog will be displayed. Click the [YES] button to export data to a CSV file. If you do not want to export data to a CSV file, you can click the [NO] button to close the confirmation dialog and return to the Monitoring screen without exporting data to a CSV file.
The exported data will be downloaded directly by your browser as a CSV file.
4.4 Database management function
This function is used for various operations of the database, including creating and deleting a database, and viewing the database details.
4.4.1 Available roles
The role marked with a plus sign (+) in the table below can use the function on the left.
| No. | Function | General user | Administrator user |
|---|---|---|---|
| 1 | Display a list of databases | + | + |
| 2 | Create a database | + | + |
| 3 | Delete a database | + | + |
| 4 | Display the details of a database | + | + |
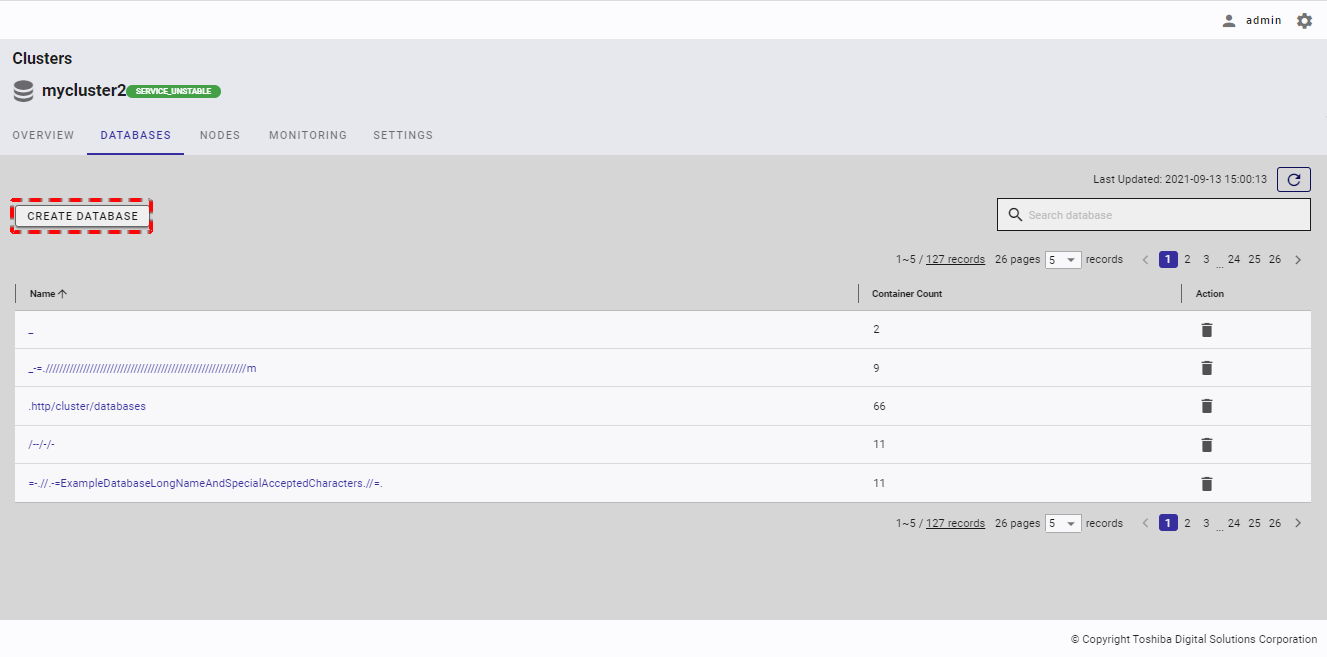
4.4.2 Displaying a list of databases
Select the item [Clusters] (①) from the left menu. Then select the [DATABASES] tab (②) to display the database screen.
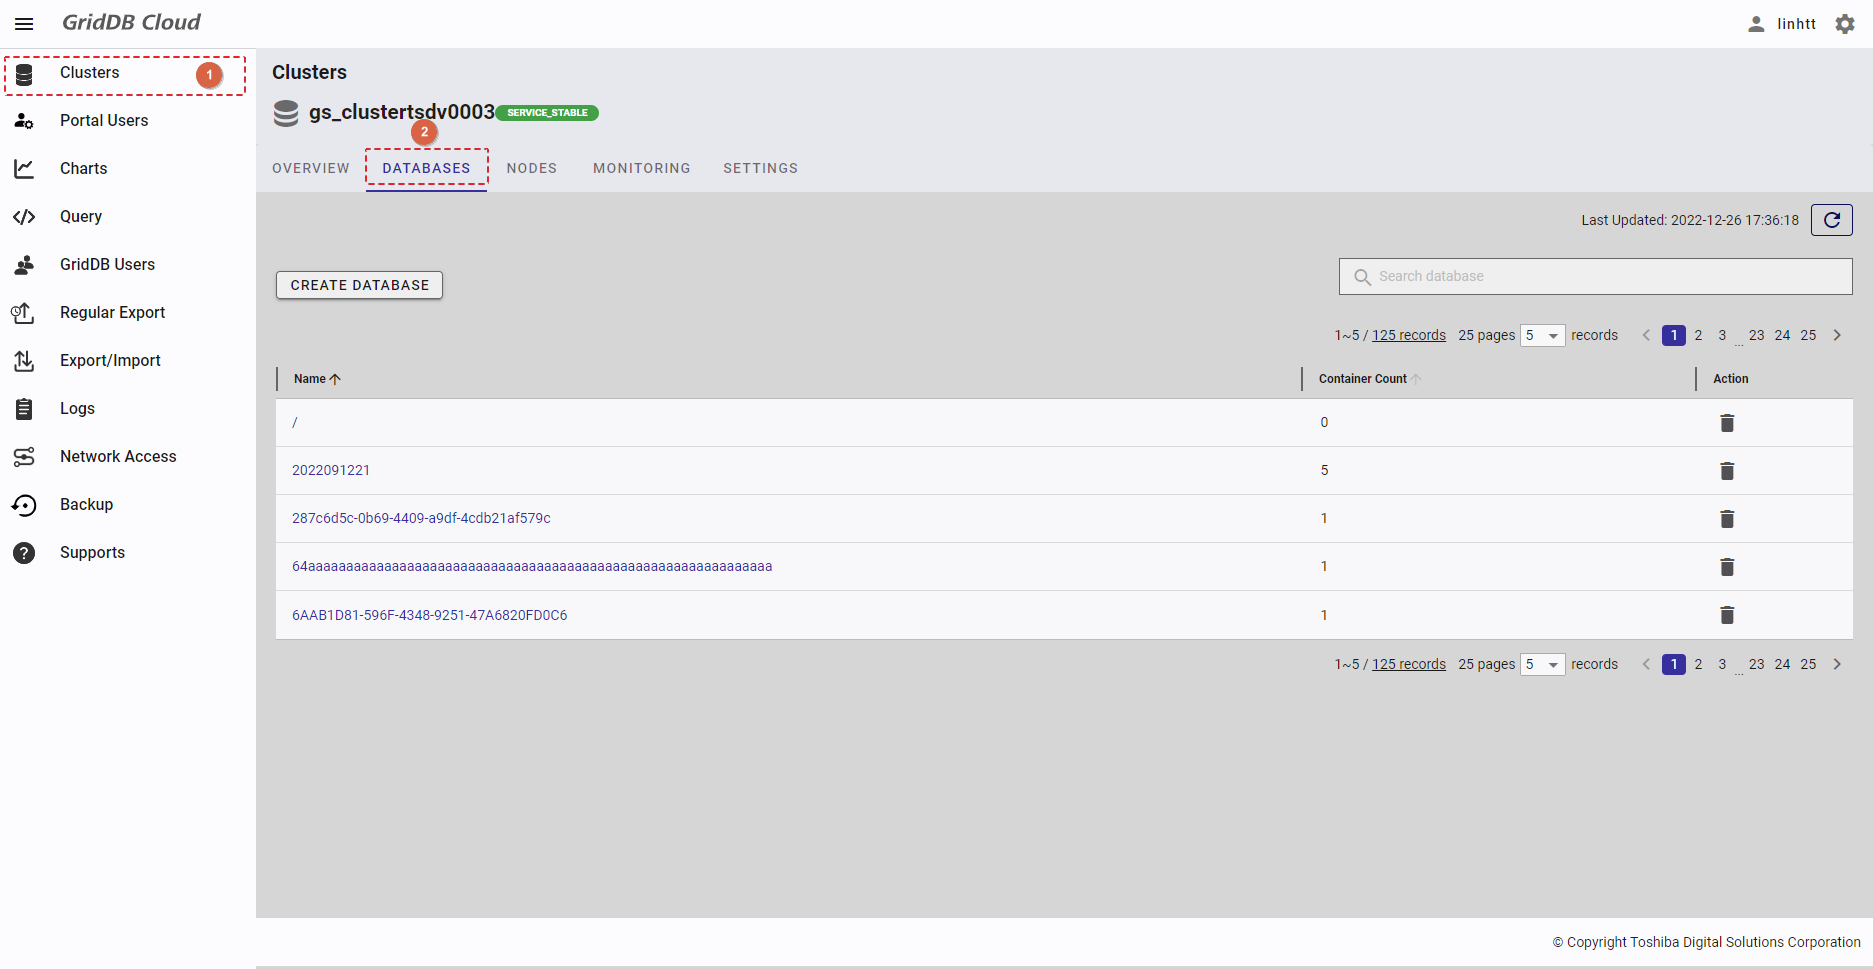
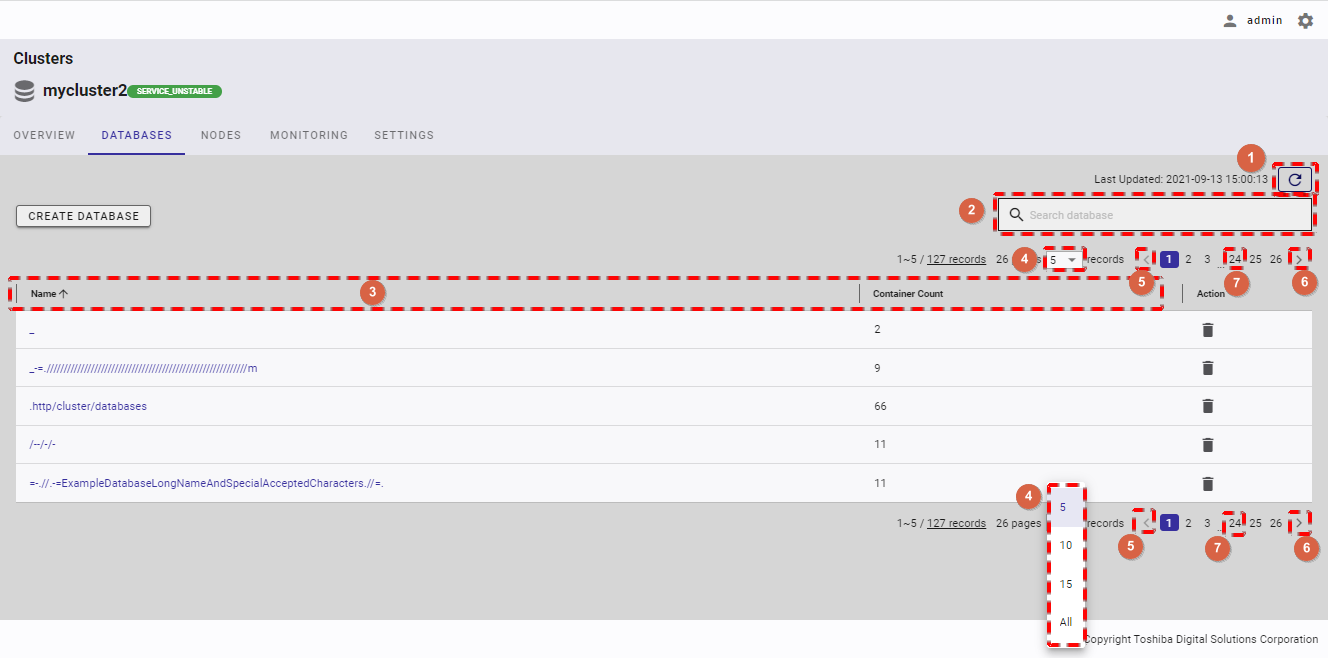
- To get the latest list of databases, click the [Refresh] button (①).
- If you want to see the specific database, type the database name in the search field (②).
- You can choose the number of databases displayed on one page by selecting the number from [5, 10, 15, All] (④) at the top or bottom of the page. Click the [Next] button (⑥) or the [Back] button (⑤), or click the page number (⑦) to view another page.
- You can order the list of databases by name or by container number, by clicking the header (③) of each column.
- You can adjust the column size by dragging and dropping the vertical bar "|" on the header.
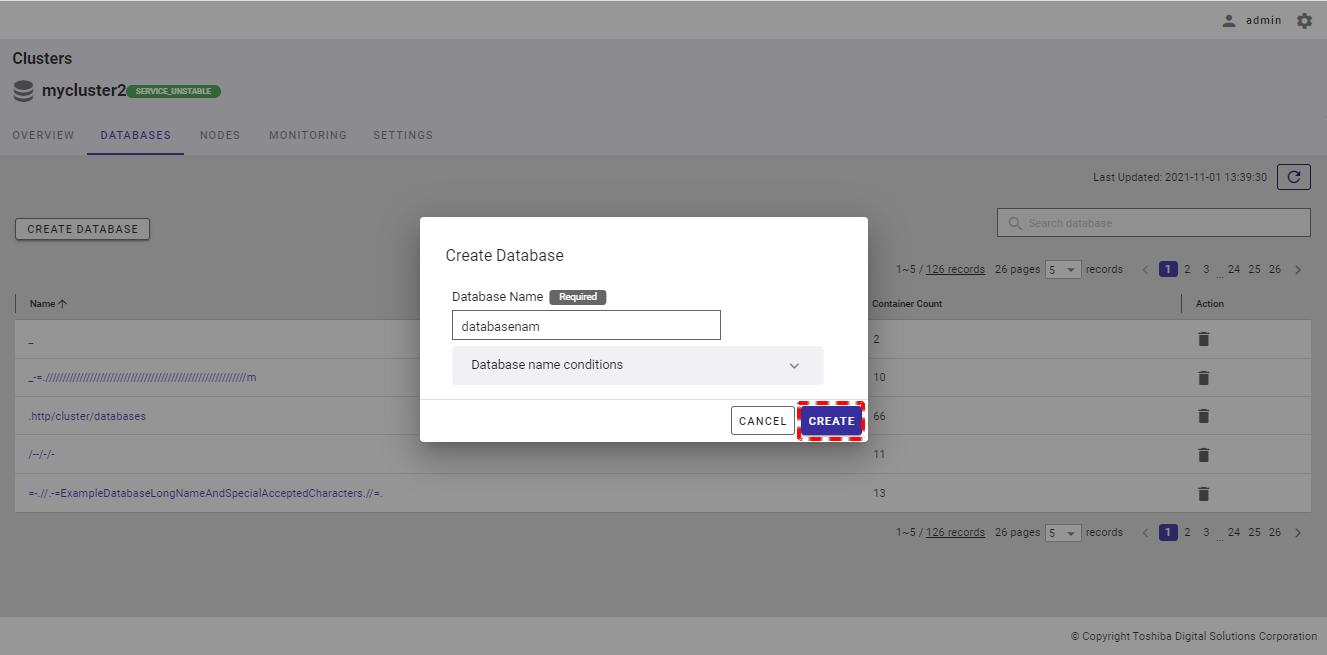
4.4.3 Creating a database
Step 1: To create a new database, click the [CREATE DATABASE] button.
[Note]: If the total number of databases exceeds 128 (including the database "public"), the [CREATE DATABASE] button will be disabled.
Step 2: When the Create Database dialog is displayed, enter the database name in the input field (①). You can click the [Database name conditions] tab (②) to show/hide the conditions for the name of a new database.
Step 3: Then, click the [CREATE] button to create a new database. If you do not want to create a database, click the [CANCEL] button to close the dialog and return to the database list screen.
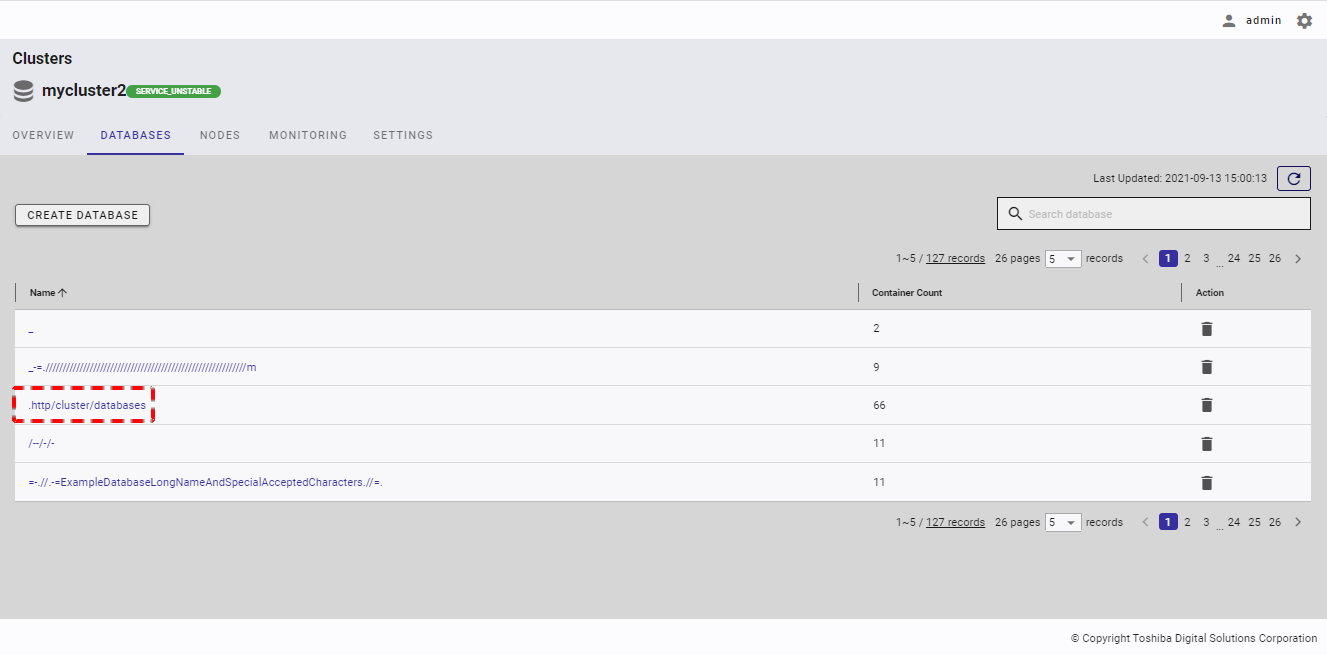
4.4.4 Displaying the details of a database
To see the details of the specific database, click the database name in the database list.
To get the latest information about the database, click the [Refresh] button (①). You can click one of the links (③) to go to desired tab.
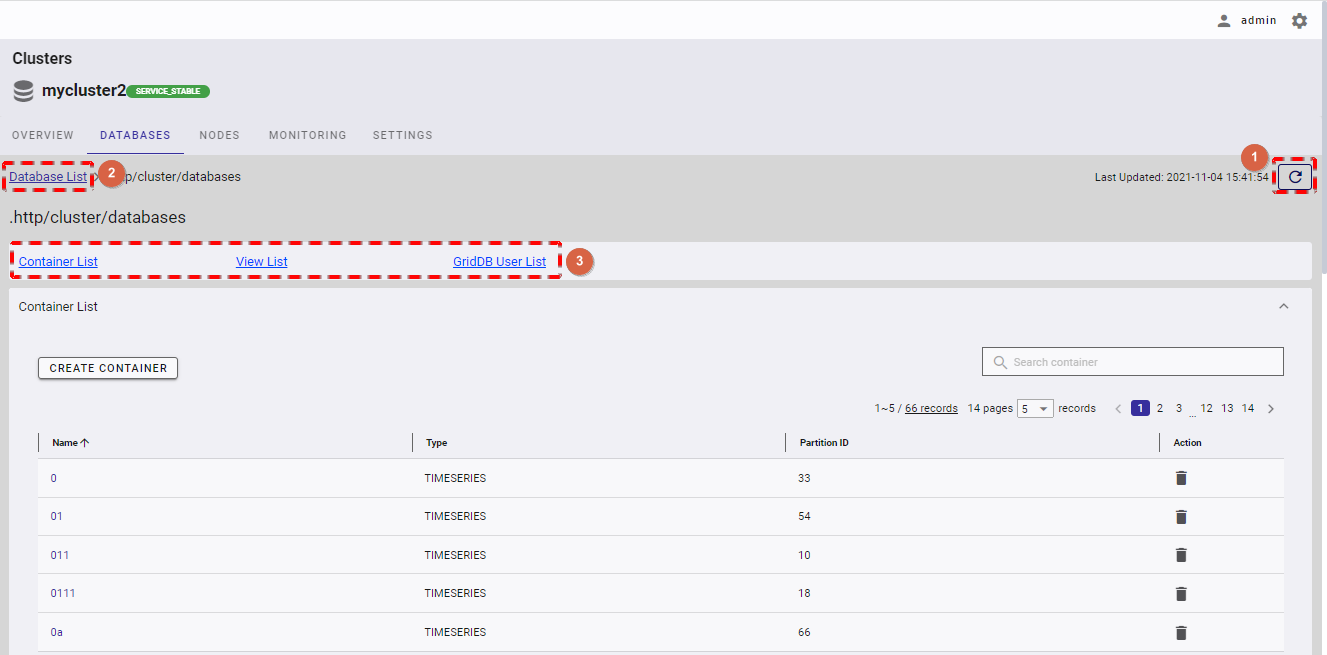
[Note]: If you want to go back to the database list, you can click the [Database List] (②).
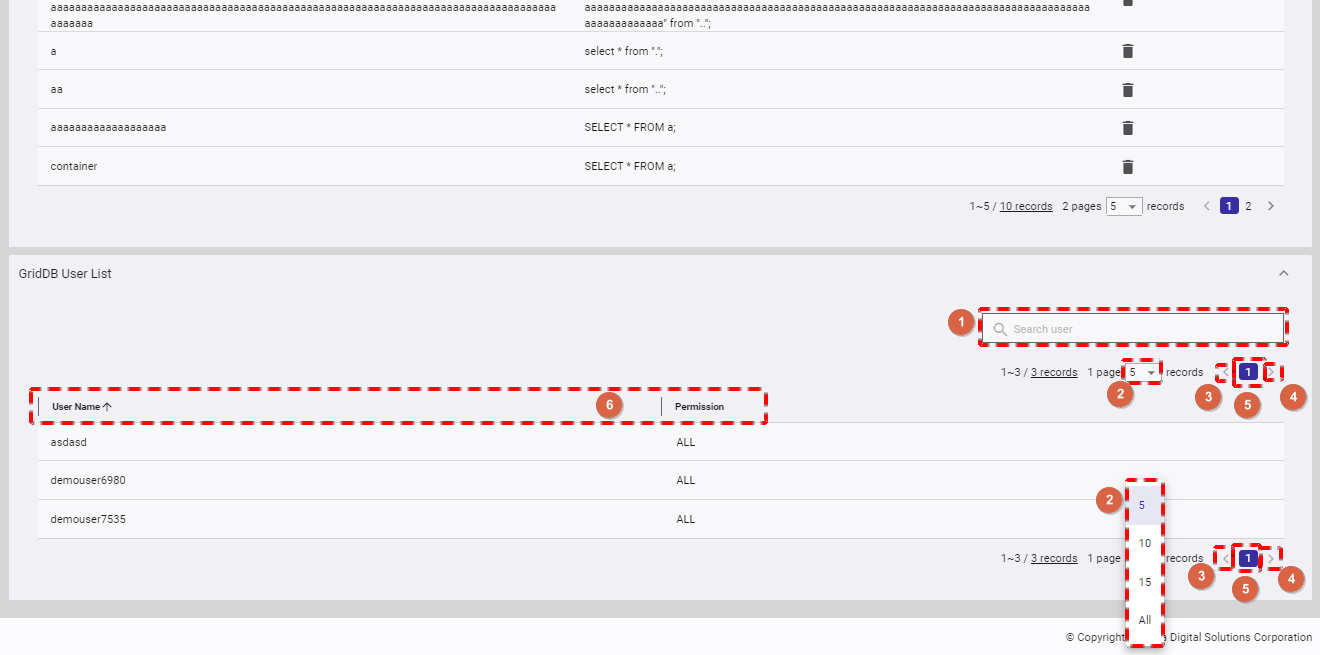
4.4.4.1 Displaying user permission
- You can click the [User Permission] tab to show/hide the GridDB user permission list of the database.
- To search for the permission of a specific user, type the user name in the search bar (①).
- You can choose the number of users displayed on one page by selecting the number from [5, 10, 15, All] (②) at the top or bottom of the page. Click the [Next] button (④) or the [Back] button (③), or click the page number (⑤) to view another page.
- You can order the list of users by user name or by user permission, by clicking the header (⑥) of each column.
- There are two types of database permission: READ and ALL, as described in the table below.
- To add a new database user, see Creating a database user; to add a user permission for this database, see Adding a database permission
- You can adjust the column size by dragging and dropping the vertical bar "|" on the header.
- Types of database permission:
| Database permission | Description |
|---|---|
| READ | Only search operations are allowed. |
| ALL | All operations to a container are allowed, such as creating a container, adding a row, searching, and creating an index. |
4.4.5 Deleting a database
Step 1: In the database list screen, click the [DELETE] button to delete a specific database.
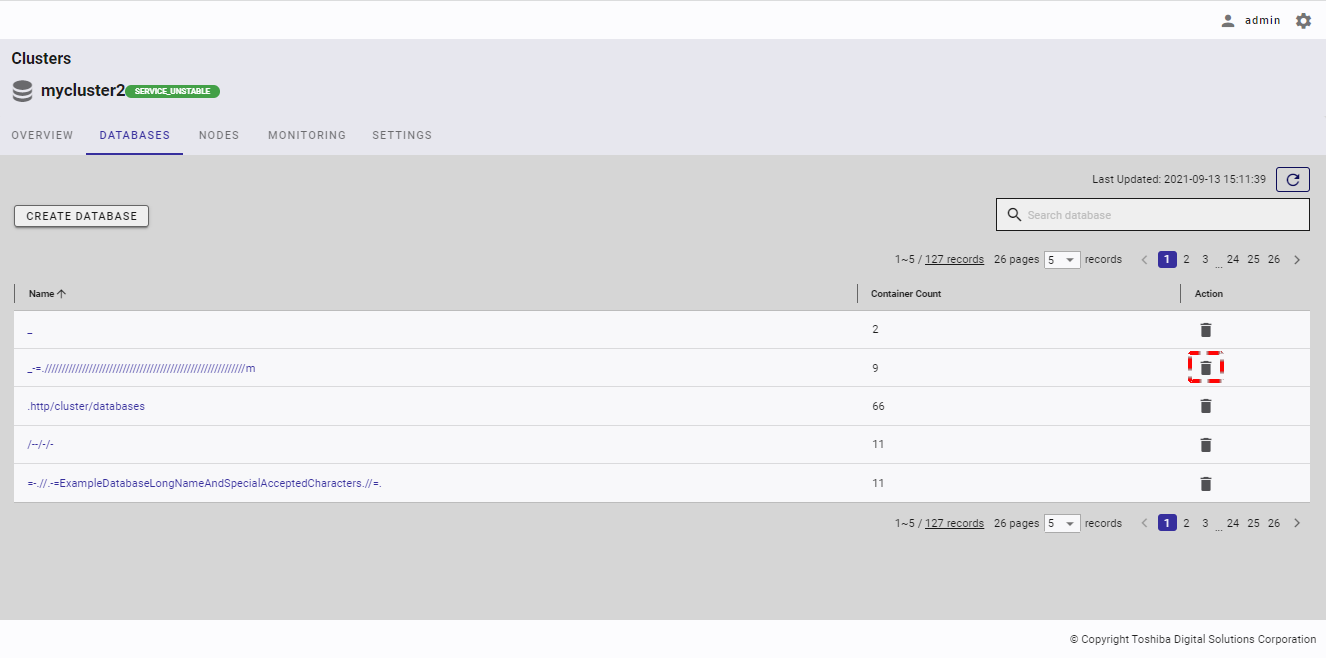
- You can only delete the database which has no container.
- You cannot delete the default database public.
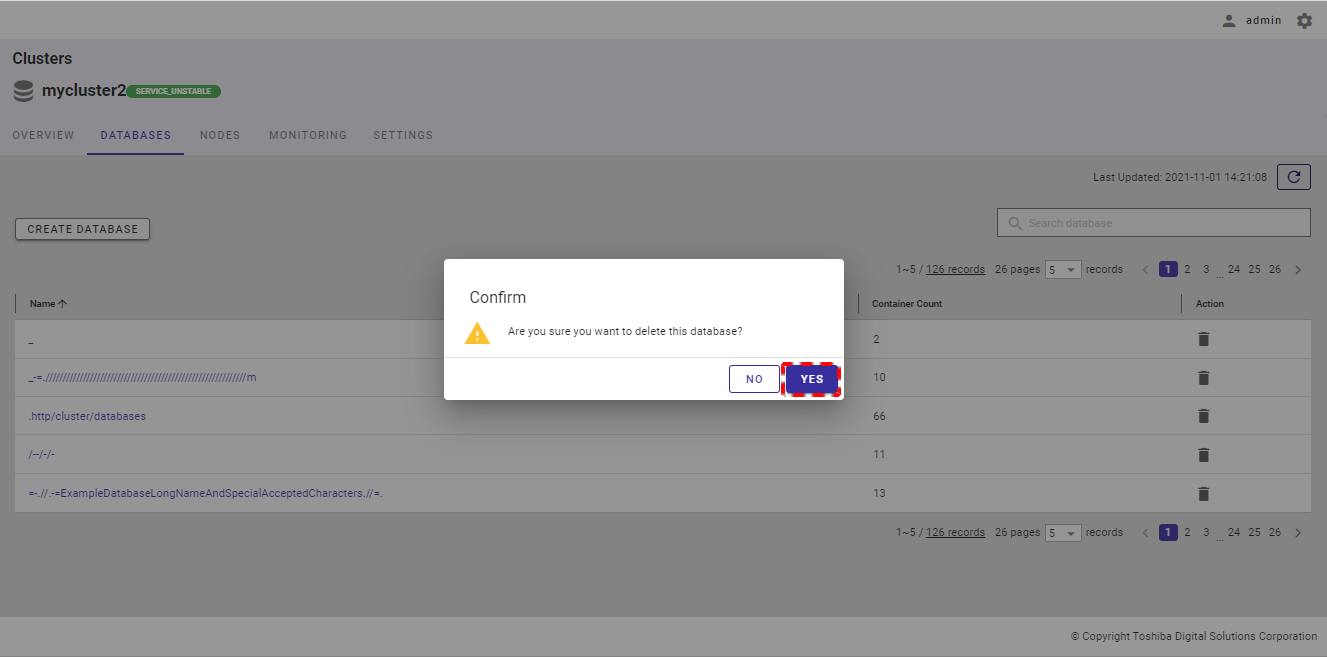
Step 2: When the confirmation dialog is displayed, click the [YES] button to delete the database. If you do not want to delete the database, click the [NO] button to close the dialog and return to the database list screen.
4.5 Container management function
This function is used for various operations of the container, including creating and deleting a container, and viewing container details.
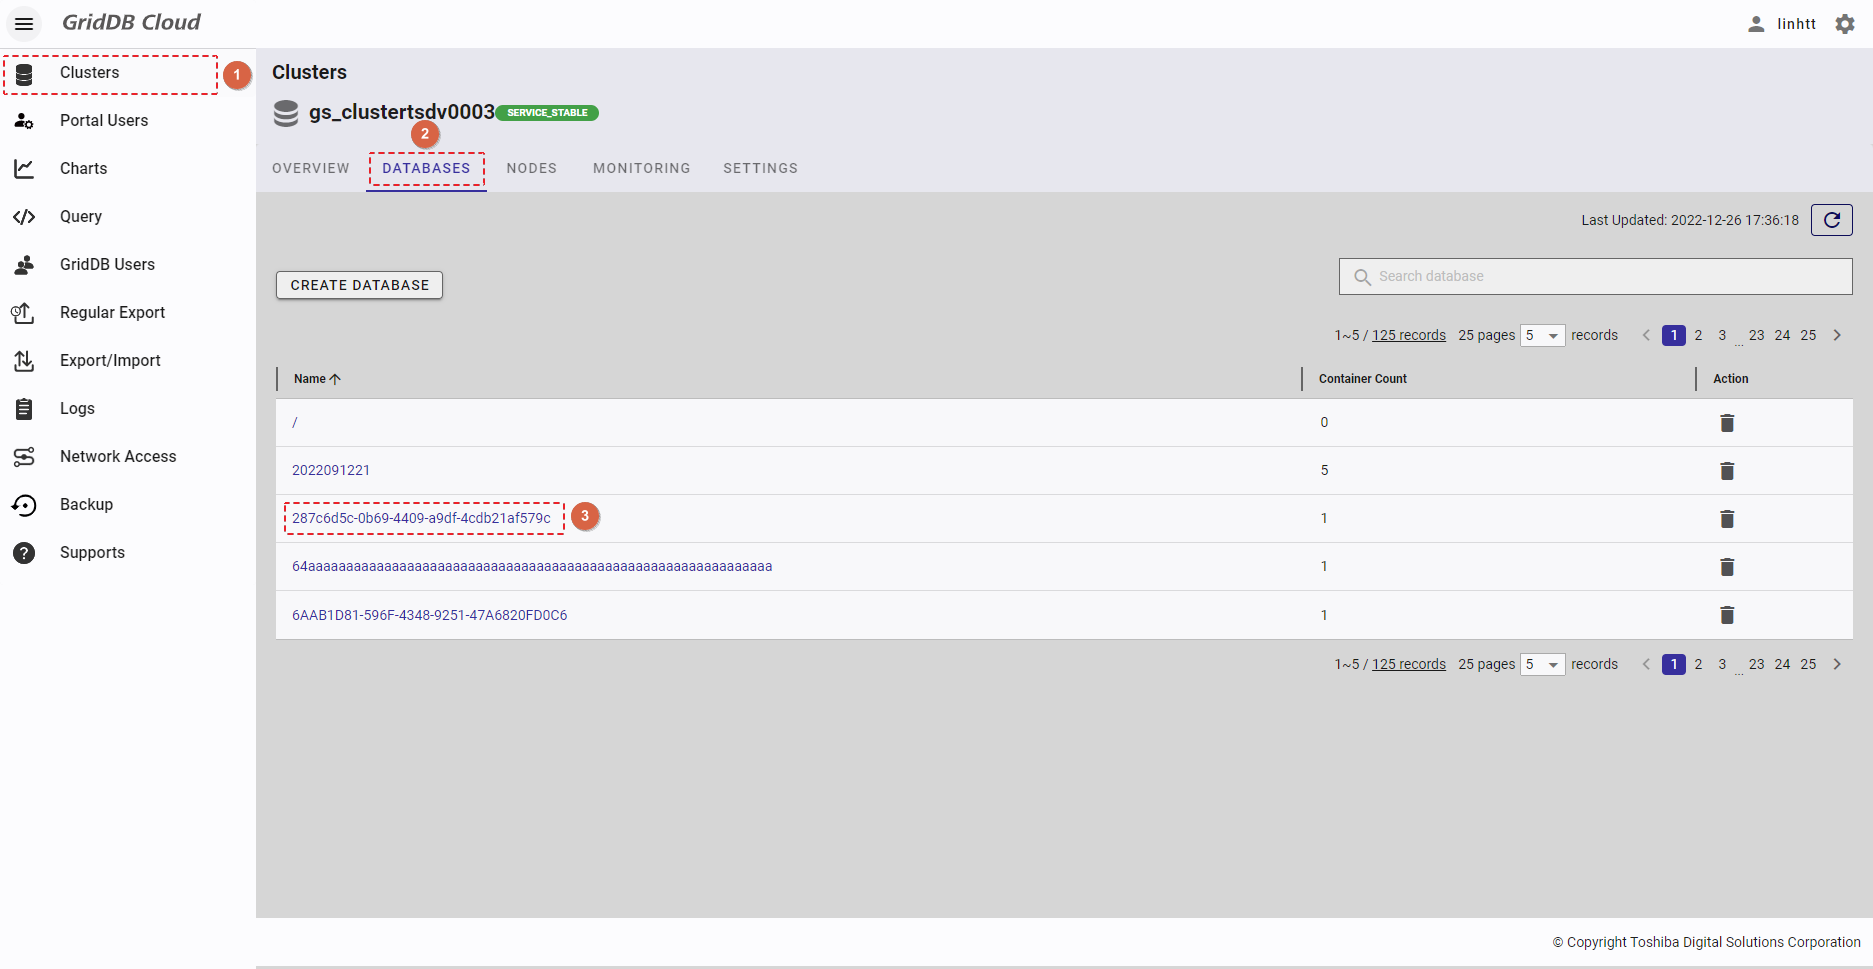
Select the item [Clusters] (①) from the left menu. Then select the [DATABASES] tab (②) to display the database screen, where you click the database name (③) to see the container list of this database.
4.5.1 Available roles
In the table below, the role with a plus sign (+) can use the function on the left.
| No. | Function | General user | Administrator user |
|---|---|---|---|
| 1 | Display a container list | + | + |
| 2 | Create a container | + | + |
| 3 | Delete a container | + | + |
| 4 | Display container details | + | + |
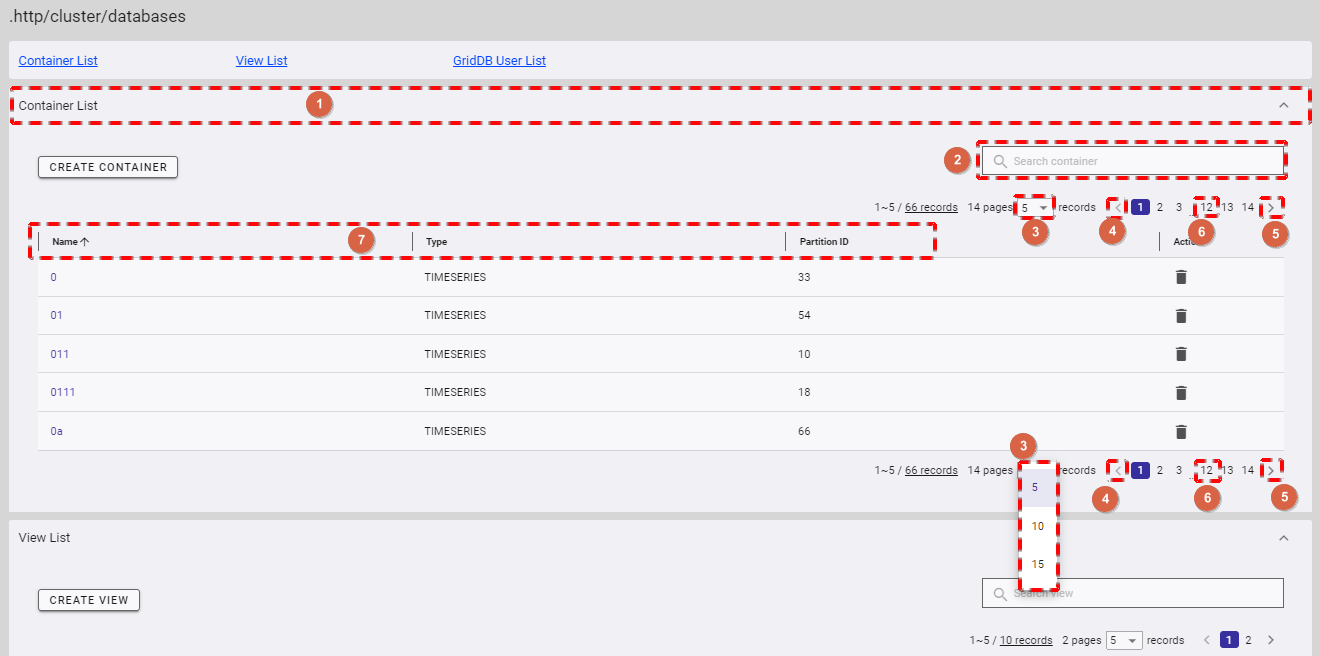
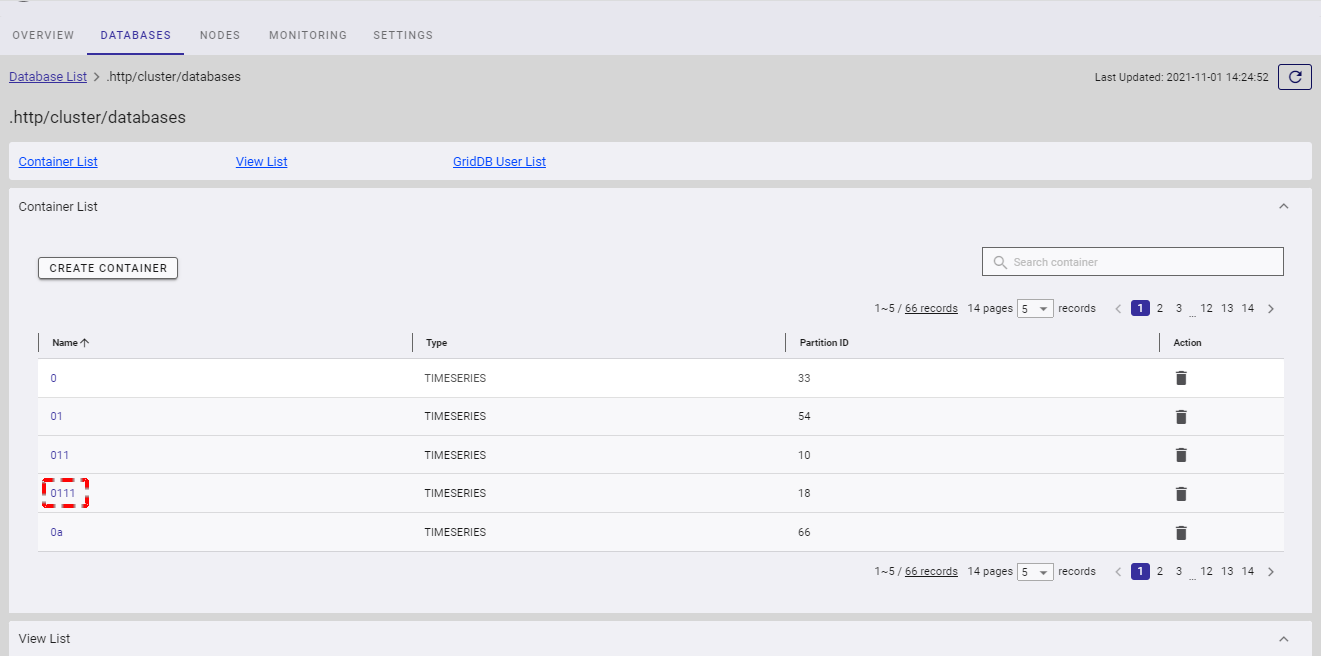
4.5.2 Displaying a container list
In the database information screen, click the [CONTAINER] tab (①) to show/hide the container list.
- If you want to search a specific container, type the container name in the search bar (②) and press the enter key.
- You can choose the number of containers displayed on one page by selecting the number from [5, 10, 15, All] (③) at the top or bottom of the page. Click the [Next] button (⑤) or the [Back] button (④), or click the page number (⑥) to view another page.
- You can order the list of containers by name, by type, or by partition ID, by clicking the header (⑦) of each column.
- You can adjust the column size by dragging and dropping the vertical bar "|" on the header.
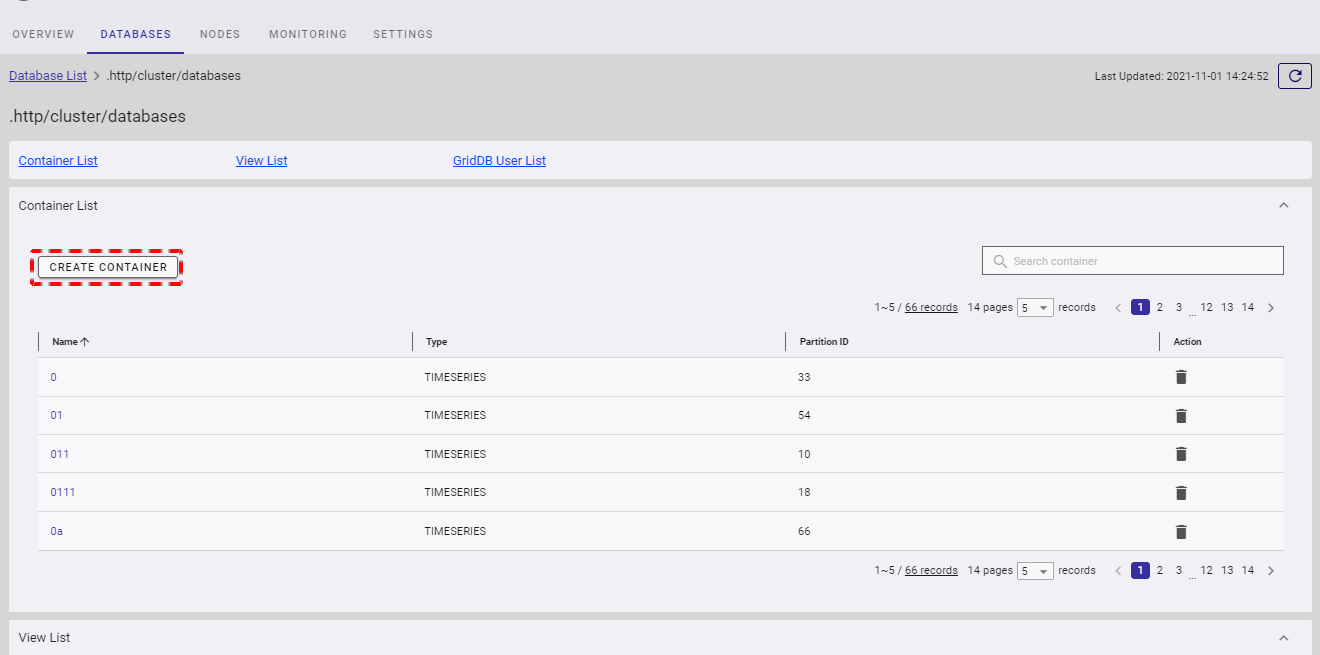
4.5.3 Creating a container
To create a new container, click the [CREATE CONTAINER] button.
After the Create Container dialog is displayed, fill in the detail of the container in the input field.
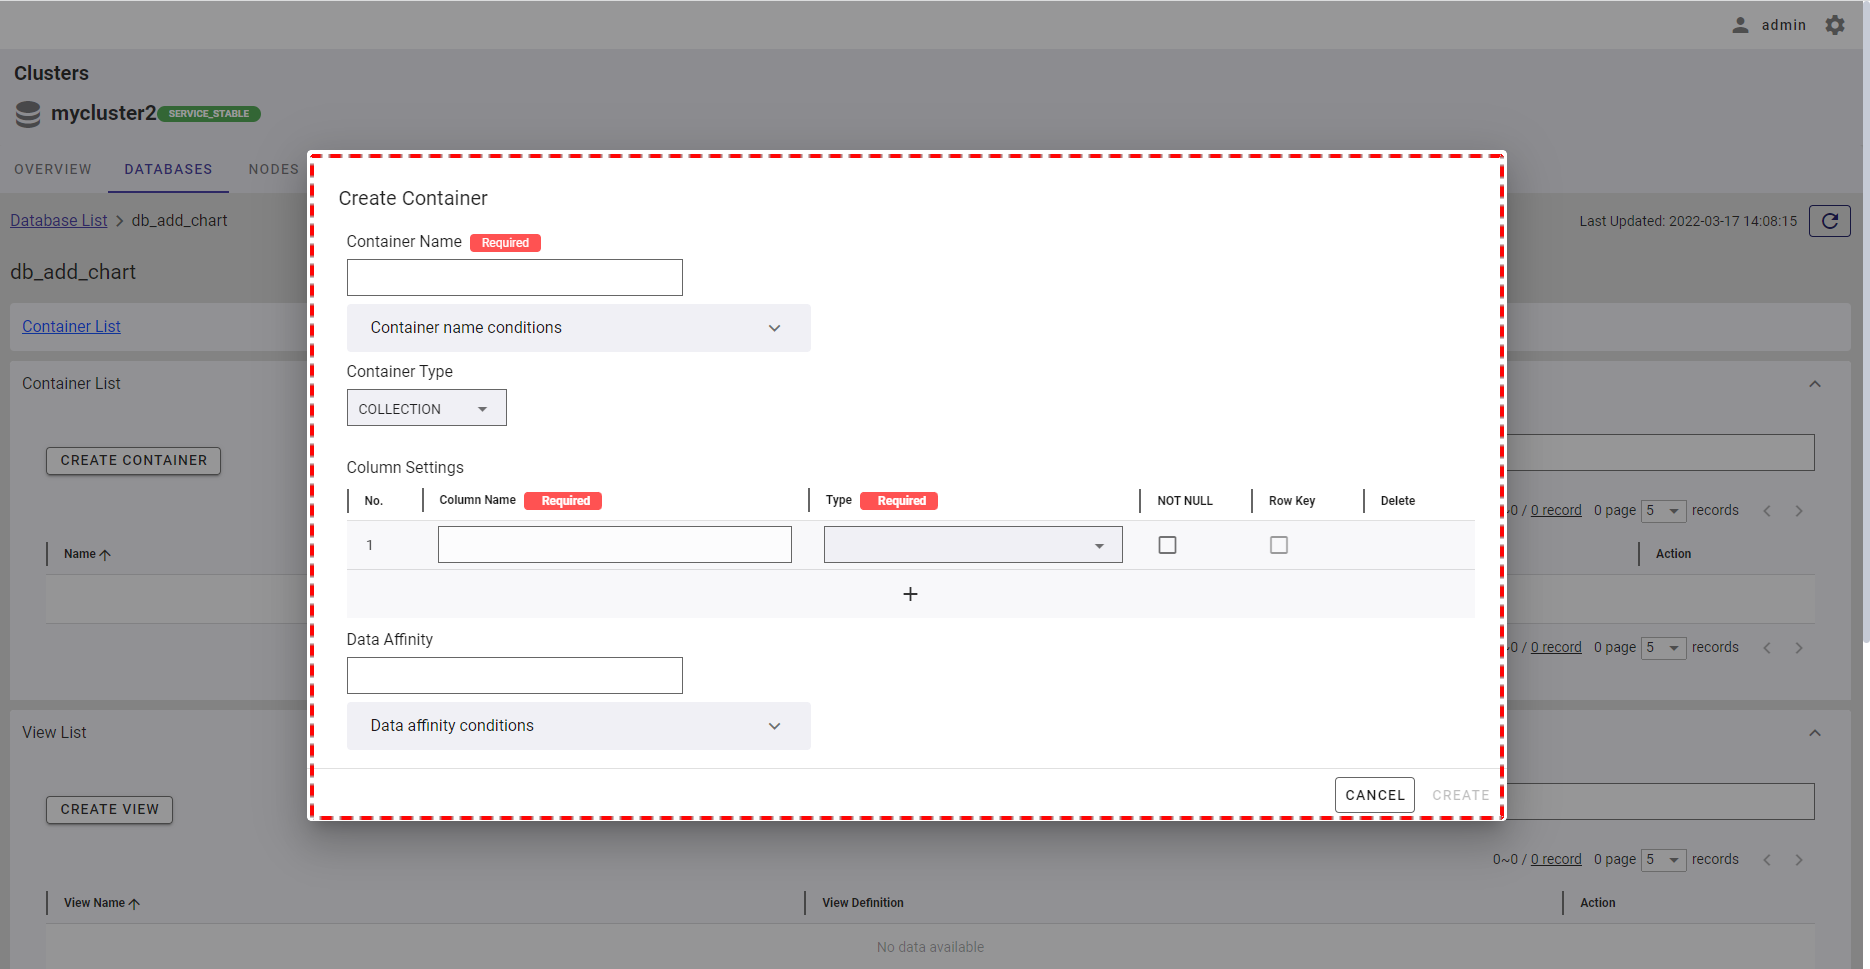
- Collection: Container for managing general data. To create a collection, see Creating a collection.
- Timeseries container: Container for managing time series data. Time series data is a collection of observations obtained through repeated measurements over time. To create a timeseries container, see Creating a timeseries container.
- By default, the container type is set to COLLECTION.
- You can adjust the column size by dragging and dropping the vertical bar "|" on the header.
4.5.3.1 Creating a collection
In the Create Container dialog, the default container type COLLECTION is selected.
Step 1:
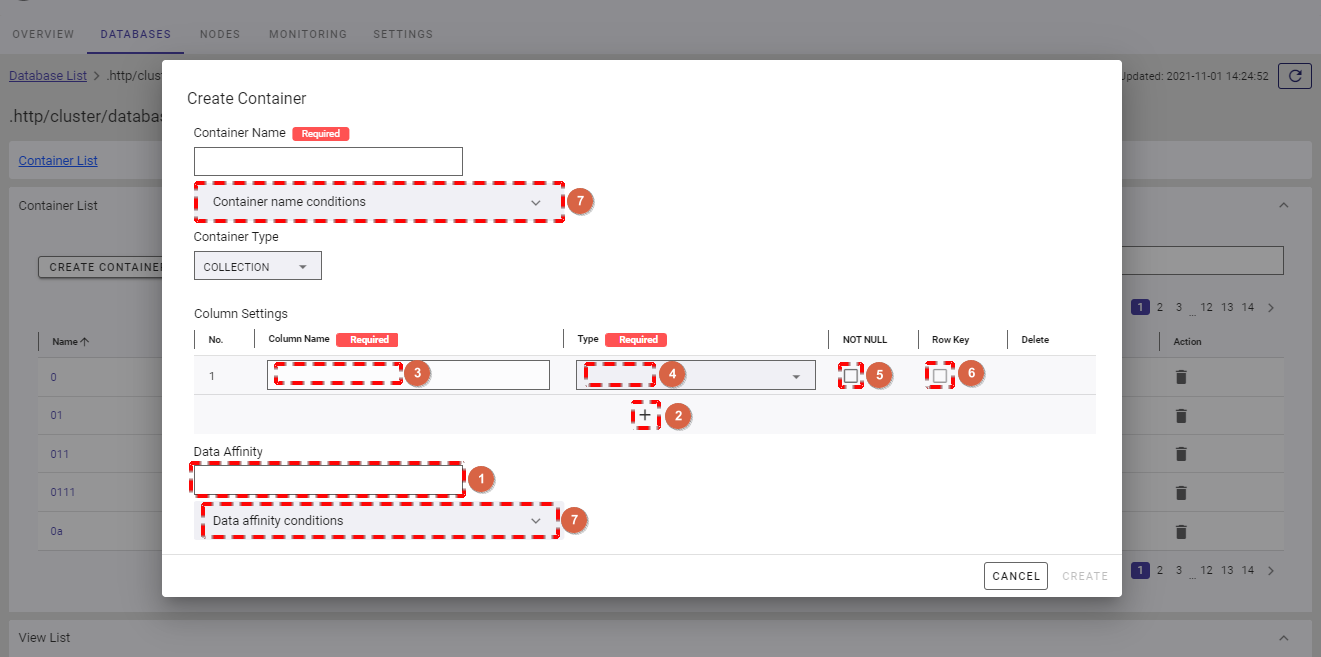
- Once COLLECTION is chosen, the dialog is displayed as the image below. Here you can provide the affinity of data in the [Data Affinity] field (①)(optional). Data affinity is a function to increase the memory hit rate by arranging highly correlated data in the same block and localizing data access.
- To add a new column to the container, click the [+] button (②).
- You can define the name of the column by filling in the [Column Name] field (③). Then choose the type of that column from the [Type] drop-down list (④). You can see supported types in the table below.
- You can choose the NOT NULL constraint for the column by checking the [Not Null] checkbox (⑤). The value in the column with the NOT NULL constraint cannot be empty. To define a row identifier, check the [Row Key] checkbox (⑥).
- You can click the [Container name conditions] tab (⑦) to show/hide the conditions for the name of a container name. You can also click the [Data affinity conditions] tab (⑦) to show/hide the conditions for data affinity.
[Note]: For more details of data affinity, refer to the section on data affinity in the GridDB Features Reference.
Supported types:
| Description | Type | |
|---|---|---|
| BASIC data types | Boolean type | BOOL |
| Character string | STRING | |
| Integer type | BYTE, SHORT, INTEGER, LONG | |
| Floating point type | FLOAT, DOUBLE | |
| Time type | TIMESTAMP | |
| Spatial type | GEOMETRY | |
| Object data type | BLOB | |
| HYBRID types | Array type | BOOL_ARRAY, STRING_ARRAY, BYTE_ARRAY, SHORT_ARRAY, INTEGER_ARRAY, LONG_ARRAY, FLOAT_ARRAY, DOUBLE_ARRAY, TIMESTAMP_ARRAY |
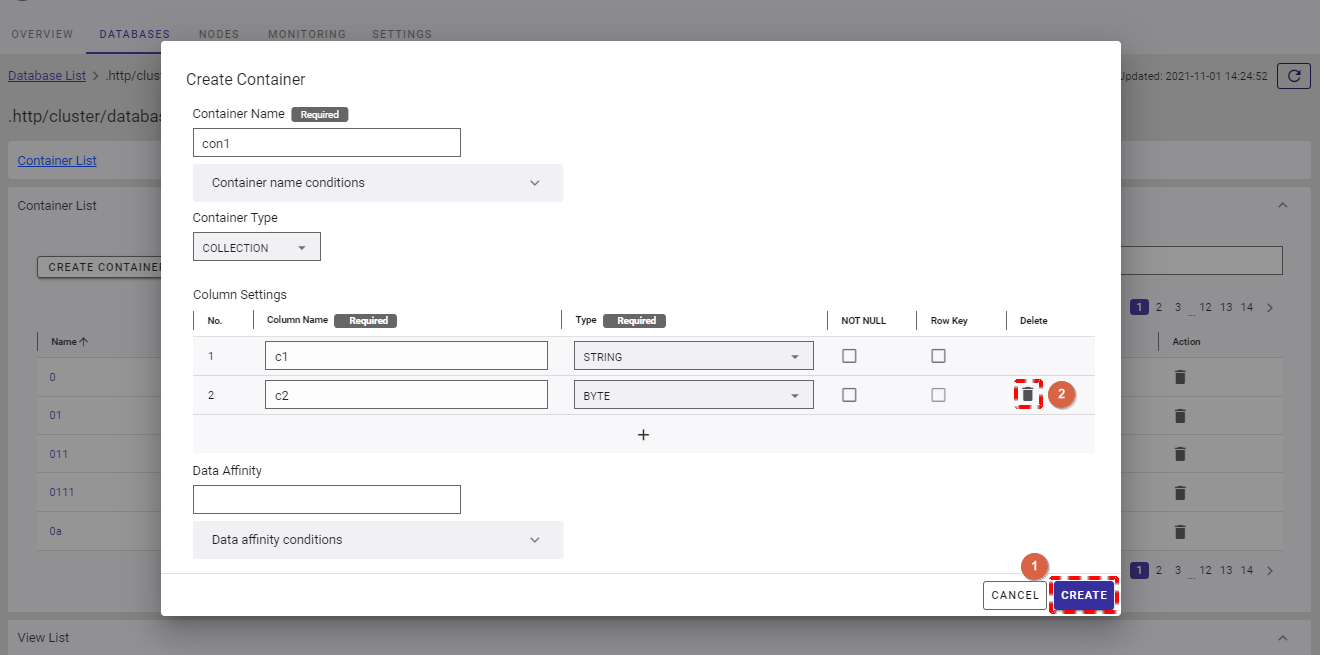
Step 2:
- To delete the unwanted column, click the [DELETE] button (②).
- After filling in all information, click the [CREATE] button (①) to create a container.
- If you do not want to create the container, click the [CANCEL] button to close the dialog and return to the container list screen.
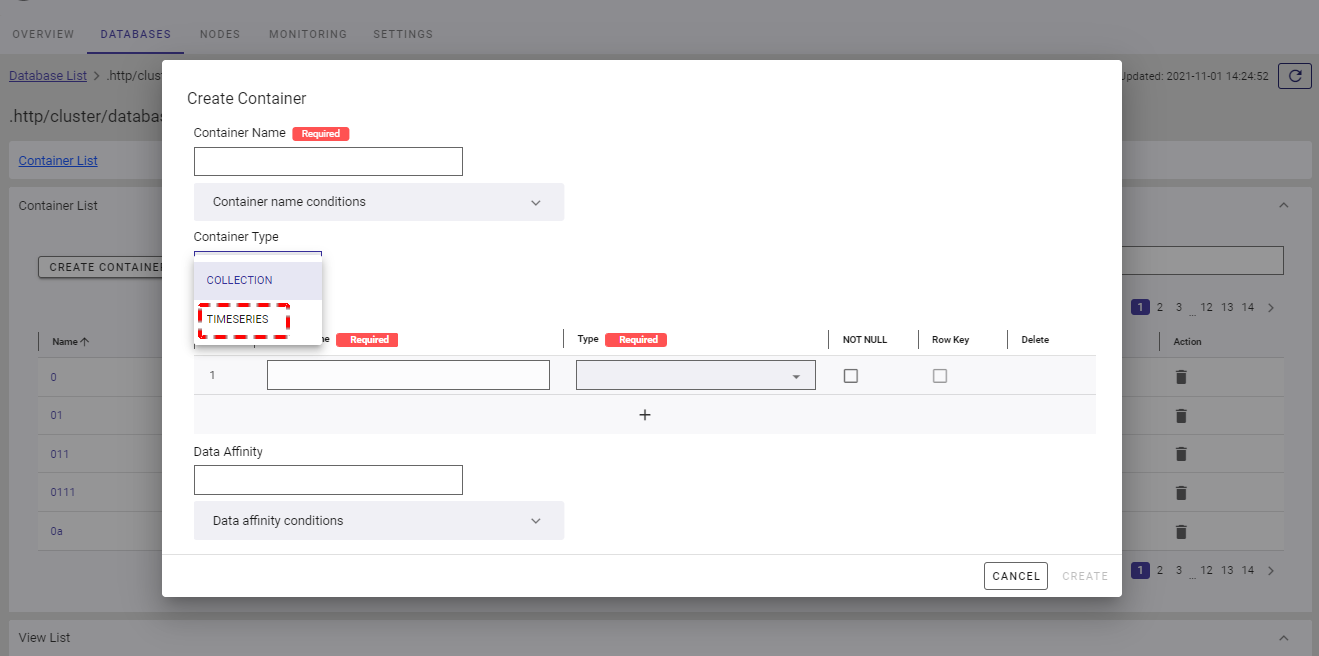
4.5.3.2 Creating a timeseries container
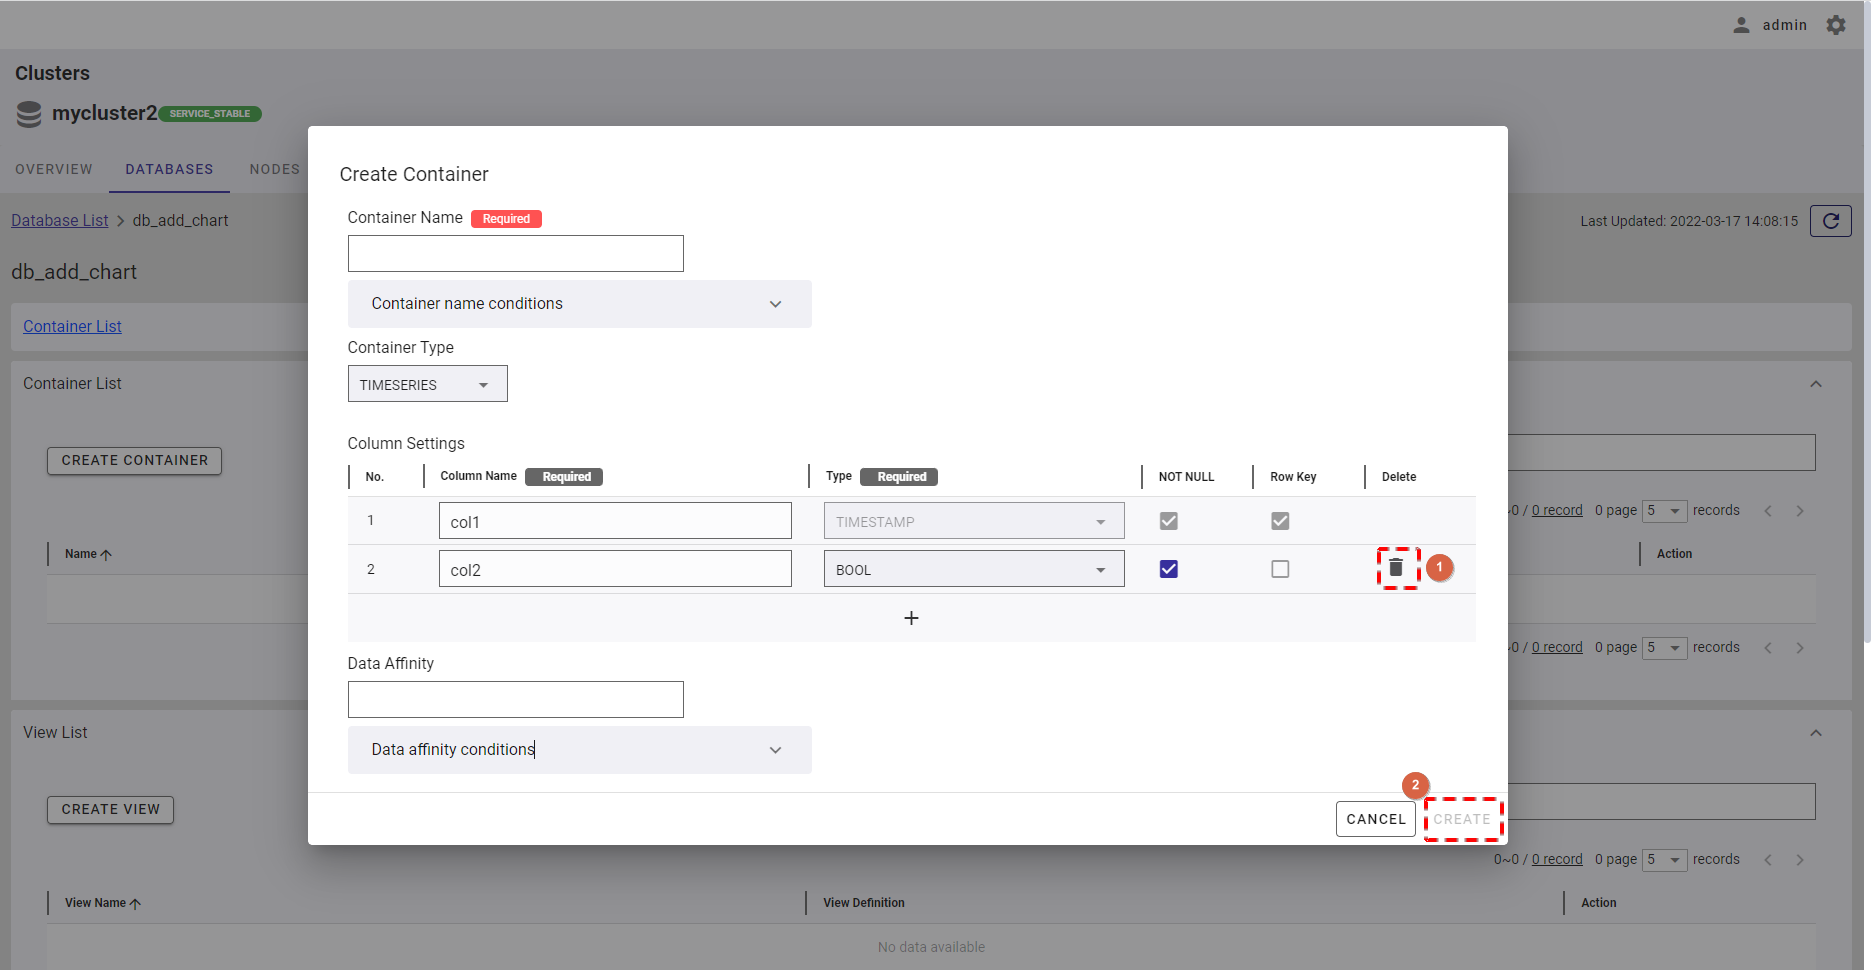
Step 1: In the Create Container dialog, choose [TIMESERIES].
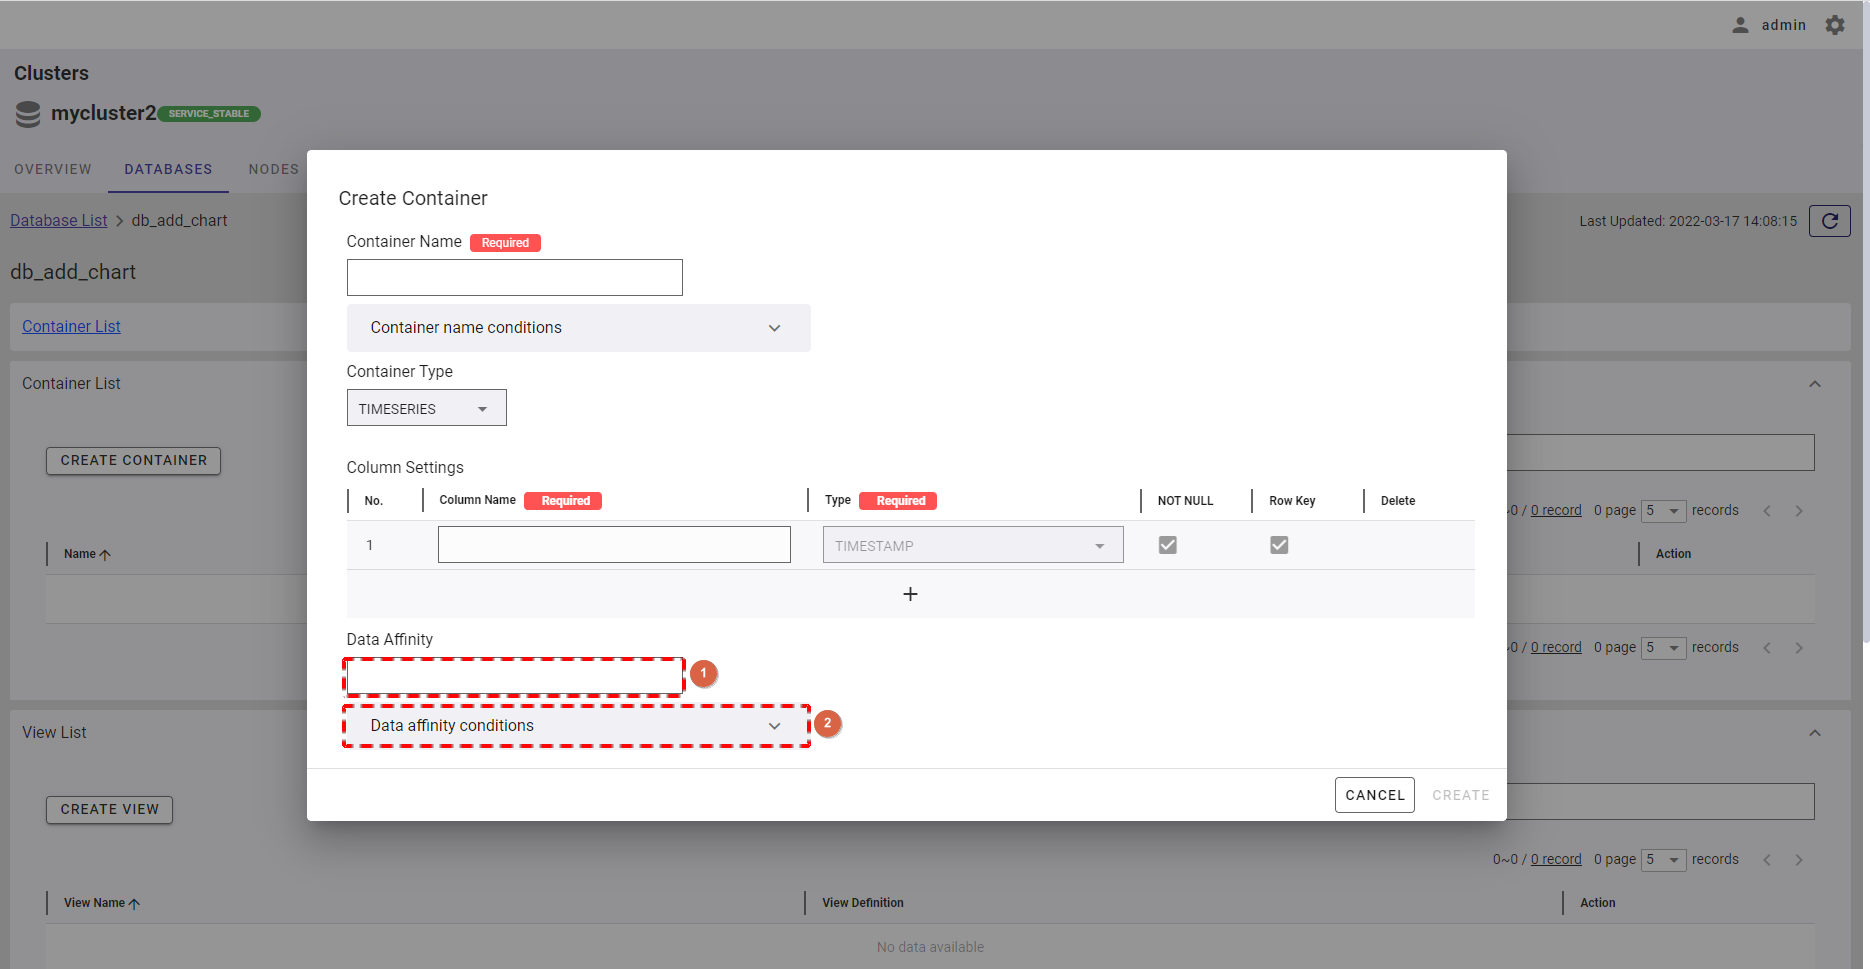
Step 2:
- Once TIMESERIES is chosen, the dialog is displayed as the image below. Here you can provide the affinity of data in the [Data Affinity] field (①)(optional). Data affinity is a function to increase the memory hit rate by arranging highly correlated data in the same block and localizing data access.
- You can click the [Data affinity conditions] tab (②) to show/hide the conditions for data affinity.
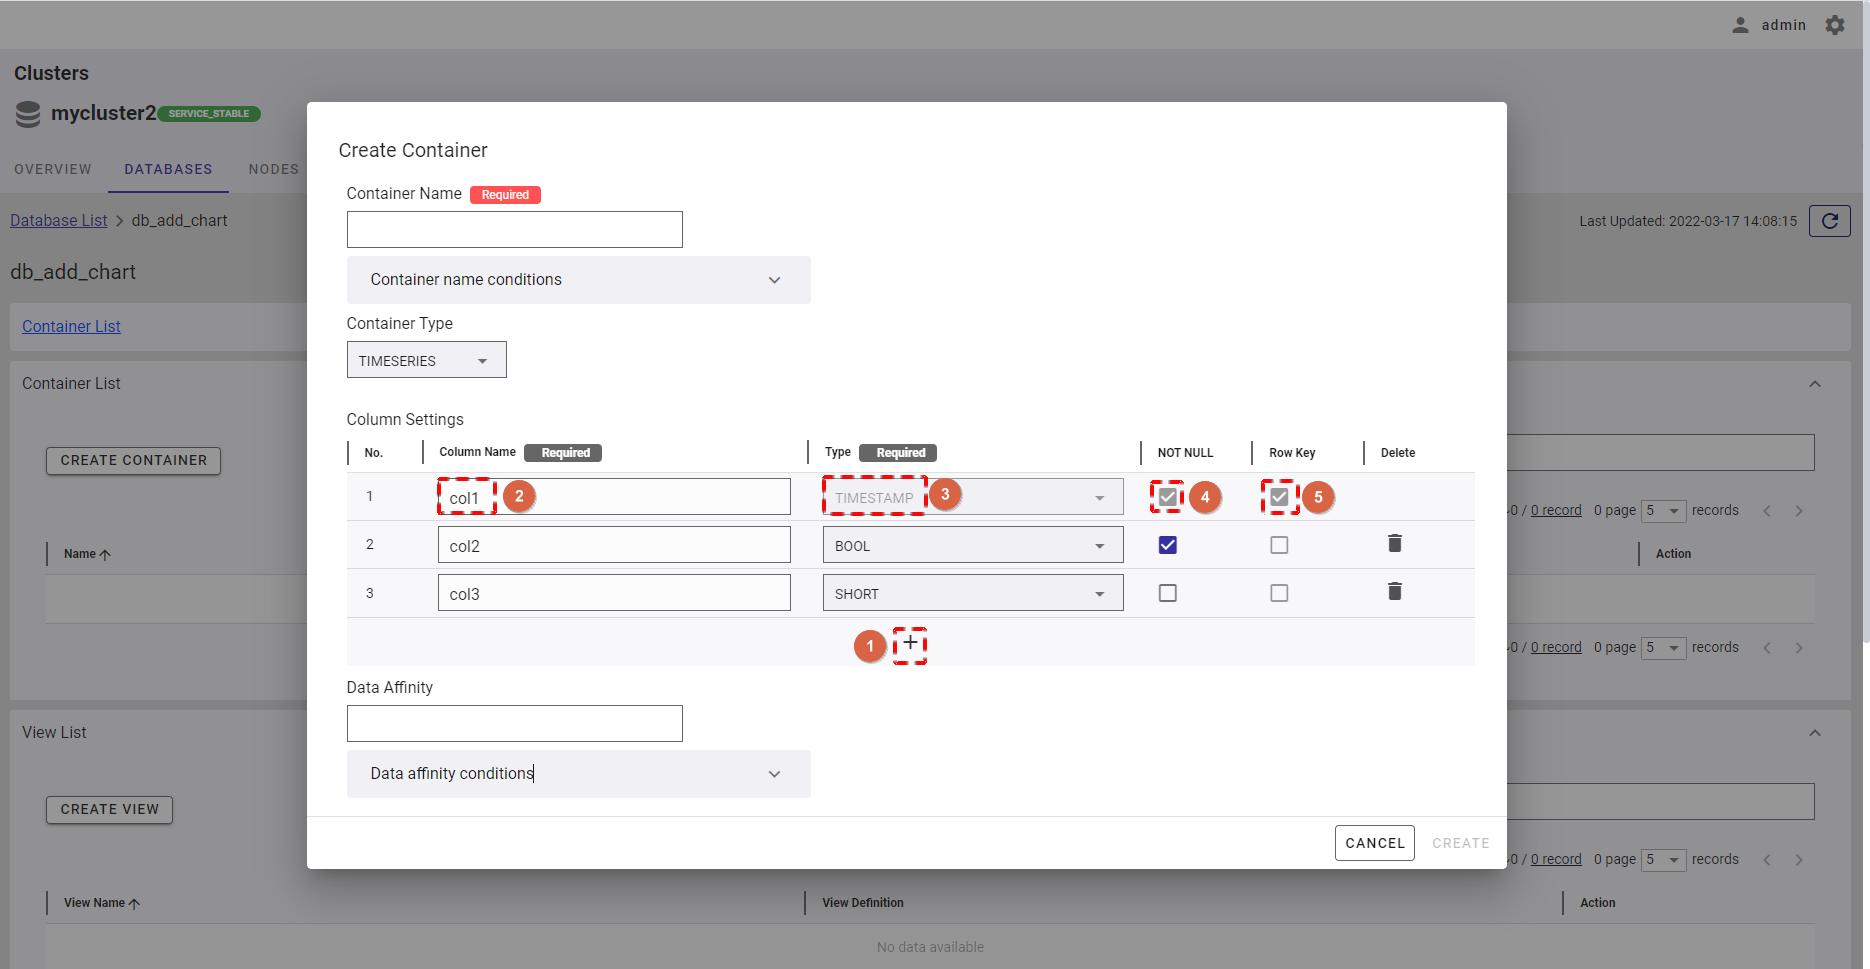
- To add a new column, click the [+] button (①).
- By default, the first column of a timeseries container is set to a TIMESTAMP type.
- You can define the name of the column by filling in the [Column Name] field (②). Choose the type of that column by clicking the type from the [Type] drop-down list (③).
- You can choose the NOT NULL constraint for the column by checking the [Not Null] checkbox (④). The value in the column with the NOT NULL constraint cannot be empty. The [Row Key] checkbox (⑤) is only available to the first column (TIMESTAMP type); other columns cannot be set as a row key.
Step 3:
- To delete the unwanted column, click the [DELETE] button (①).
- After filling in all information, click the [CREATE] button (②) to create a container.
- If you do not want to create the container, click the [CANCEL] button to close the dialog and return to the container list screen.
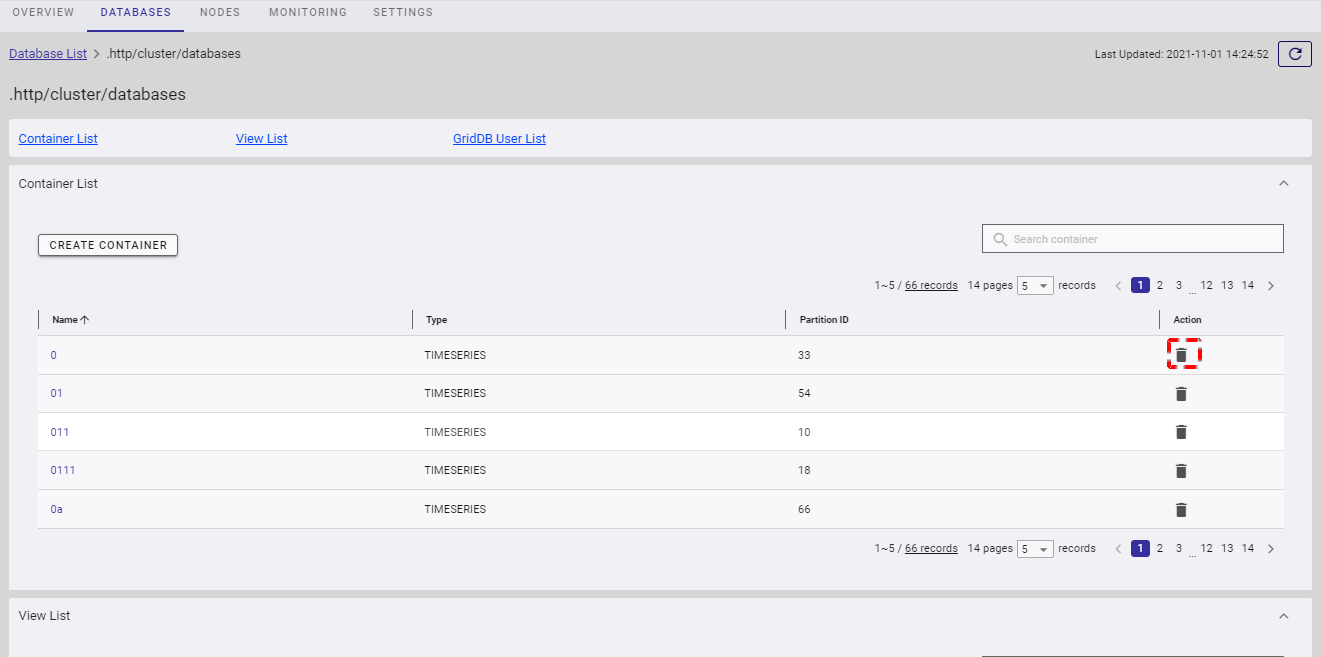
4.5.4 Deleting a container
Step 1: To delete a container, click the [DELETE] button.
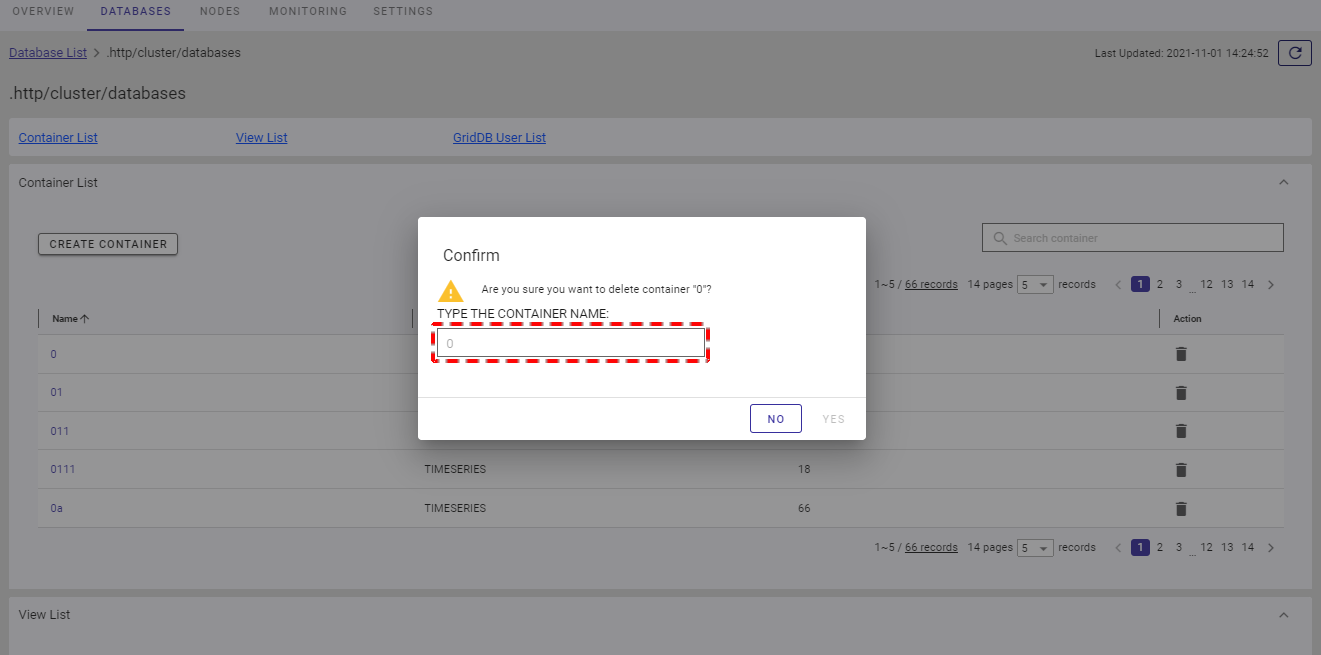
Step 2: When the confirmation dialog is displayed, enter the container name in the text field to confirm deletion.
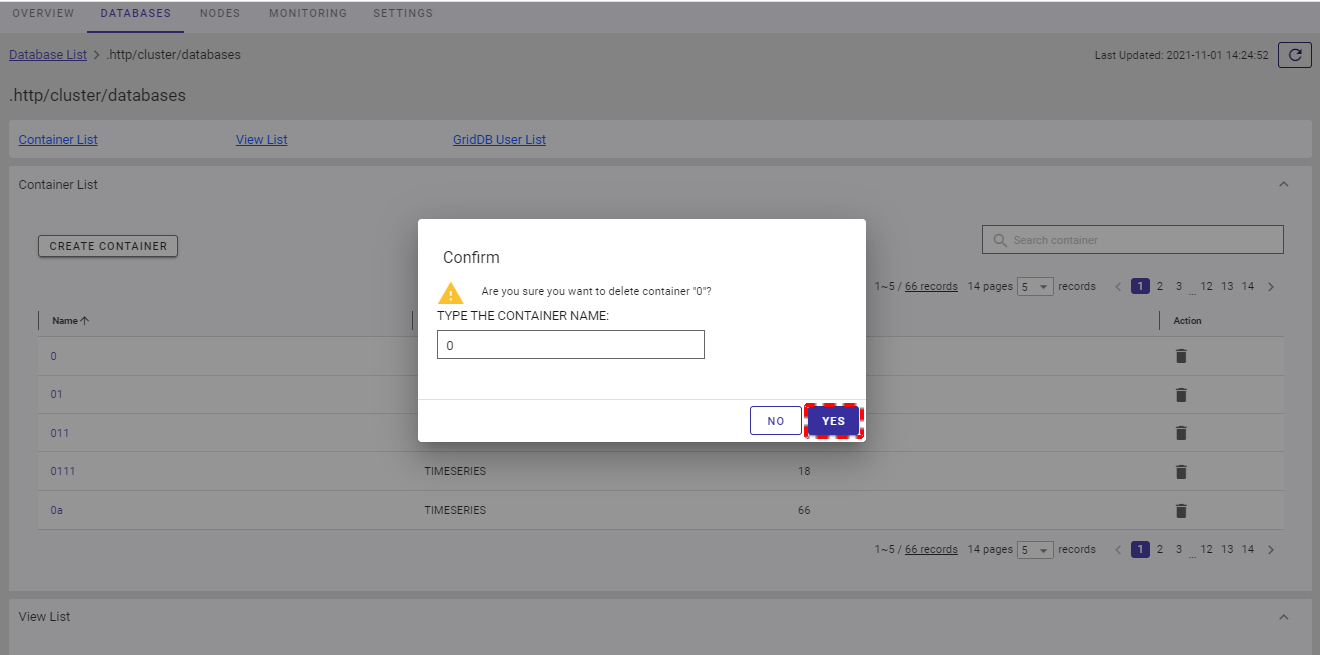
Step 3: Click the [YES] button to delete the container. If you do not want to delete the container, click the [NO] button to close the dialog and return to the container list screen.
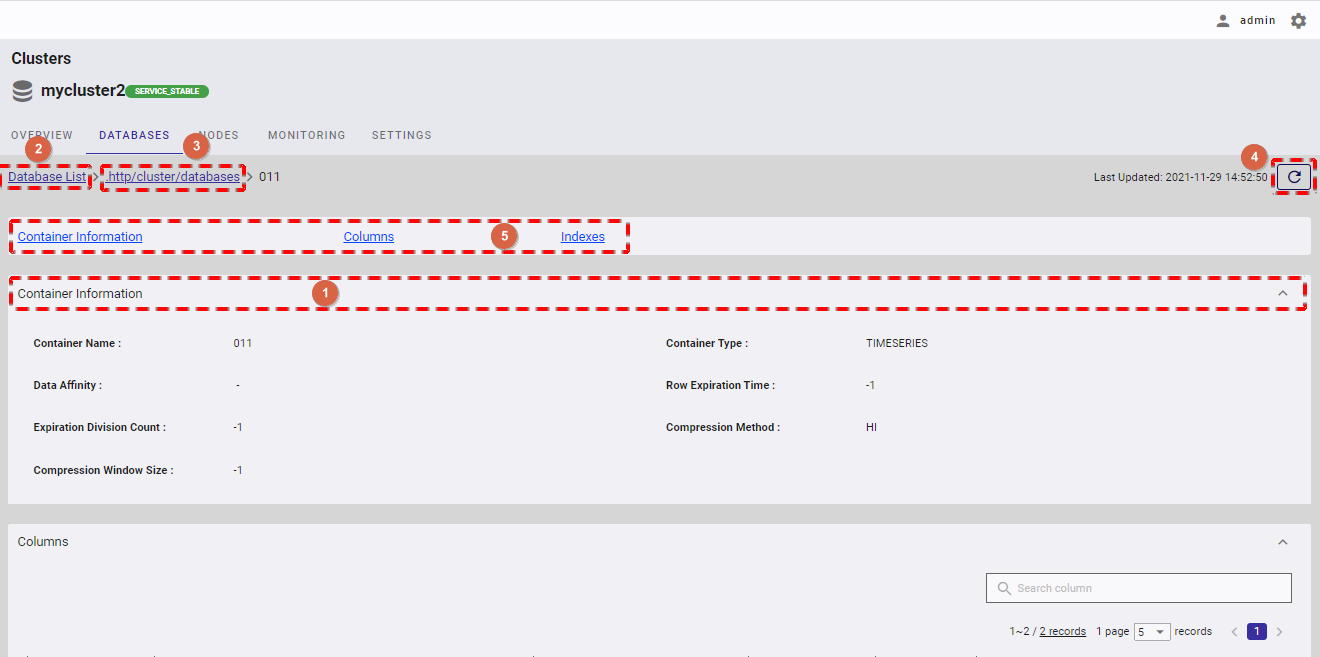
4.5.5 Displaying the details of a container
In the container list screen, click the container name that you want to see more details about.
- In the container detail screen, you can click the [Container Information] tab to show/hide the container information (①).
- If you want to go back to the database list or the database information, click the [Database List] (②) or the database name (③), respectively.
- To get the latest information about the container, click the [Refresh] button (④).
- You can click one of the links (⑤) to go to the desired tab.
4.5.5.1 Displaying a column list
To view the column list, click the [COLUMNS] tab (①) to show/hide the column list.
- To view the details of the specific column, type the column name in the [Search column] search bar (⑥).
- You can choose the number of columns displayed on one page by selecting the number from [5, 10, 15, All] (②) at the top or bottom of the page. Click the [Next] button (④) or the [Back] button (③), or click the page number (⑤) to view another page.
- You can order the list of columns by number, by name, by type, by constraint, or by row key, by clicking the header (⑦) of each column.
- You can adjust the column size by dragging and dropping the vertical bar "|" on the header.
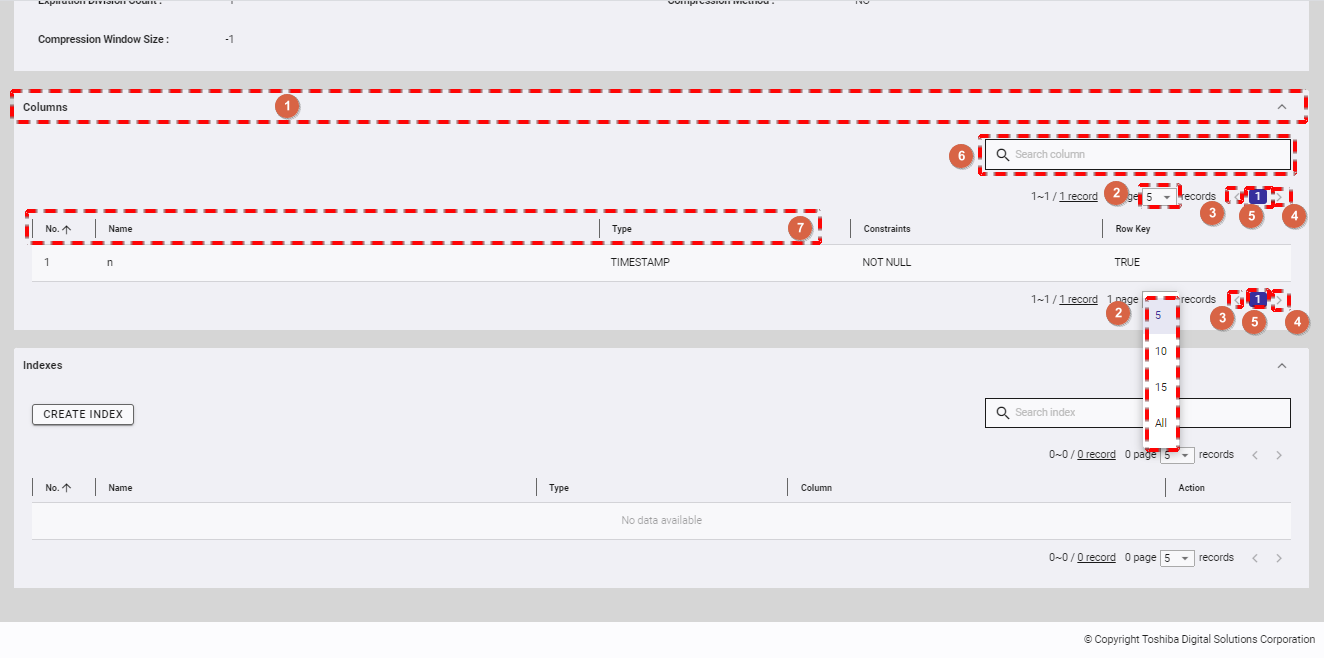
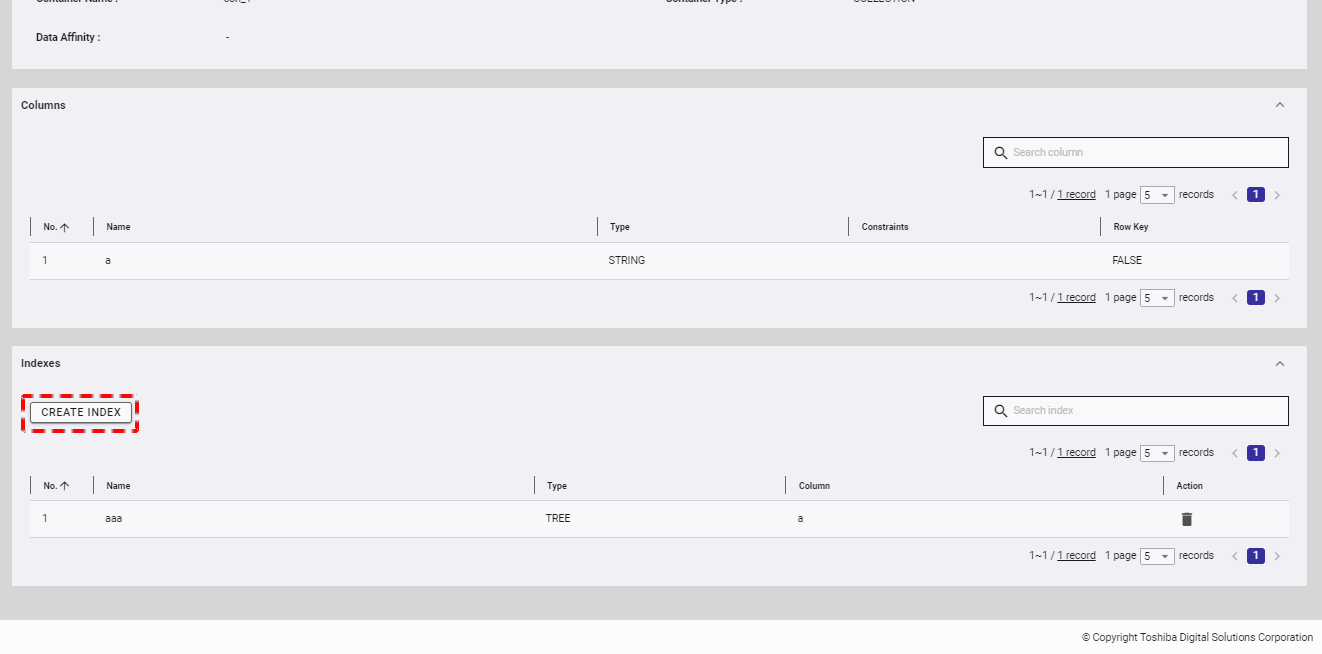
4.5.5.2 Displaying an index list
To view the index list, click the [INDEXES] tab (①) to show/hide the index list.
- To view the details of the specific index, type the index name in the [Search index] search bar (⑥).
- You can choose the number of indexes displayed on one page by selecting the number from [5, 10, 15, All] (②) at the top or bottom of the page. Click the [Next] button (④) or the [Back] button (③), or click the page number (⑤) to view another page.
- You can order the list of indexes by number, by name, by type, or by column, by clicking the header (⑦) of each column.
- You can adjust the column size by dragging and dropping the vertical bar "|" on the header.
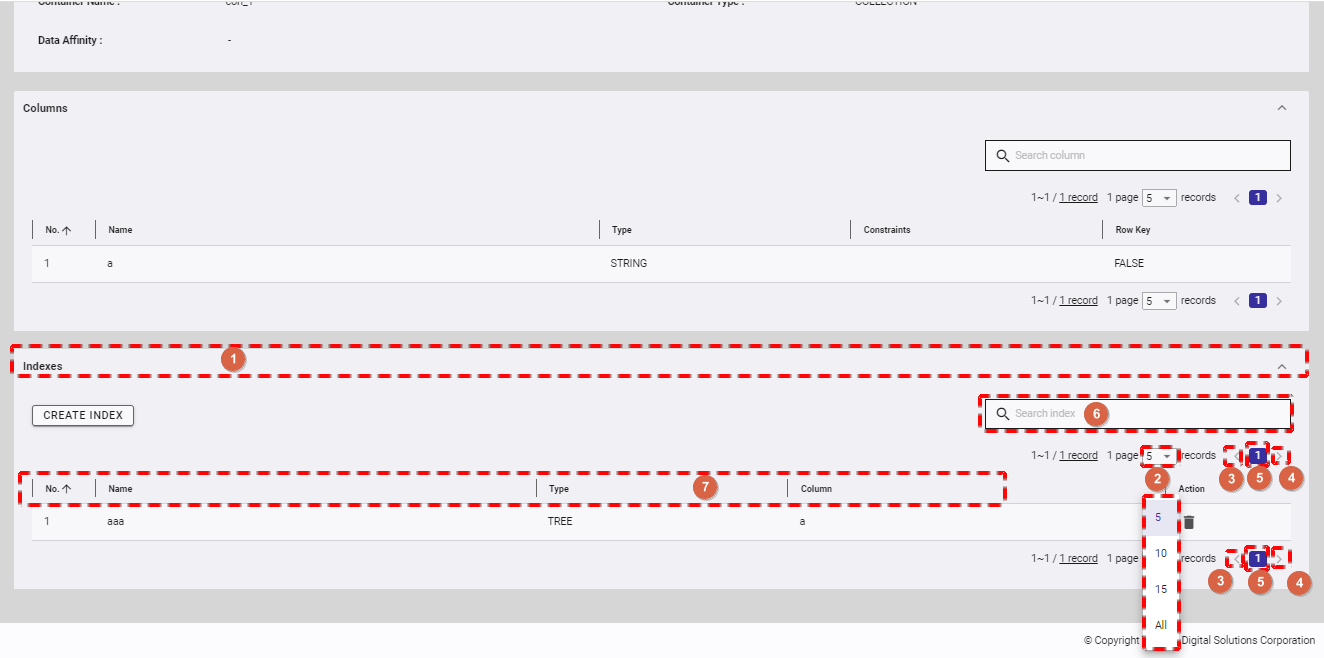
4.5.5.3 Creating an index
A condition-based search can be processed quickly by creating an index for the columns of a container.
There are three types of the index - hash index (HASH), tree index (TREE), and space index (SPATIAL). A hash index is used in an equivalent-value search. A tree index is used for executing an equivalent-value search and making comparisons, such as comparing the range (same or bigger, same or smaller, etc.).
The index that can be set differs depending on the container (table) type and column data type:
- HASH INDEX: Columns of the following data types can be set in a collection: STRING, BOOL, BYTE, SHORT, INTEGER, LONG, FLOAT, DOUBLE, and TIMESTAMP. A hash index cannot be set in a timeseries container.
- TREE INDEX: This can be used for columns of the following data type in any type of container (table), except for columns corresponding to a row key in a timeseries container (timeseries table): STRING, BOOL, BYTE, SHORT, INTEGER, LONG, FLOAT, DOUBLE, TIMESTAMP.
- SPATIAL INDEX: A spatial index can be used for only GEOMETRY columns in a collection. This index is specified when conducting a spatial search at a high speed.
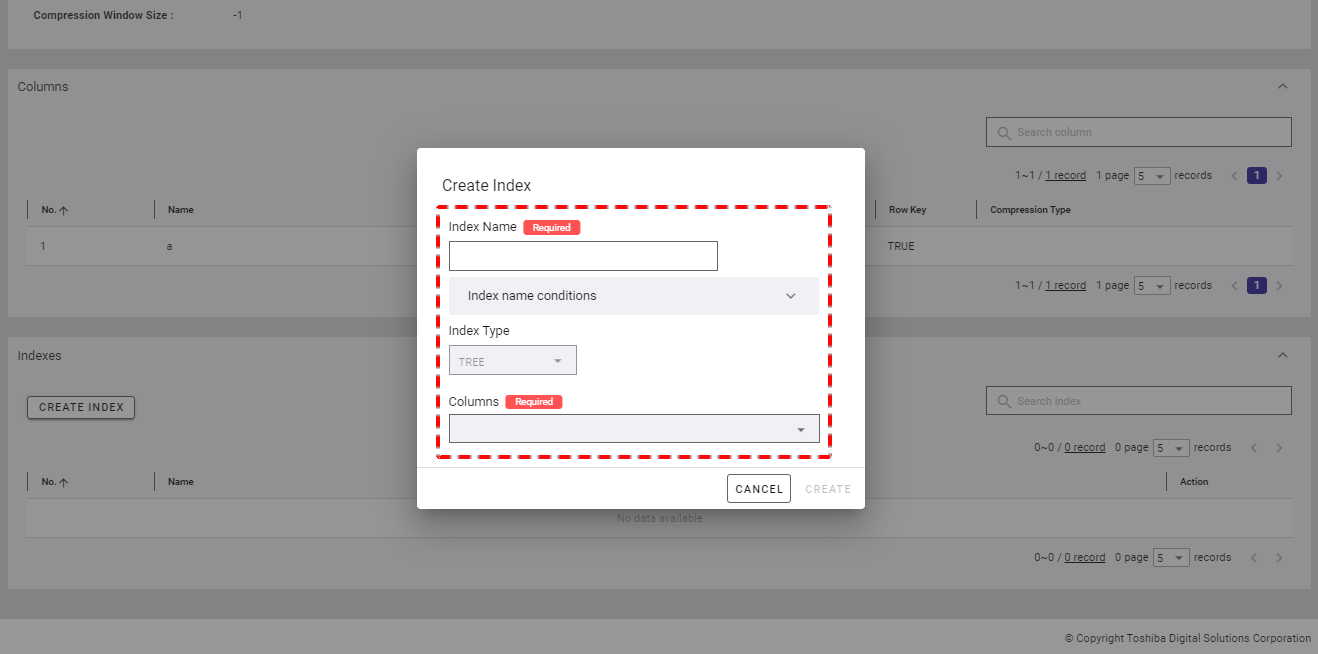
Step 1: To create an index, click the [CREATE INDEX] button.
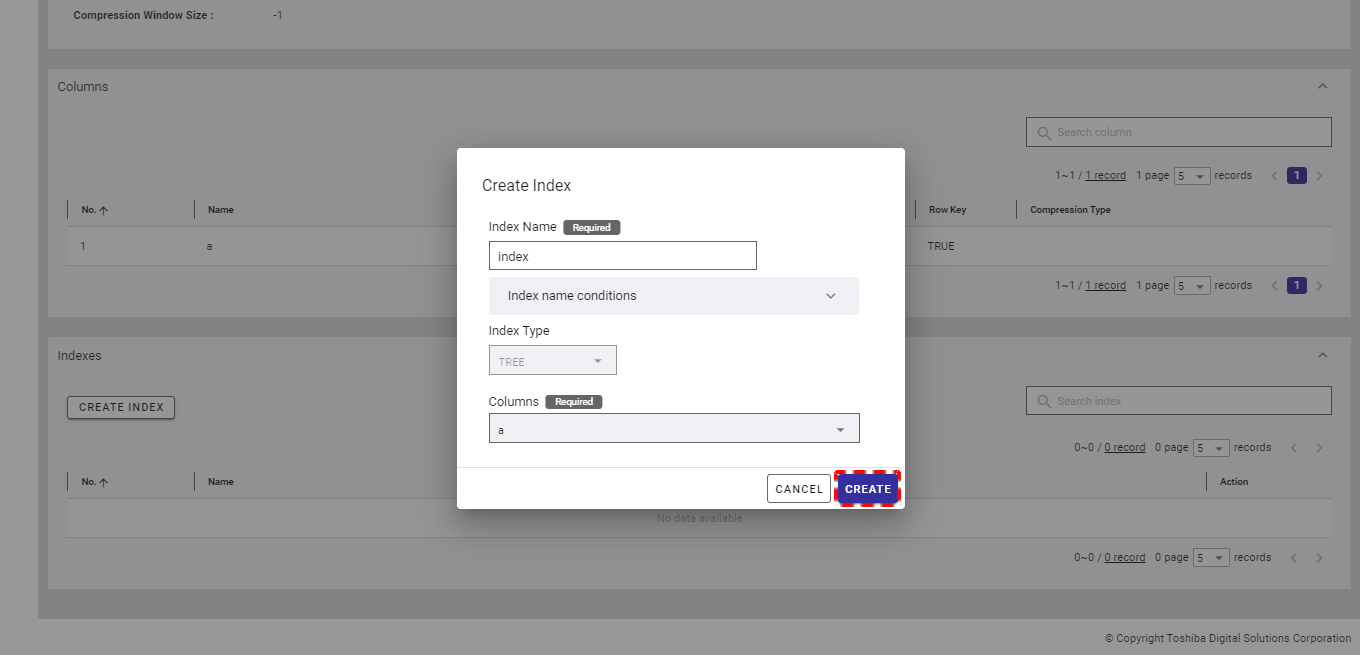
Step 2: When the Create Index dialog is displayed, type the index name in the [Index Name] field, choose one of the three index types (TREE, HASH, or SPATIAL), and select the column for which you want to create an index.
- For a timeseries container, you can only choose the TREE type for an index.
- If you choose the TREE type, you can select multiple columns.
Step 3: After defining all information, click the [CREATE] button to create a new index. If you do not want to create an index, click the [CANCEL] button to close the dialog and return to the index list screen.
4.5.5.4 Deleting an index
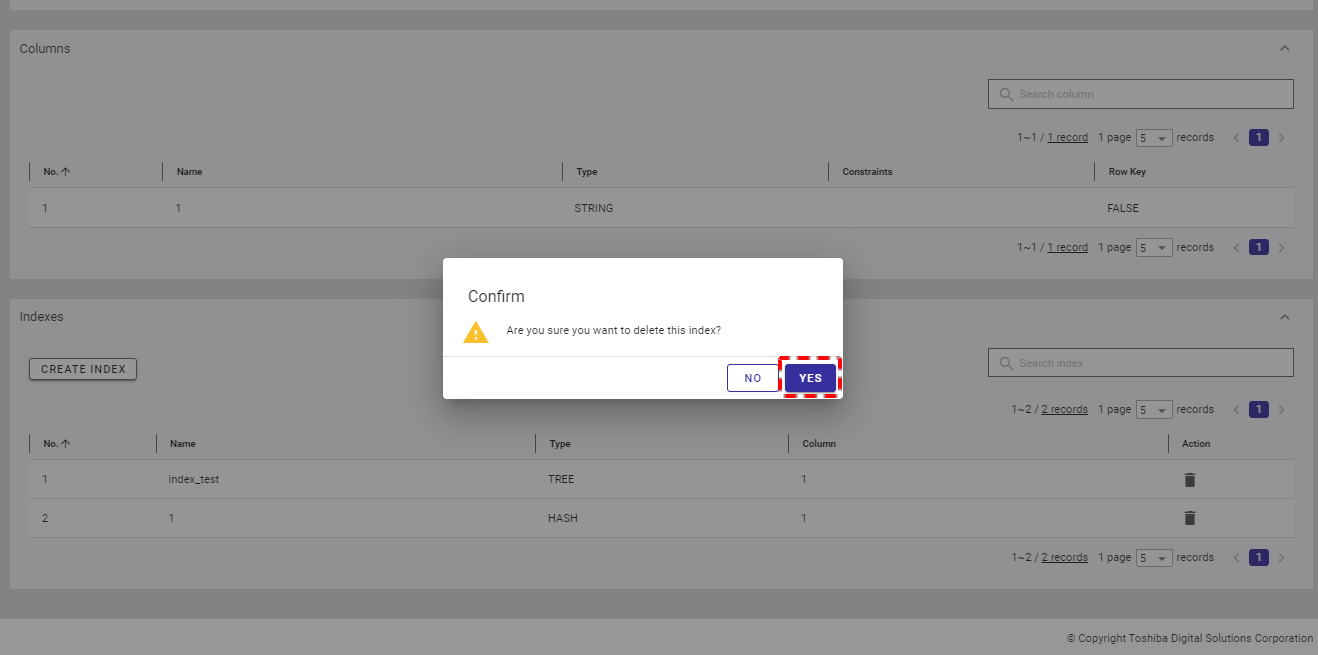
Step 1: To delete an unwanted index, click the [DELETE] button.
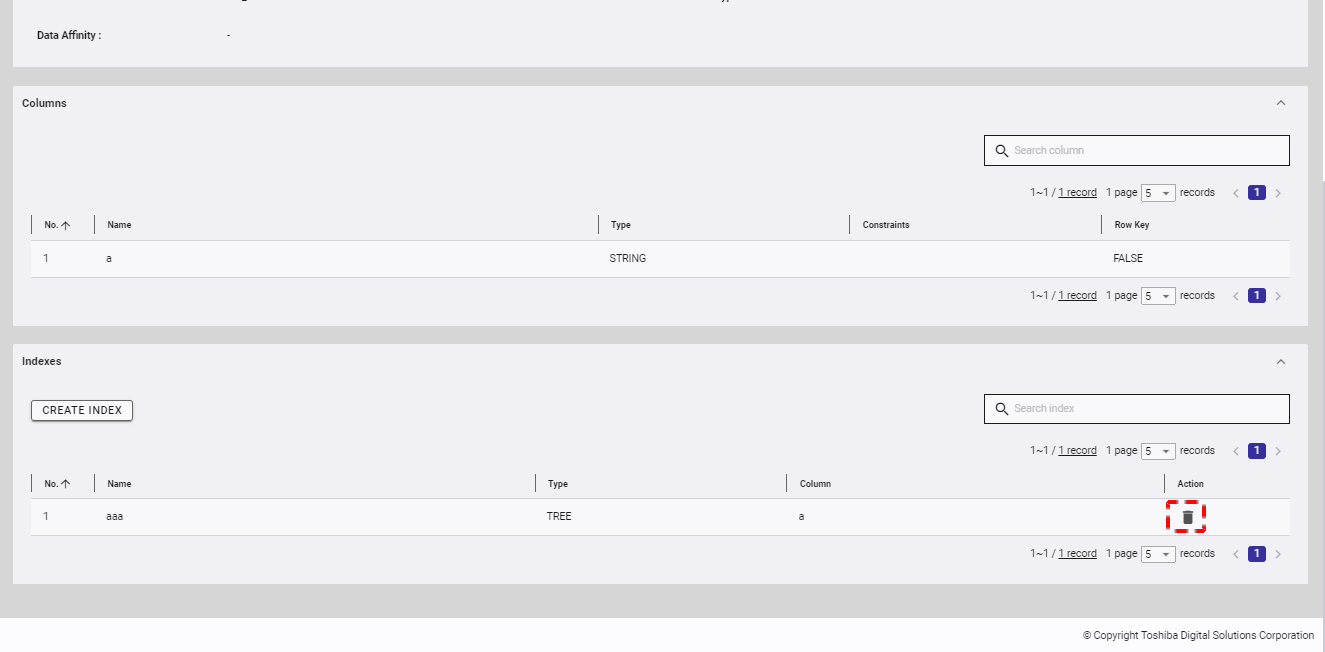
Step 2: When the confirmation dialog is displayed, click the [YES] button to delete the index. If you do not want to delete the index, click the [NO] button to close the dialog and return to the index list screen.
4.6 View management function
This function is used for various view operations of the database, such as creating or deleting a view and displaying the view details.
Views are virtual tables, so they can define a table without using extra storage. They can also accelerate data analysis and provide extra security for your data. Views display only selected data.
Select the item [Clusters] (①) from the left menu and select the [DATABASES] tab (②) to display the database screen. Then, click the database name (③) to see the database details. In this screen, click the [VIEW] tab to display the view list of this database.
4.6.1 Available roles
In the table below, the role with a plus sign (+) can use the function on the left.
| No. | Function | General user | Administrator user |
|---|---|---|---|
| 1 | Display a view list | + | + |
| 2 | Create a view | + | + |
| 3 | Delete a view | + | + |
4.6.2 Displaying a view list
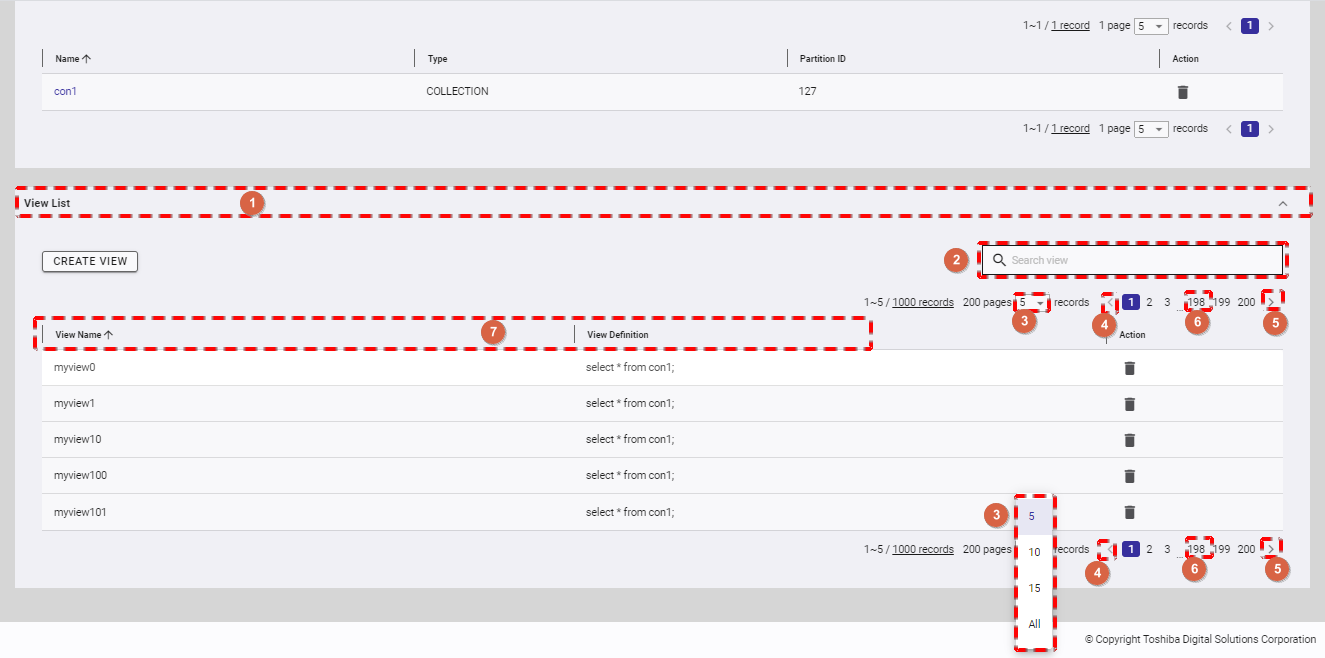
In the database information screen, click the [VIEW] tab (①) to show/hide the view list.
- If you want to search for a specific view, type the view name in the search bar (②) and press the enter key.
- You can choose the number of views displayed on one page by selecting the number from [5, 10, 15, All] (③) at the top or bottom of the page. Click the [Next] button (⑤) or the [Back] button (④), or click the page number (⑥) to view another page.
- You can order the list of views by name or by definition, by clicking the header (⑦) of each column.
- You can adjust the column size by dragging and dropping the vertical bar "|" on the header.
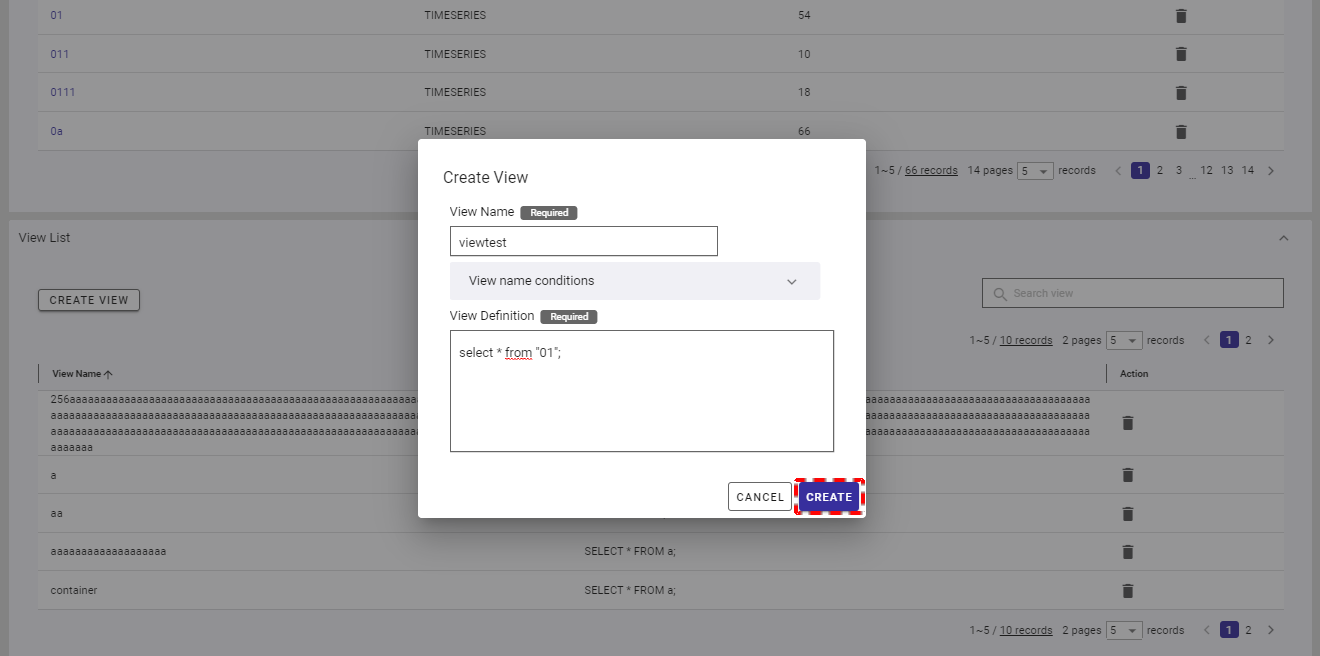
4.6.3 Creating a view
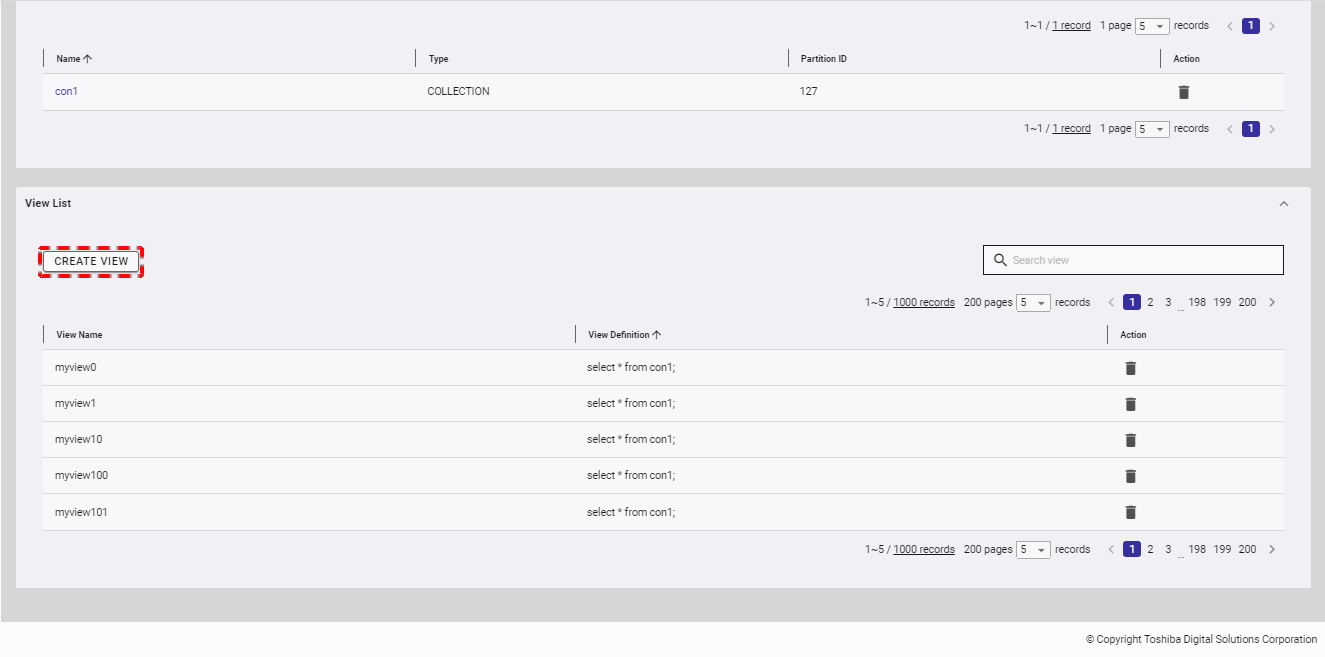
Step 1: To create a new view, click the [CREATE VIEW] button.
Step 2: When the Create View dialog is displayed, type the view name in the [View Name] field and define this view in the [View Definition] field. You can click the [View name conditions] tab to show/hide the conditions for the name of a new view.
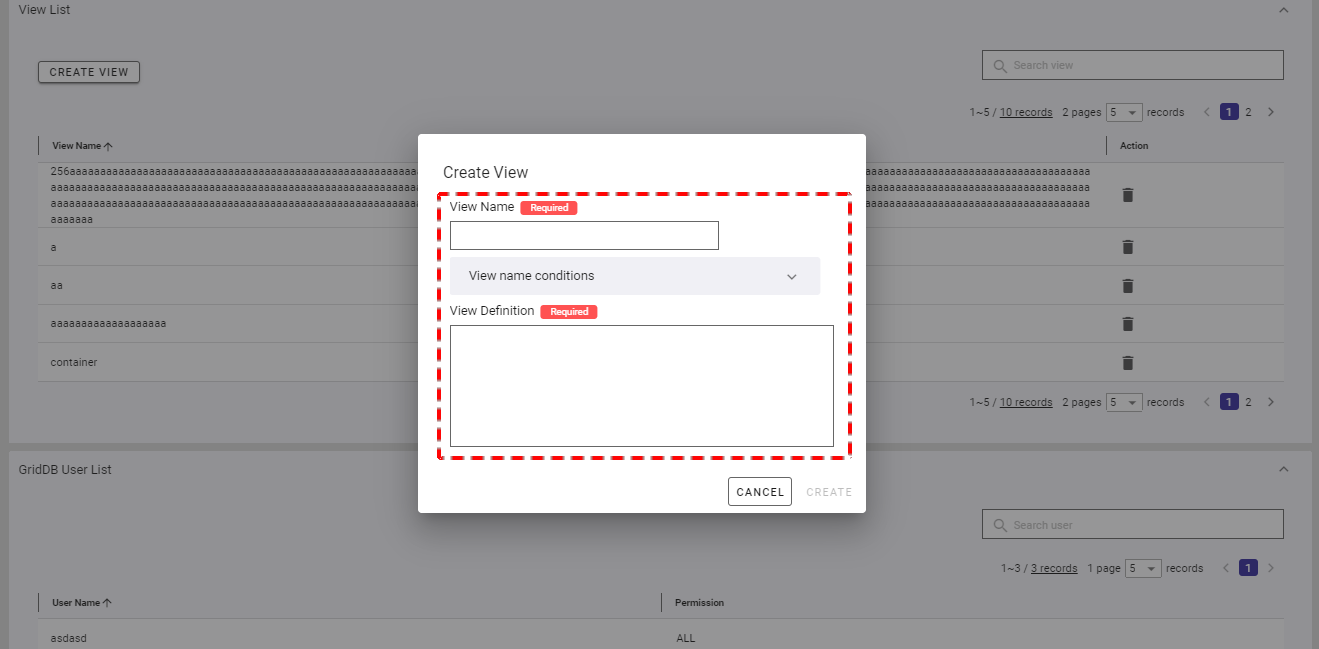
Step 3: Click the [CREATE] button to create a view. If you do not want to create a new view, click the [CANCEL] button to close the dialog and return to the view list screen.
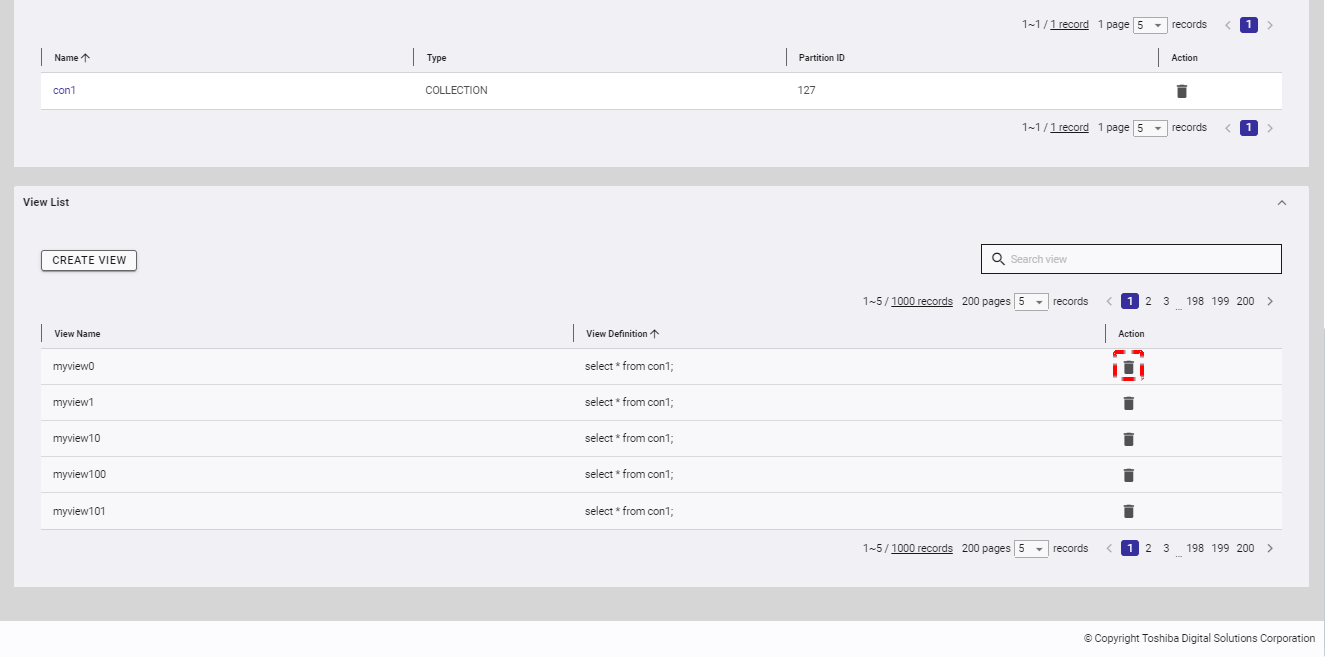
4.6.4 Deleting a view
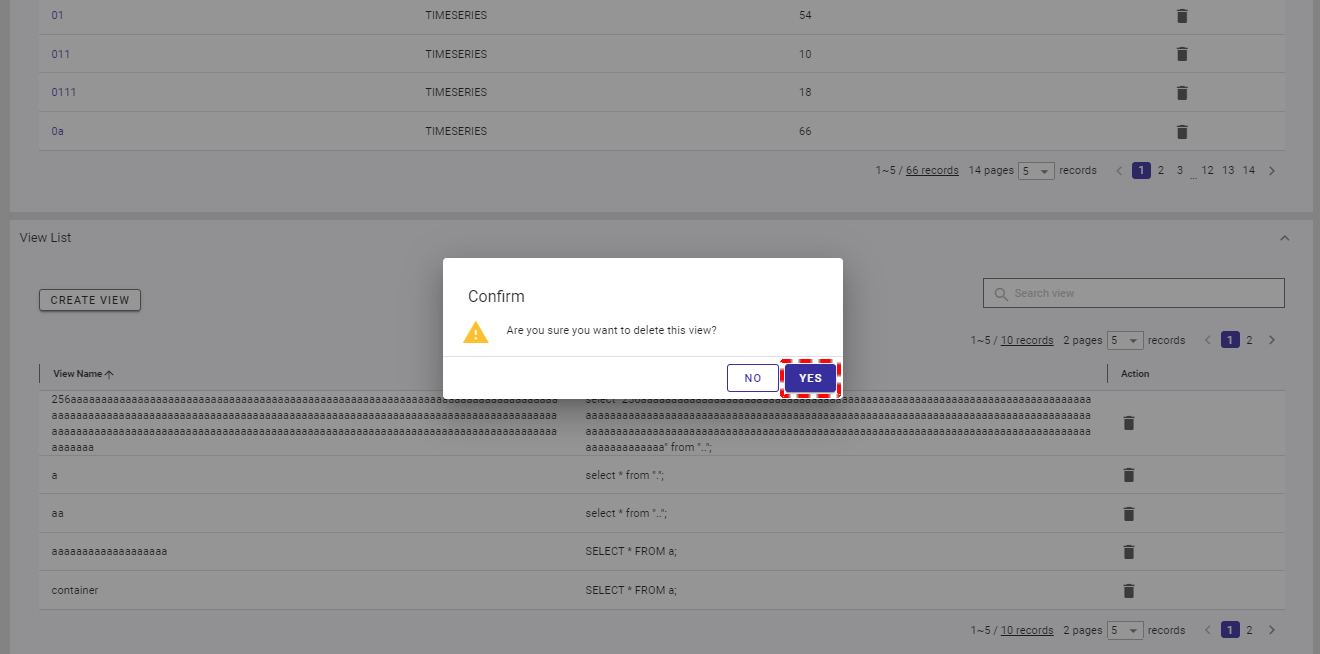
Step 1: To delete an unwanted view, click the [DELETE] button.
Step 2: When the confirmation dialog is displayed, click the [YES] button to delete the view. If you do not want to delete the view, click the [NO] button to close the dialog and return to the view list screen.
4.7 Node management function
This function is used for various operations of a node, including viewing a node list and node details and exporting historical node information.
4.7.1 Available roles
In the table below, the role with a plus sign (+) can use the function on the left.
| No. | Function | General user | Administrator user |
|---|---|---|---|
| 1 | Display a node list | + | + |
| 2 | Display node details | + | + |
| 3 | Export historical node information | + | + |
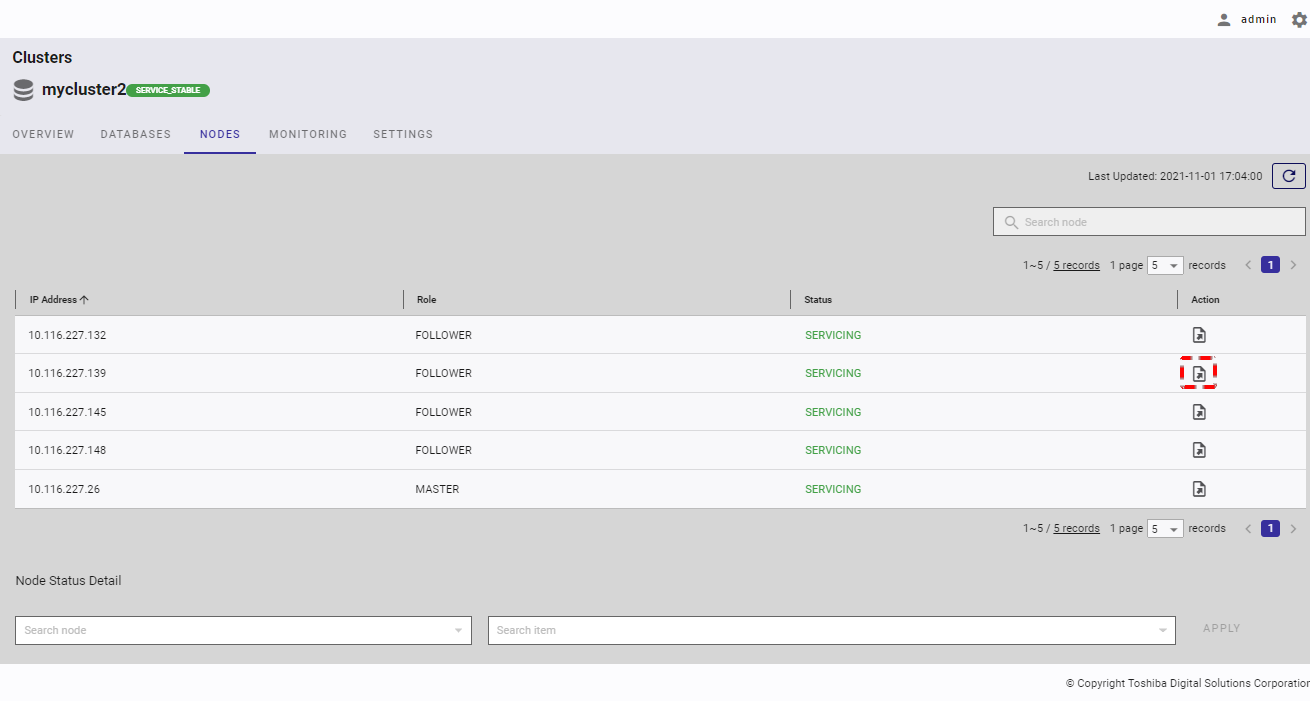
4.7.2 Displaying a node list
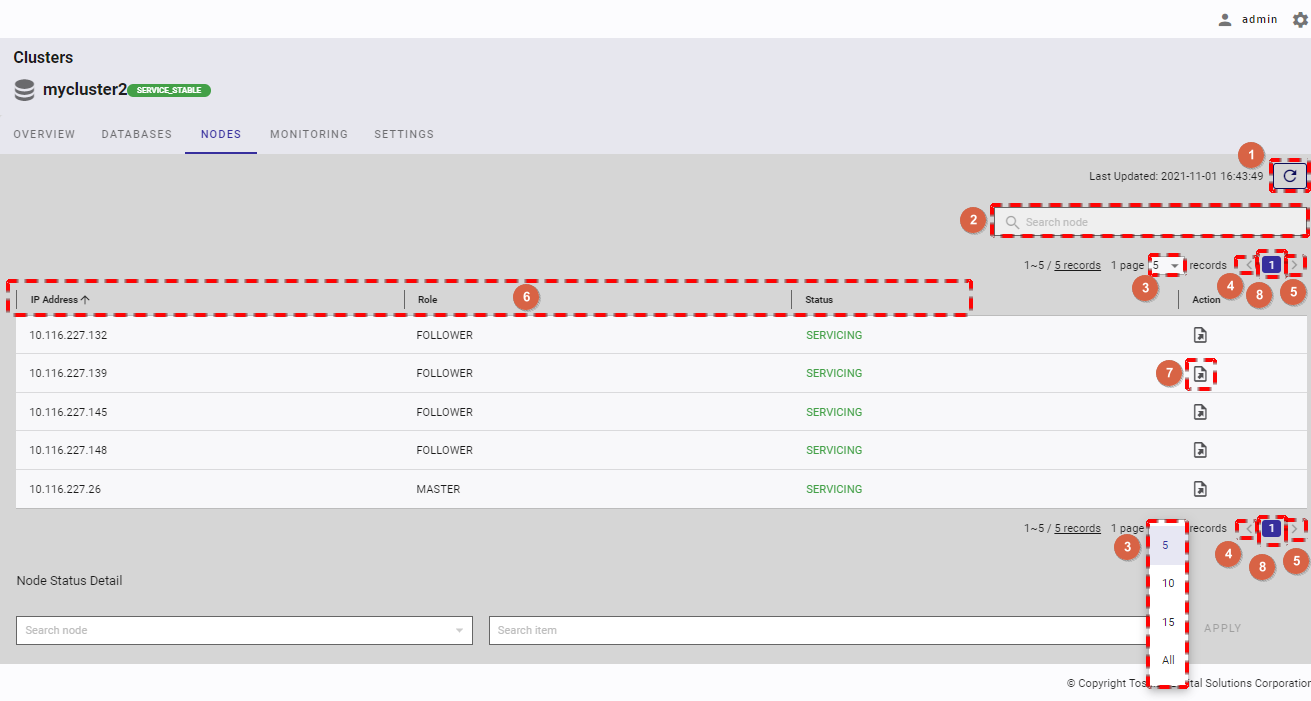
To see the node list, select the item [Clusters] (①) from the left menu. Then select the [NODES] tab (②) to display the node list screen.
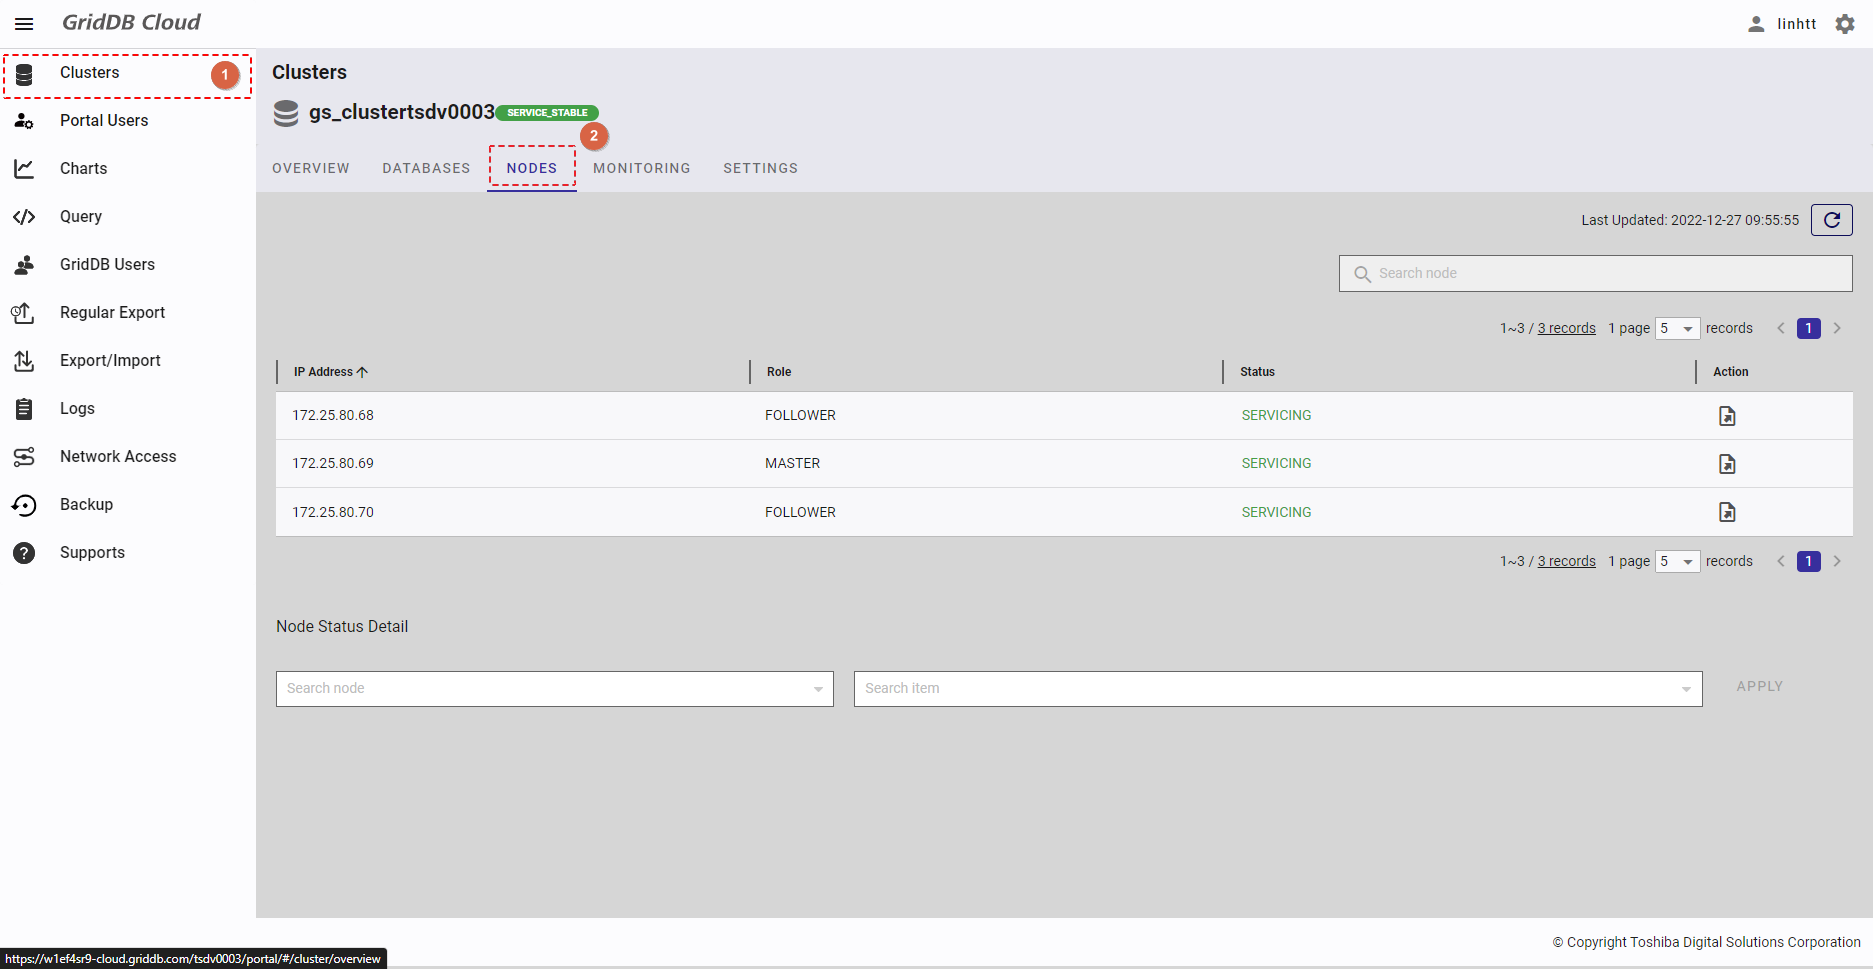
- You can choose the number of nodes displayed on one page by selecting the number from [5, 10, 15, All] (③) at the top or bottom of the page. Click the [Next] button (⑤) or the [Back] button (④), or click the page number (⑧) to view another page.
- To search for a specific node, type the information about this node (IP address, role, or status) in the search bar (②).
- To refresh the node list and get the latest information about the node list, click the [Refresh] button (①).
- You can order the list of nodes by IP address, by role, or by status, by clicking the header (⑥) of each column.
- You can export the historical information about a node by clicking the [Export historical OS resource information] button (⑦).
- You can adjust the column size by dragging and dropping the vertical bar "|" on the header.
- There are six different node statuses as described in table below:
| Node status | Condition |
|---|---|
| SERVICING | A node has joined a cluster whose status is "SERVICE_STABLE" or "SERVICE_UNSTABLE". |
| WAIT | A node has joined a cluster whose status is "WAIT" or "INIT_WAIT". |
| STARTED | A node is started but has not joined a cluster. |
| STARTING | A node is in the process of starting. |
| STOPPING | A node is in the process of stopping. |
| STOPPED | A node is stopped. |
4.7.3 Displaying node details
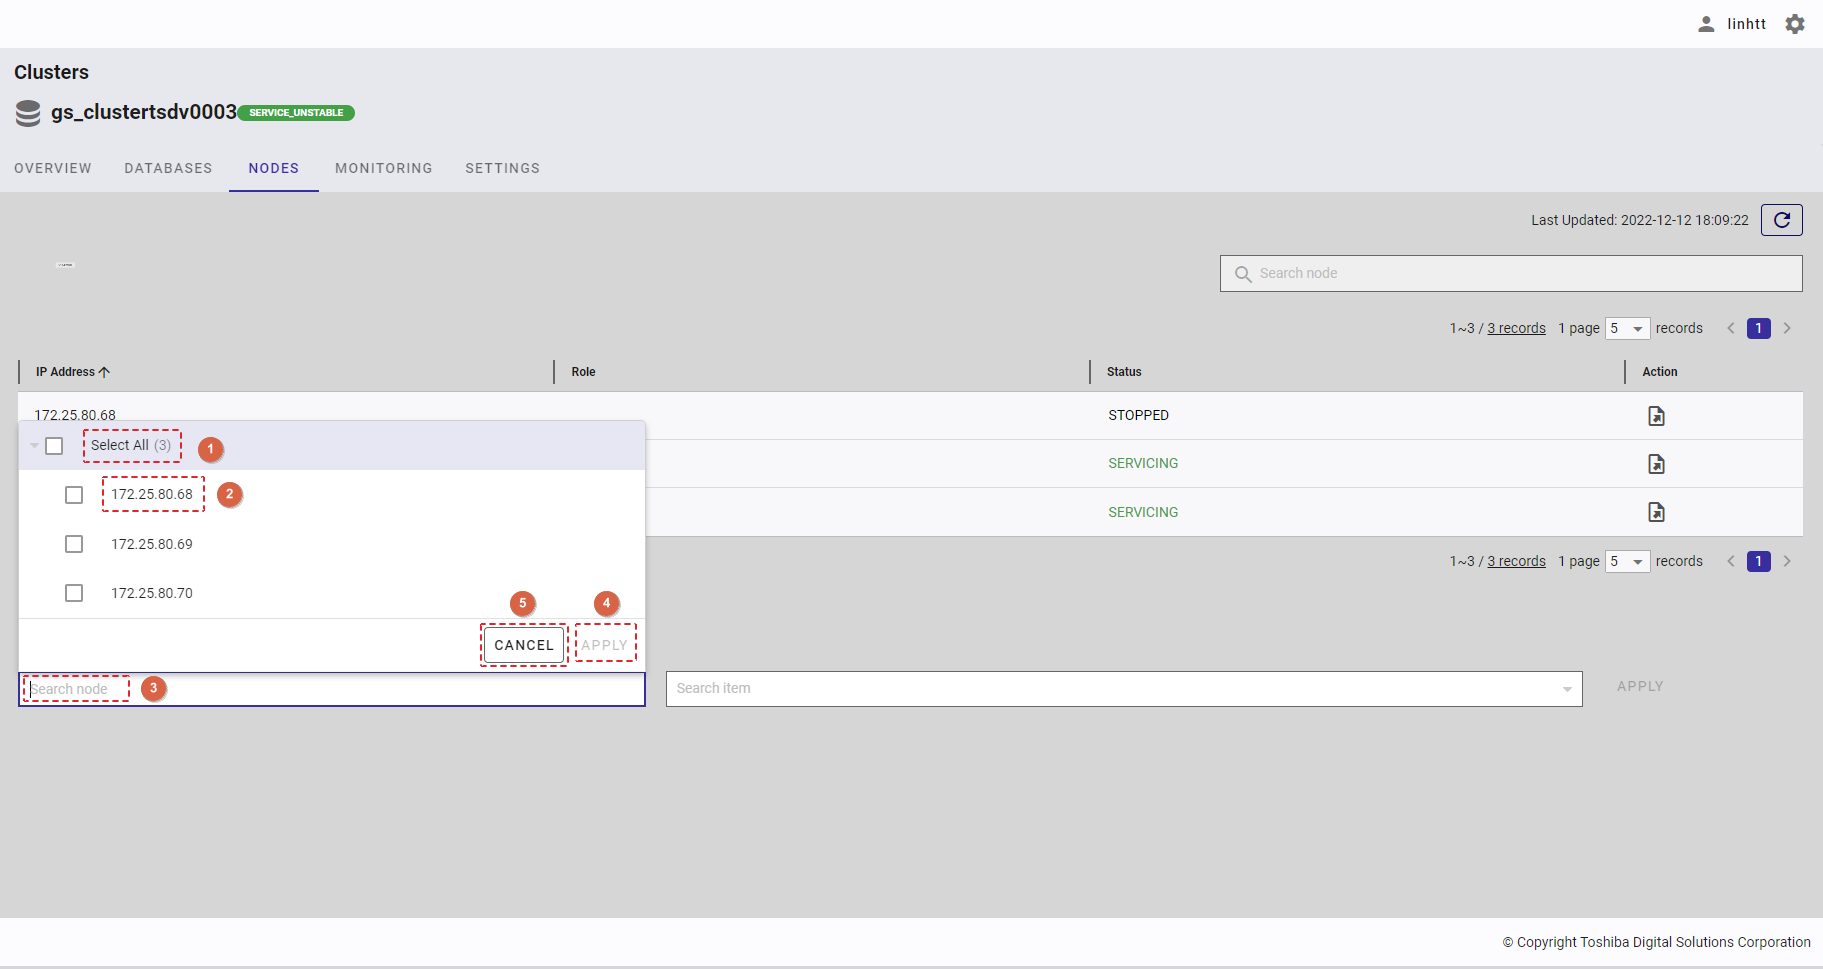
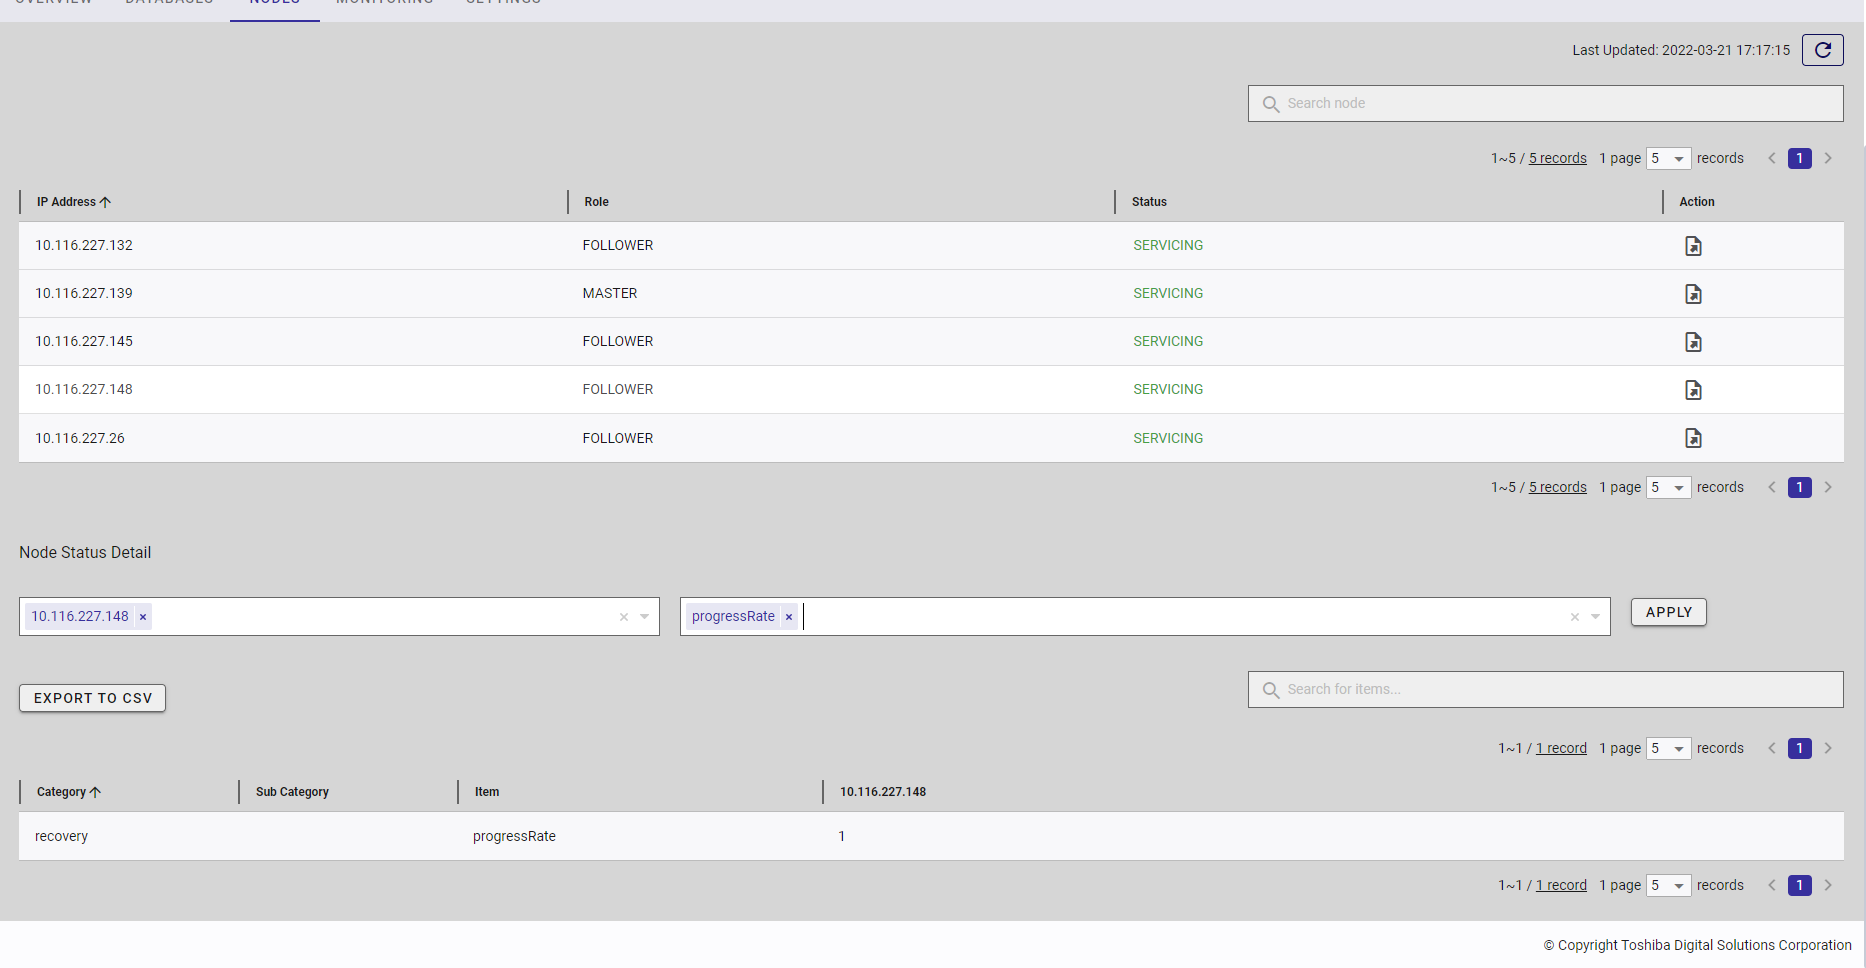
4.7.3.1 Obtaining the node status detail
Step 1: Click the drop-down button in [Search node] and select [Select All] (①) or the IP address of a node (②) in the drop-down list, or enter the IP address of the node you want to search for (③).
To save all your choices, click the [APPLY] button (④). You can also discard all the changes by clicking the [CANCEL] button (⑤).
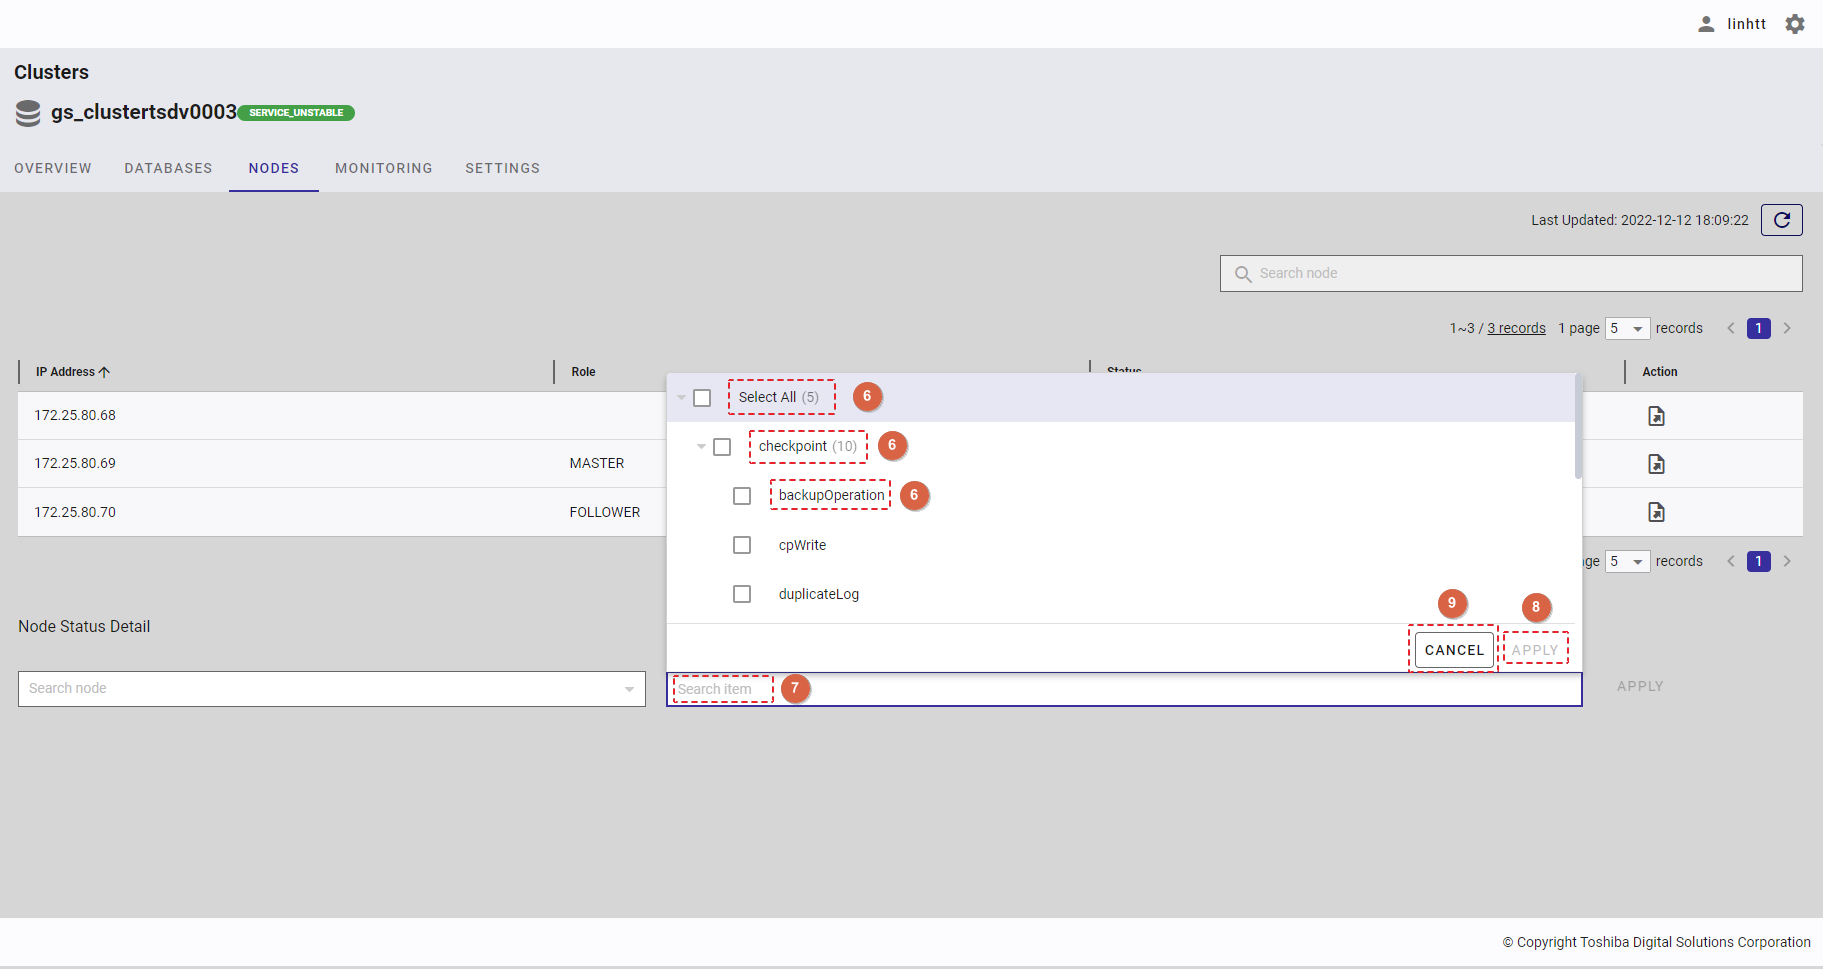
Step 2: Click the drop-down button (④) in [Search items] and select the item(s) (⑤) in the drop-down list or enter the item name you want to search for (⑥).
To save all your choices, click the [APPLY] button (⑧). You can also discard them by clicking the [CANCEL] button (⑨).
Step 3: Click the [APPLY] button (⑦) to obtain the node status detail for the node(s) selected in table format.
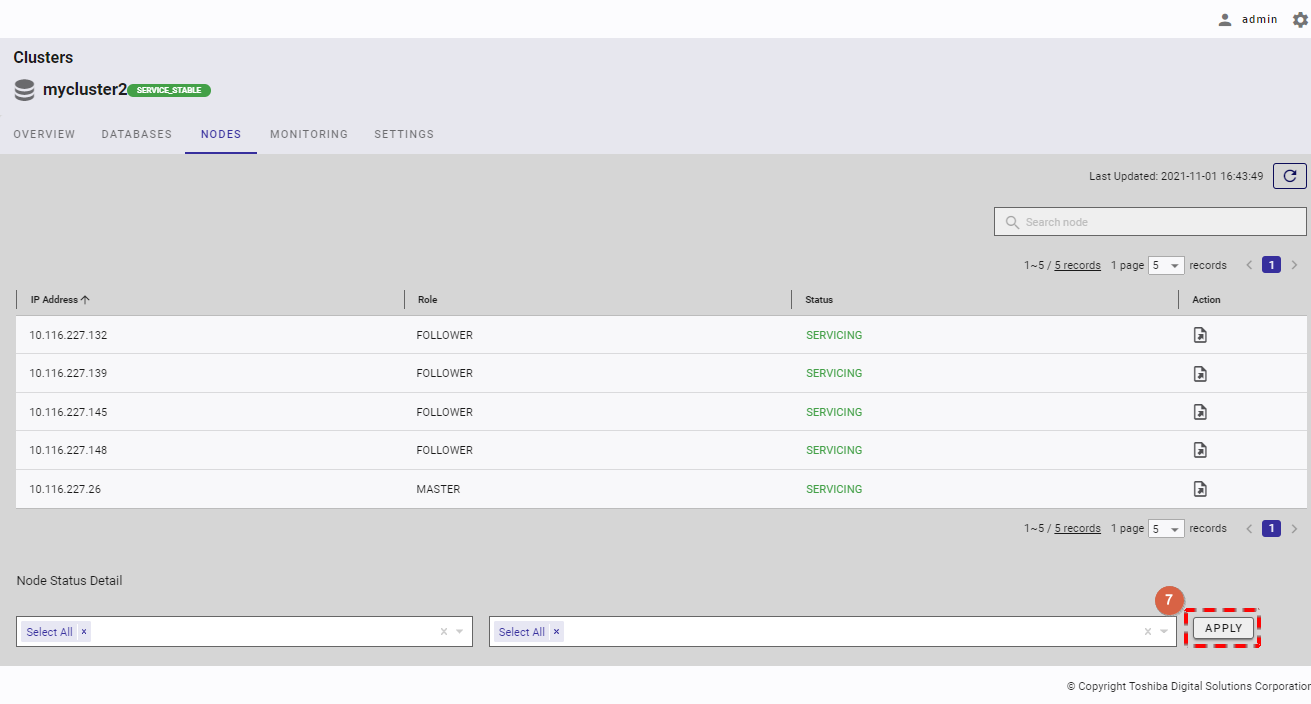
Node status detail of each selected node in table format
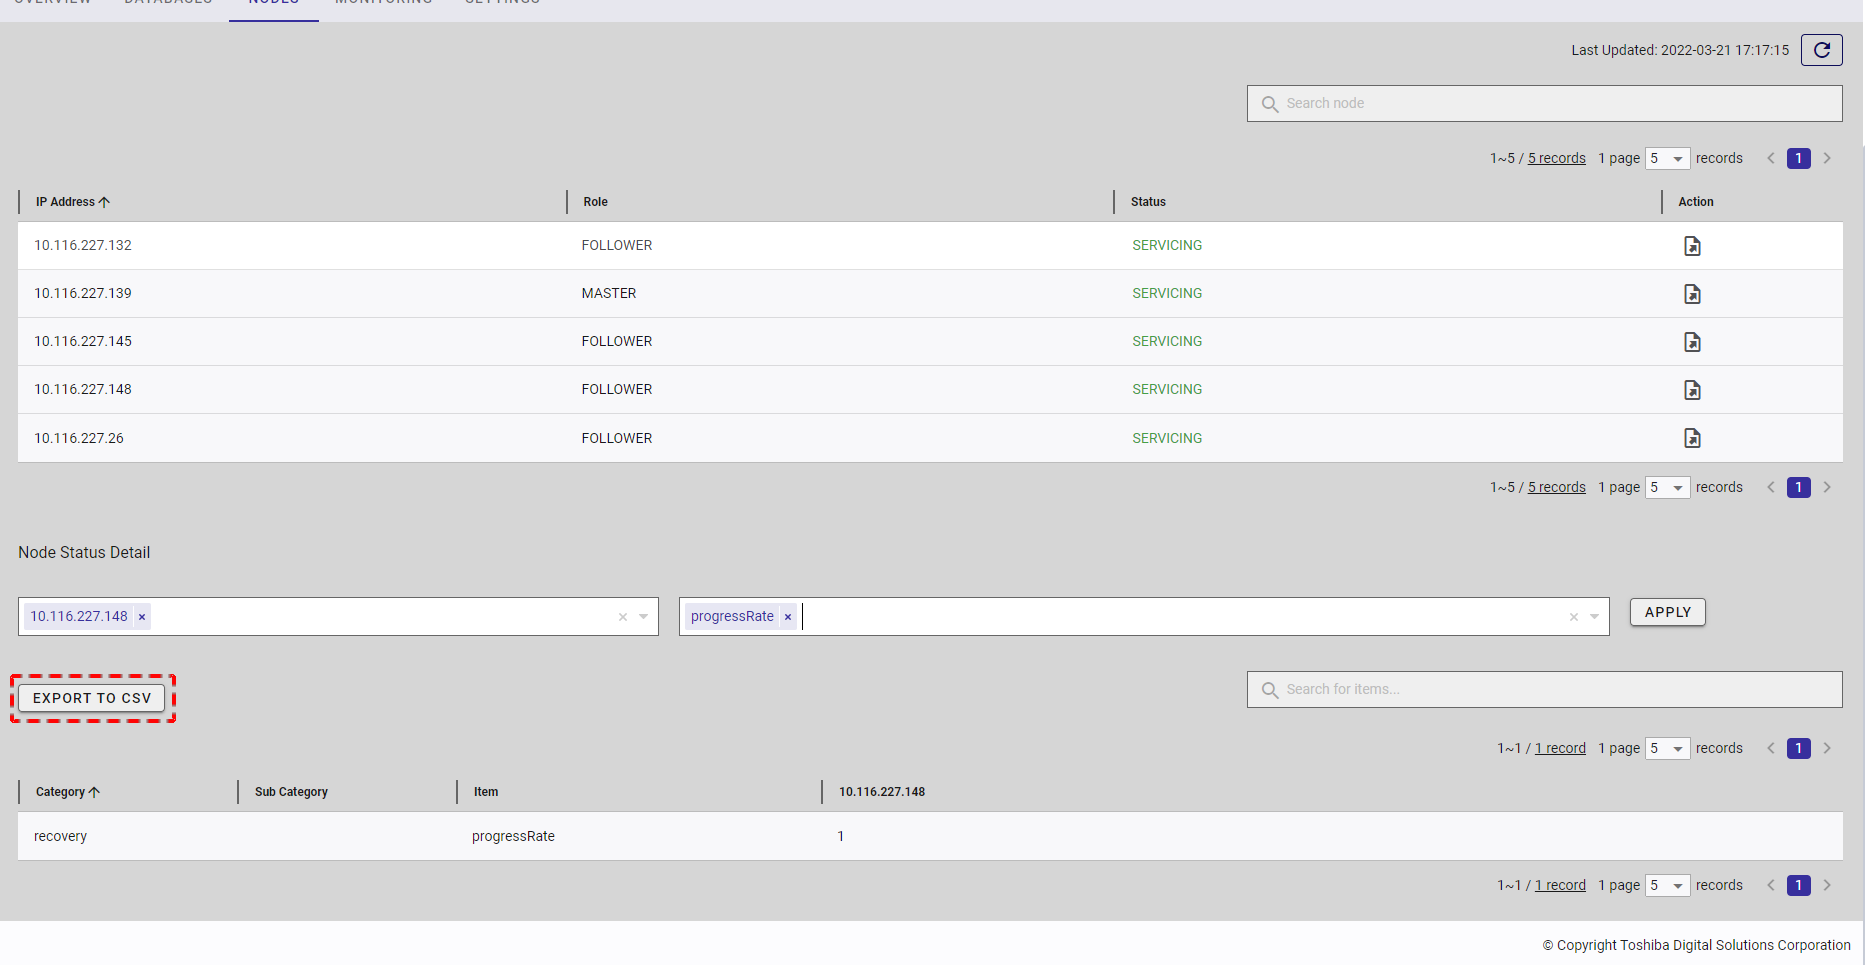
4.7.3.2 Exporting data to a CSV file
Step 1: To export data to a CSV file, click the [EXPORT TO CSV] button.
[Note]: The [EXPORT TO CSV] button is deactivated when the table above has no data.
Step 2: Once the [EXPORT TO CSV] button is clicked, a confirmation dialog will be displayed. Click the [YES] button to export data to a CSV file. If you do not want to export data to a CSV file, you can click the [NO] button to close the confirmation dialog and return to the Nodes screen without exporting data to a CSV file.
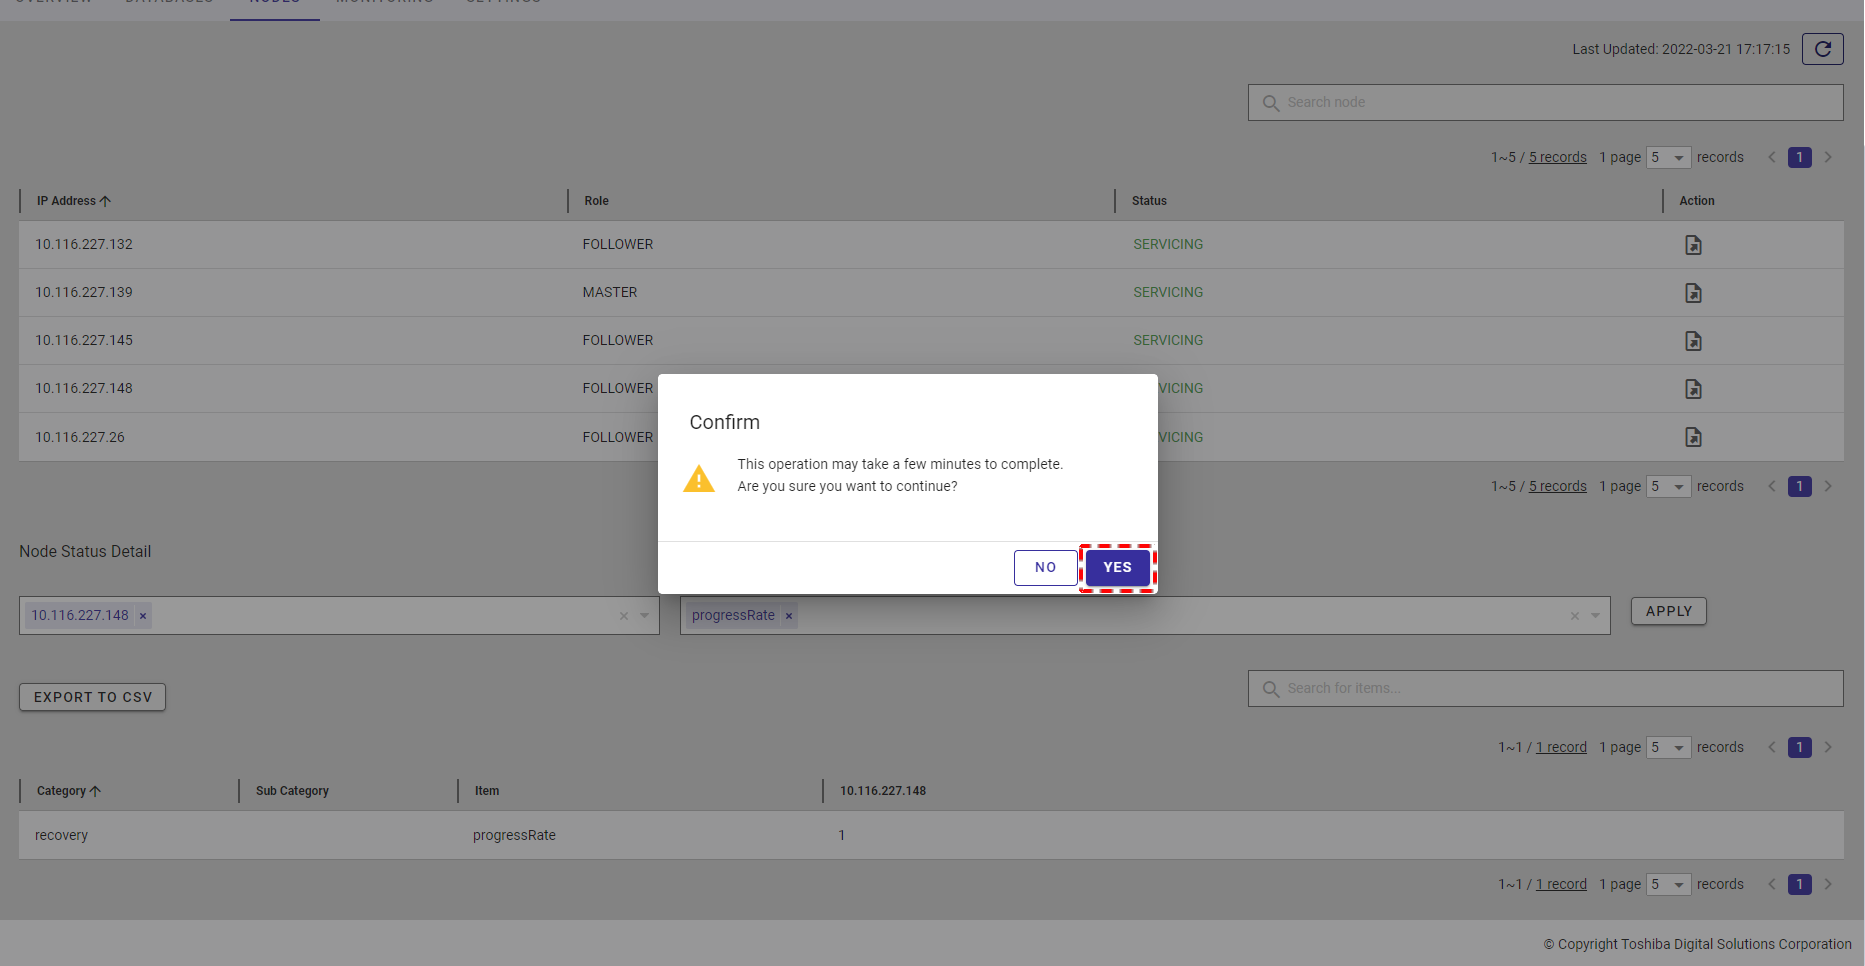
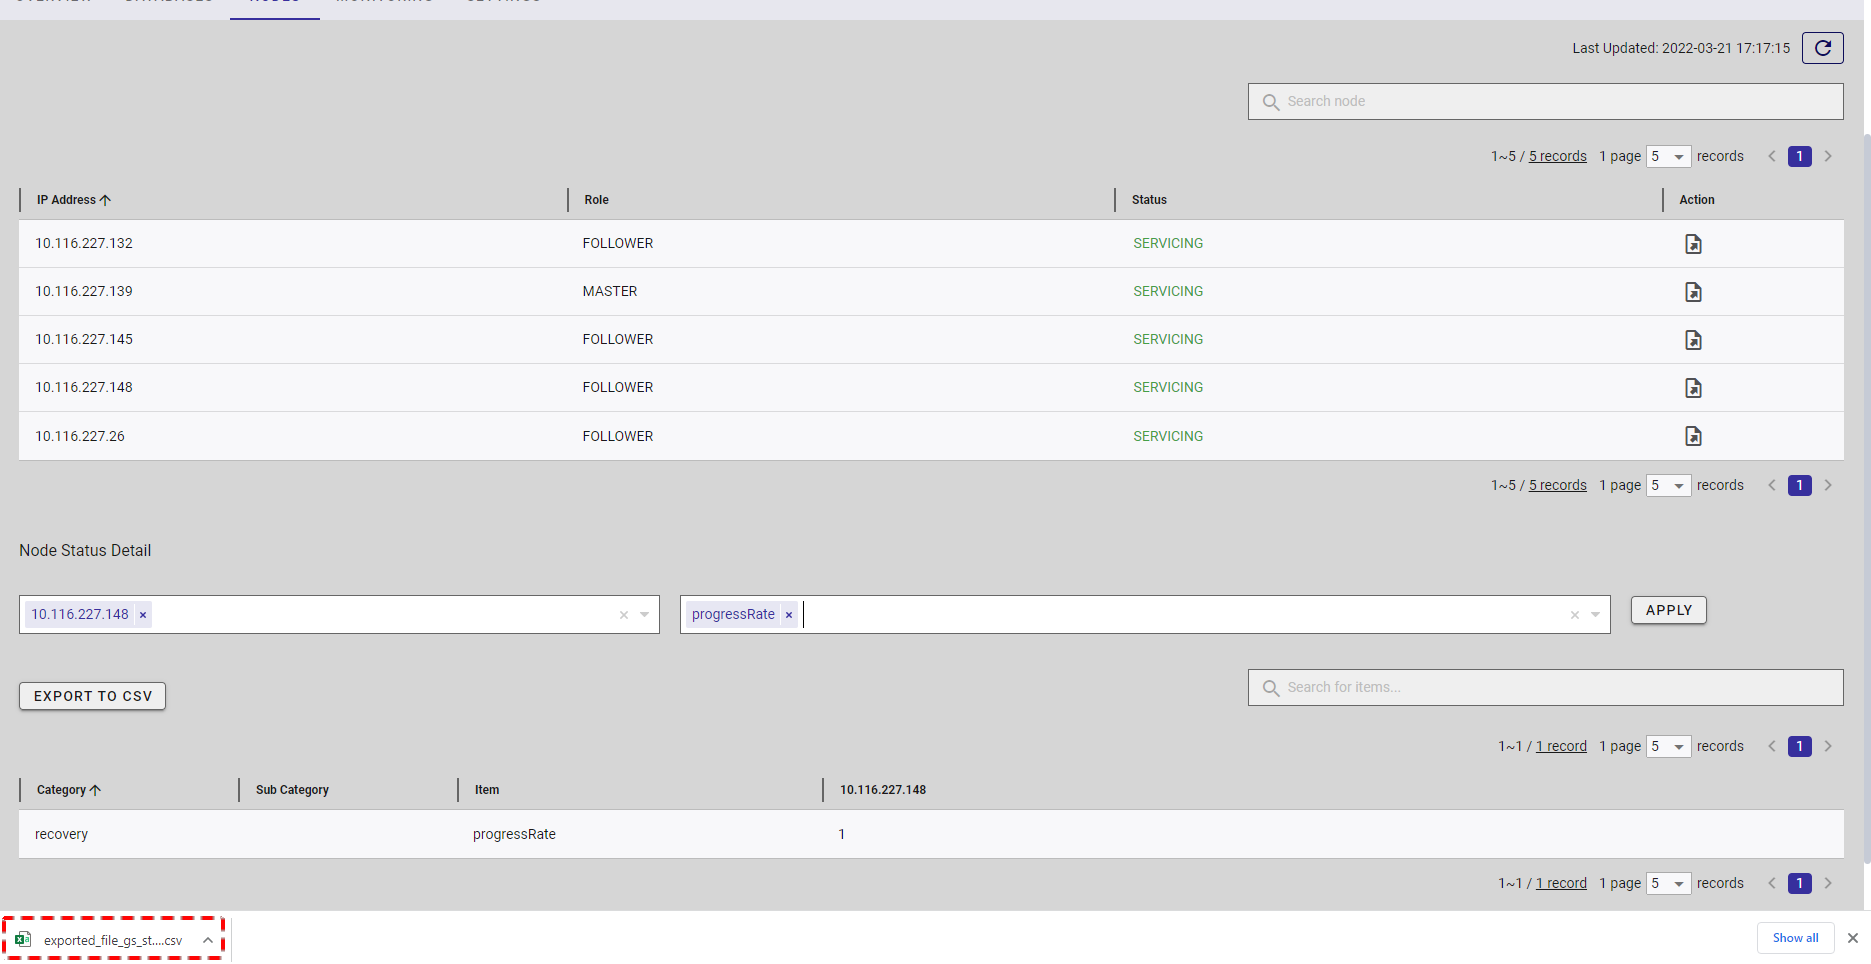
The exported data will be downloaded directly by your browser as a CSV file.
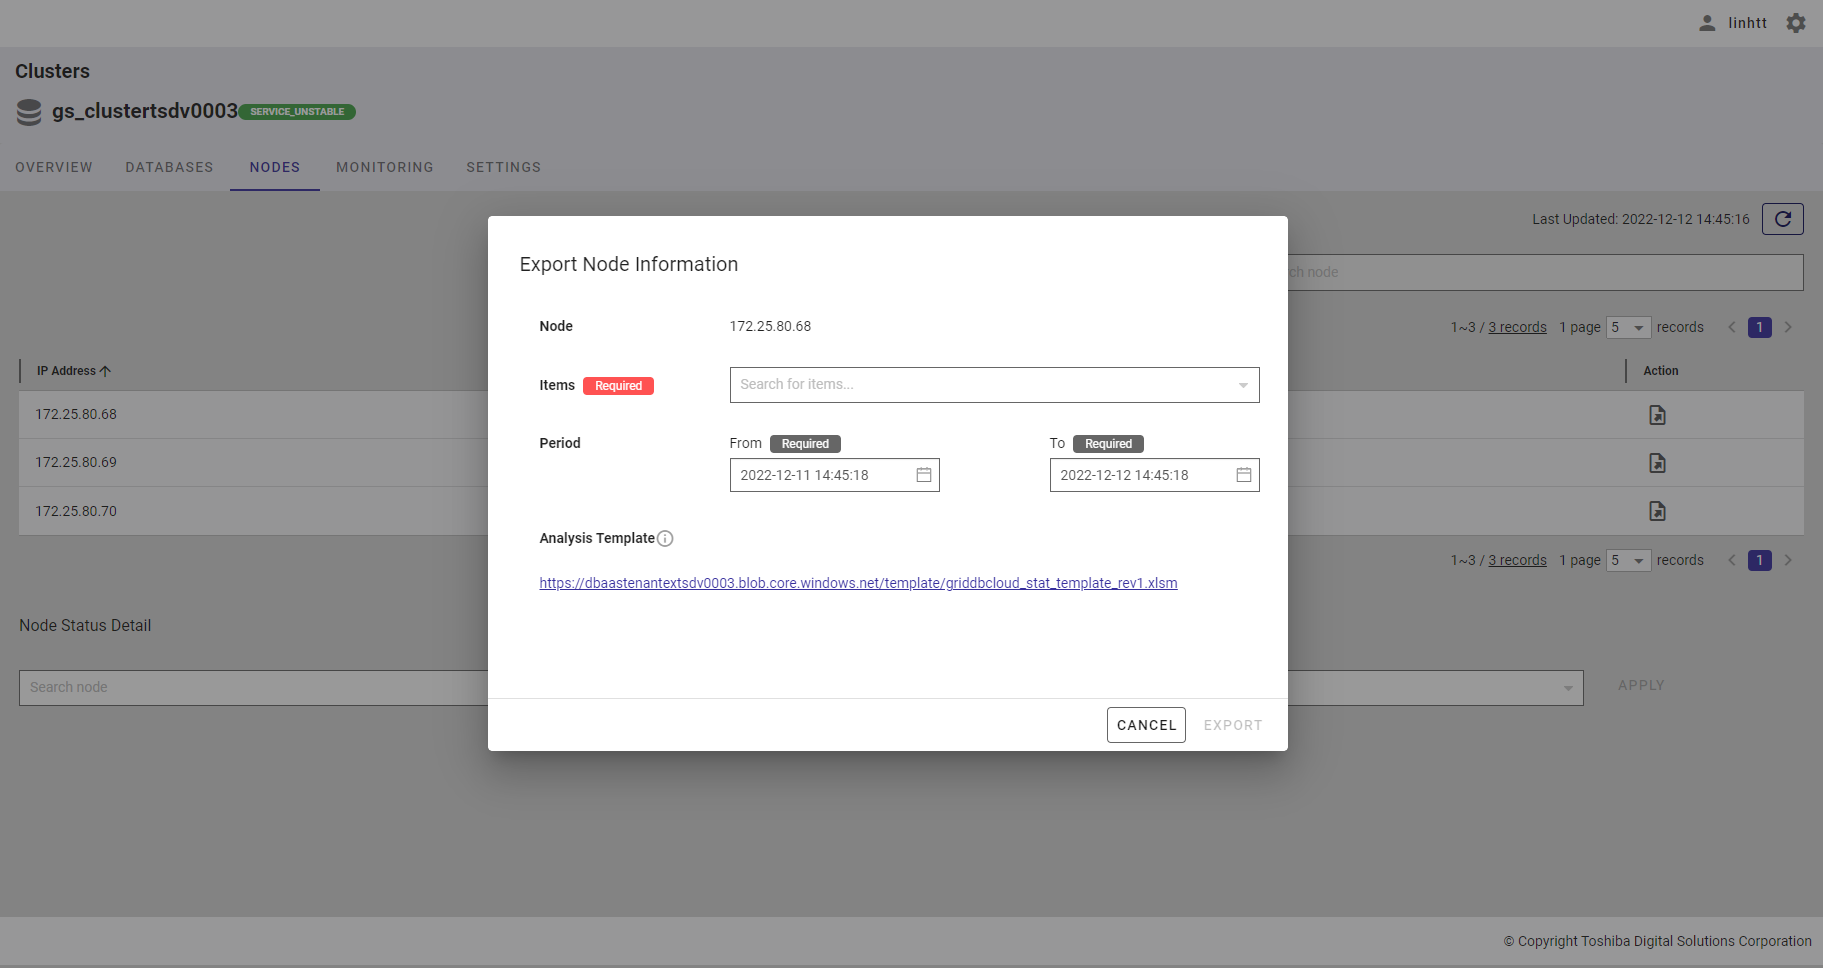
4.7.4 Exporting historical node information
Step 1: In the node list screen, click the [Export historical OS resource information] button in the column Action of the node list table to export the historical information about a node to a CSV file.
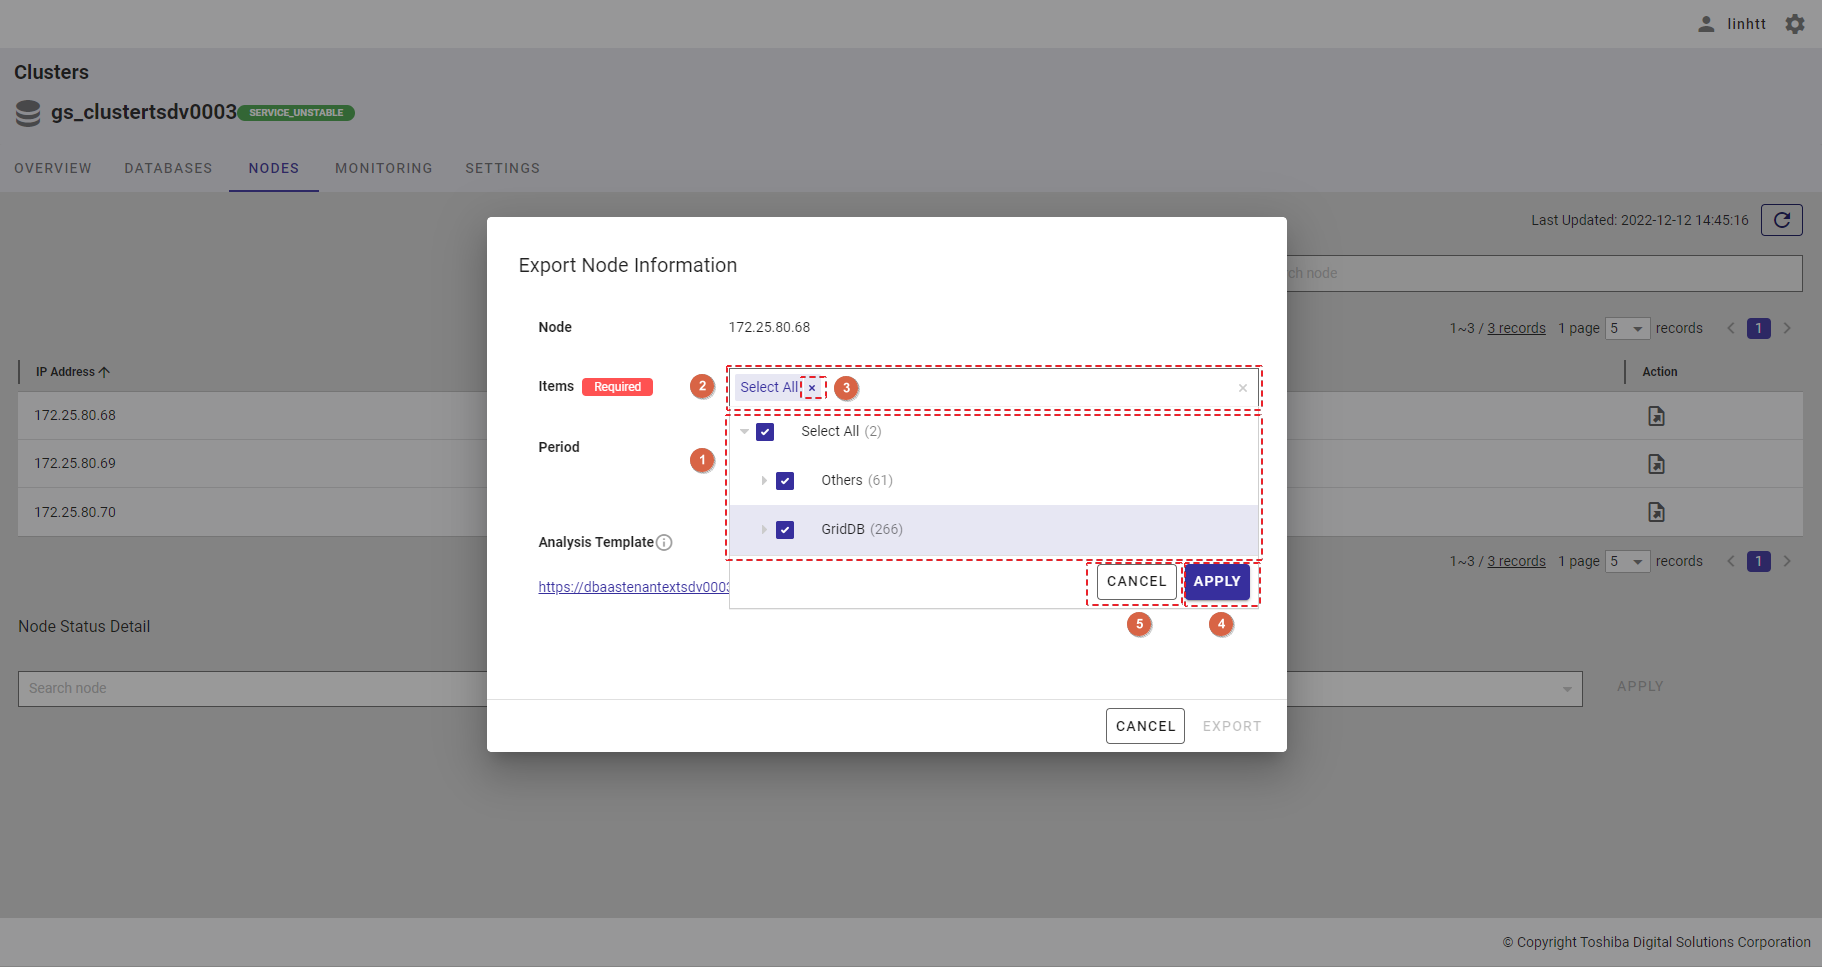
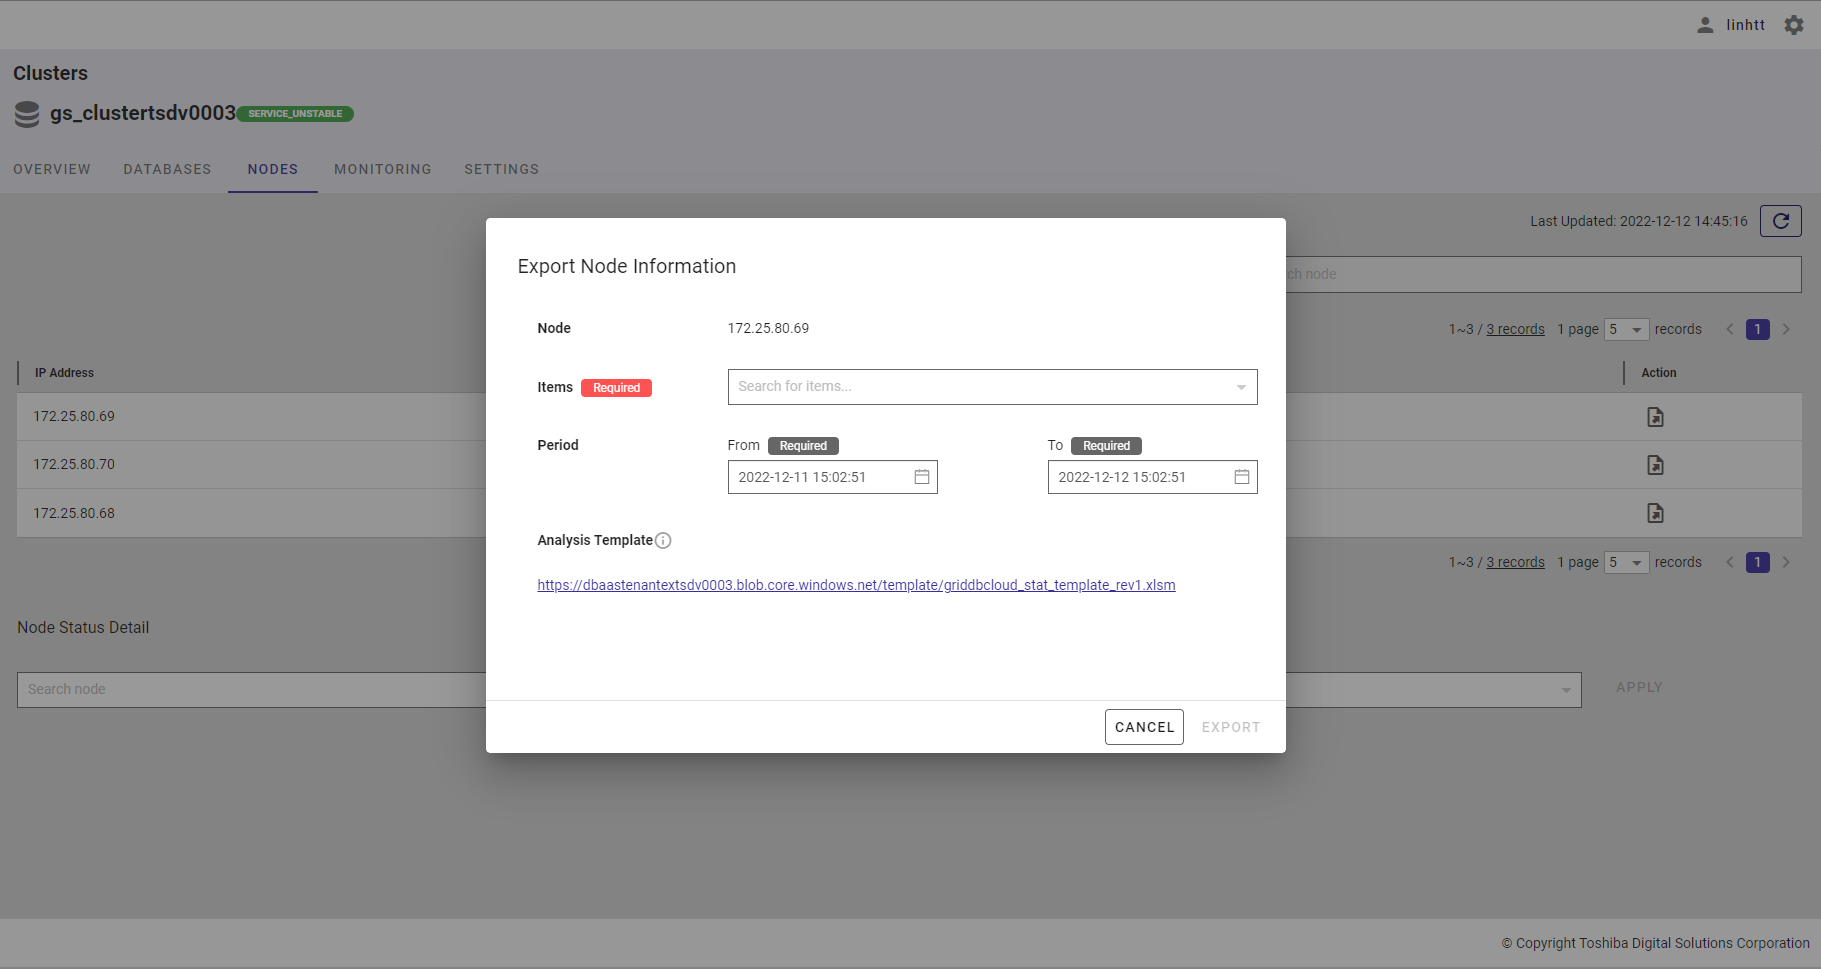
Step 2: When the Export Node Information dialog is displayed, choose the data you want to export to a CSV file by selecting items in the [Items] list.
You can select one or multiple items in the list by checking the checkbox (①) or by typing the name of the item you want to select in the search bar. The selected item will then be displayed at the top of the item list (②). To delete the selected item, uncheck the checkbox of the item or click the [X] button (③).
To save all your choices, click the [APPLY] button (④). You can also discard them by clicking the [CANCEL] button (⑤).
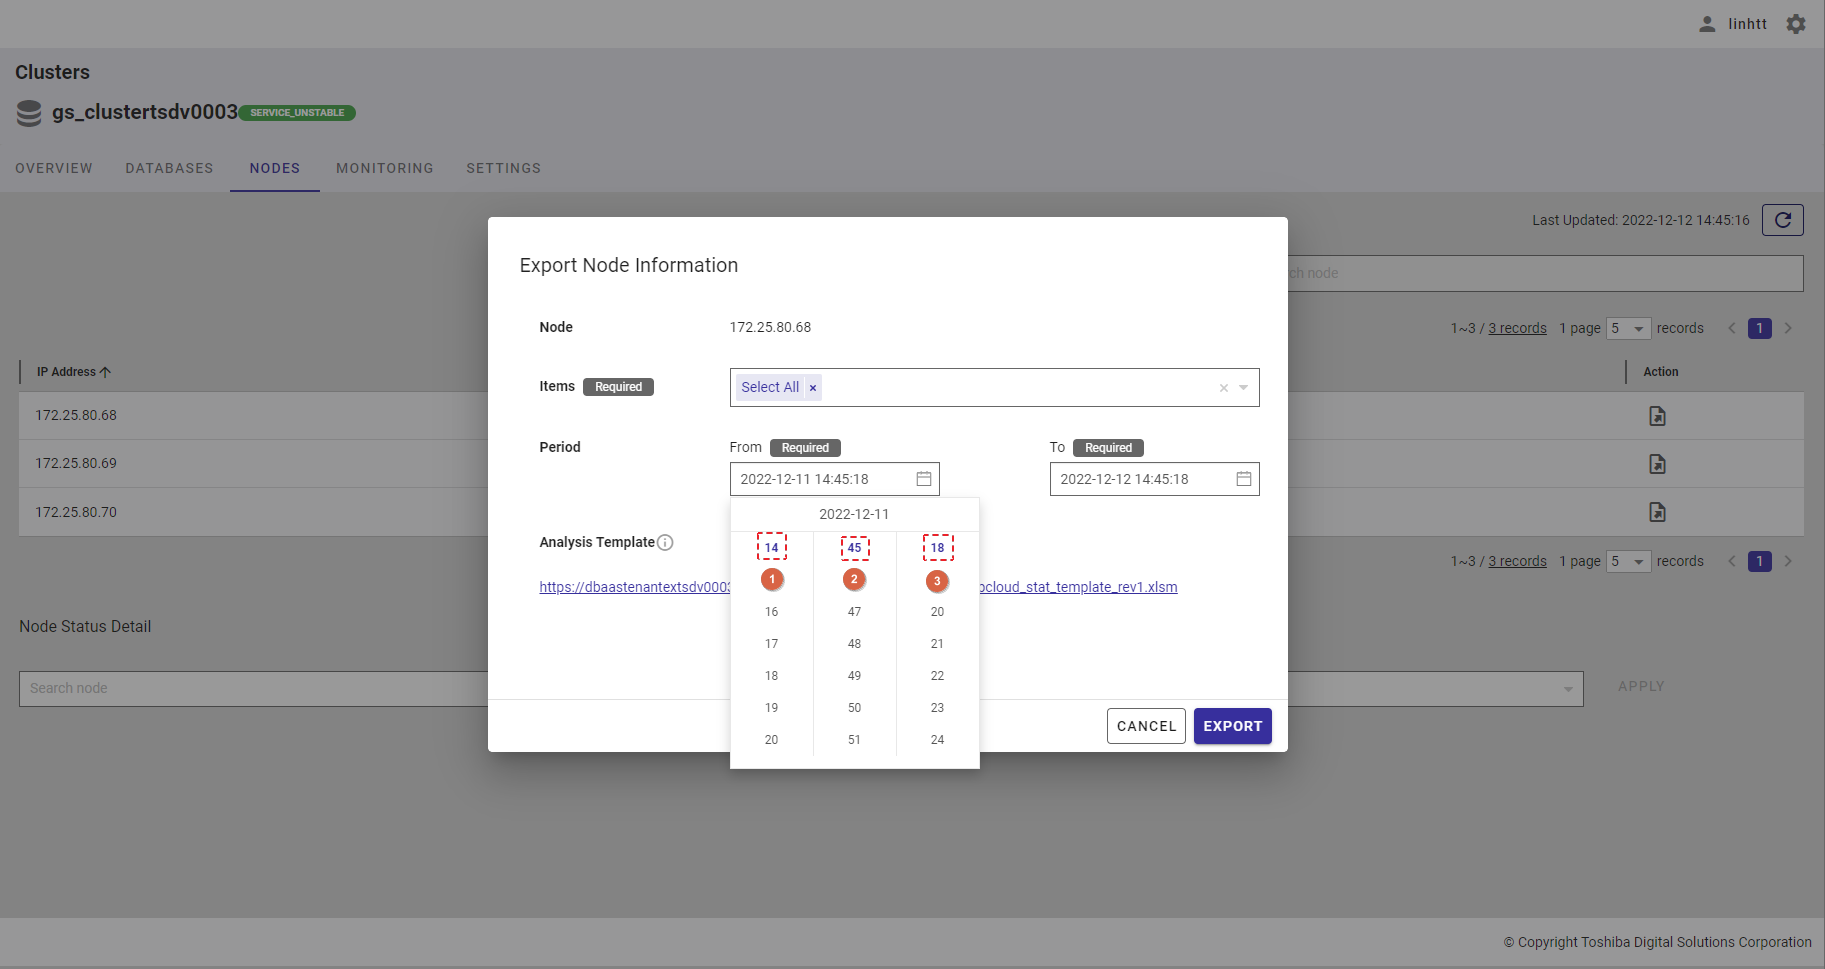
Step 3: Choose the beginning time by selecting the time in the [From] bar. After the calendar is displayed, choose the beginning date.
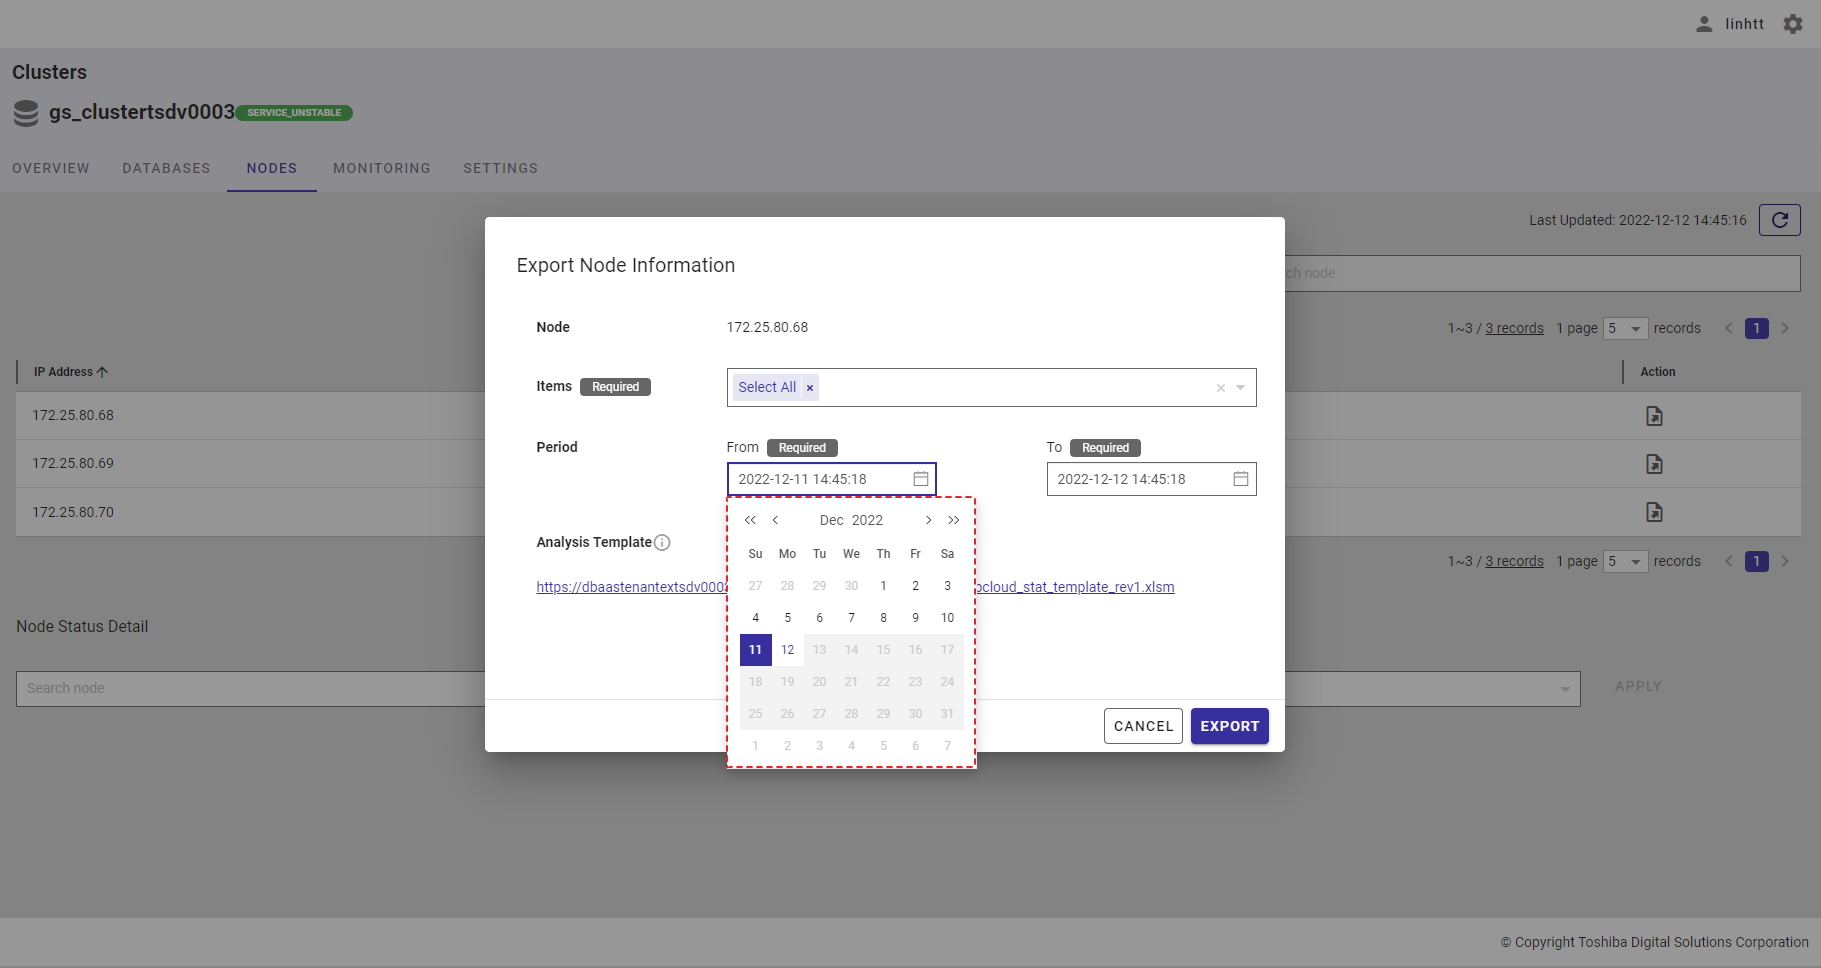
After selecting the date, the hour time bar will be displayed. Choose the hour (①), minute (②), and second values (③).
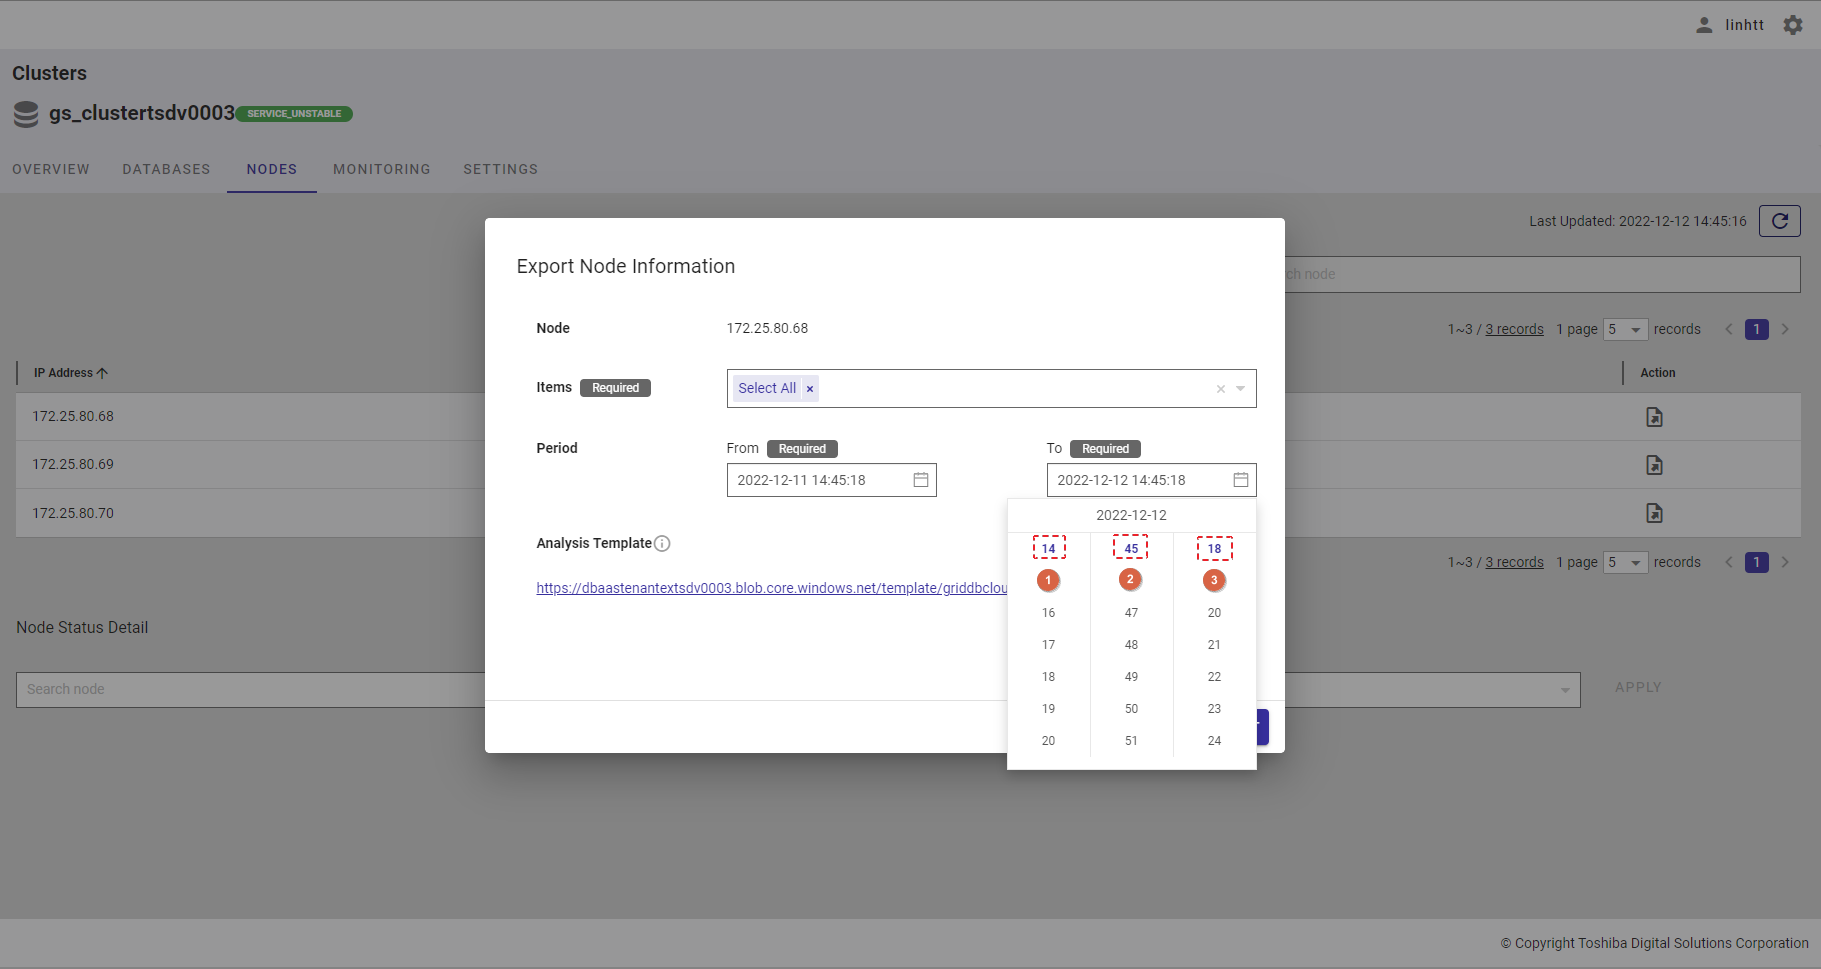
Step 4: Choose the ending time by selecting time in the [To] bar. After the calendar is displayed, choose the ending date.
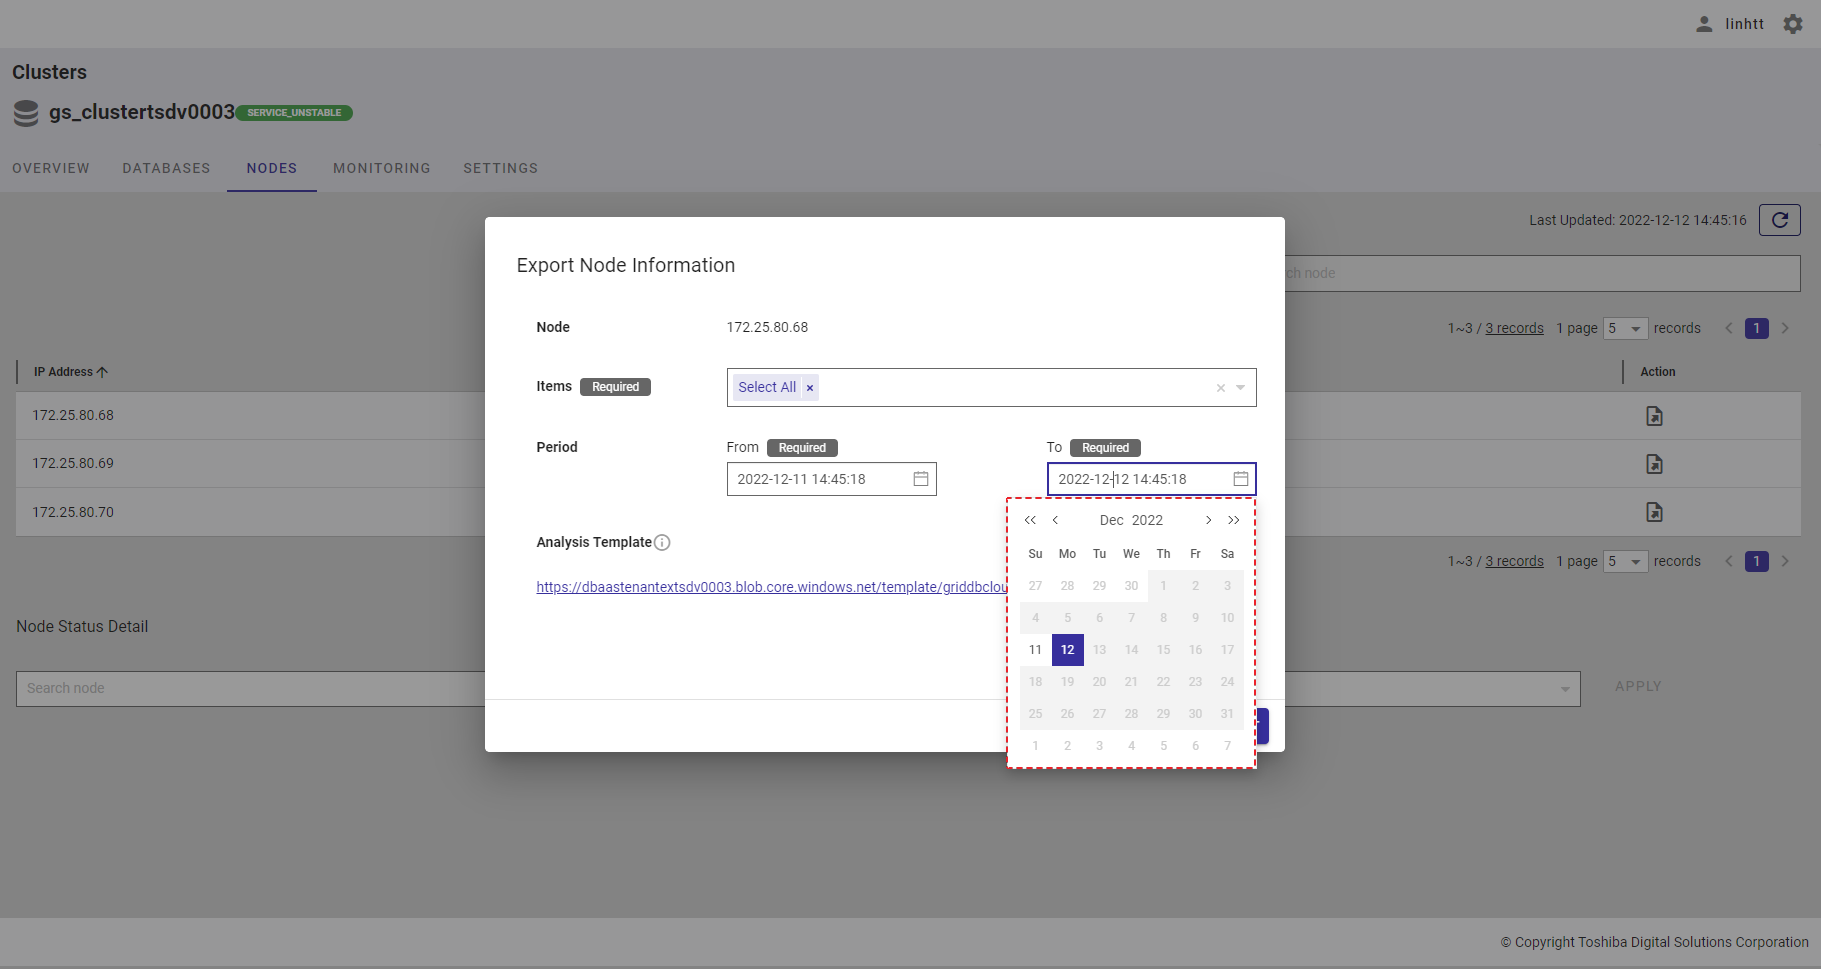
After selecting the date, the hour time bar will be displayed. Choose the hour (①), minute (②), and second values (③).
[Note]:
- The minimum date and time that can be selected is 1970-01-01 00:00:00.
- The maximum date and time that can be selected is 23:59:59 of the current day.
- The "To date time" must be greater than or equal to the "From date time."
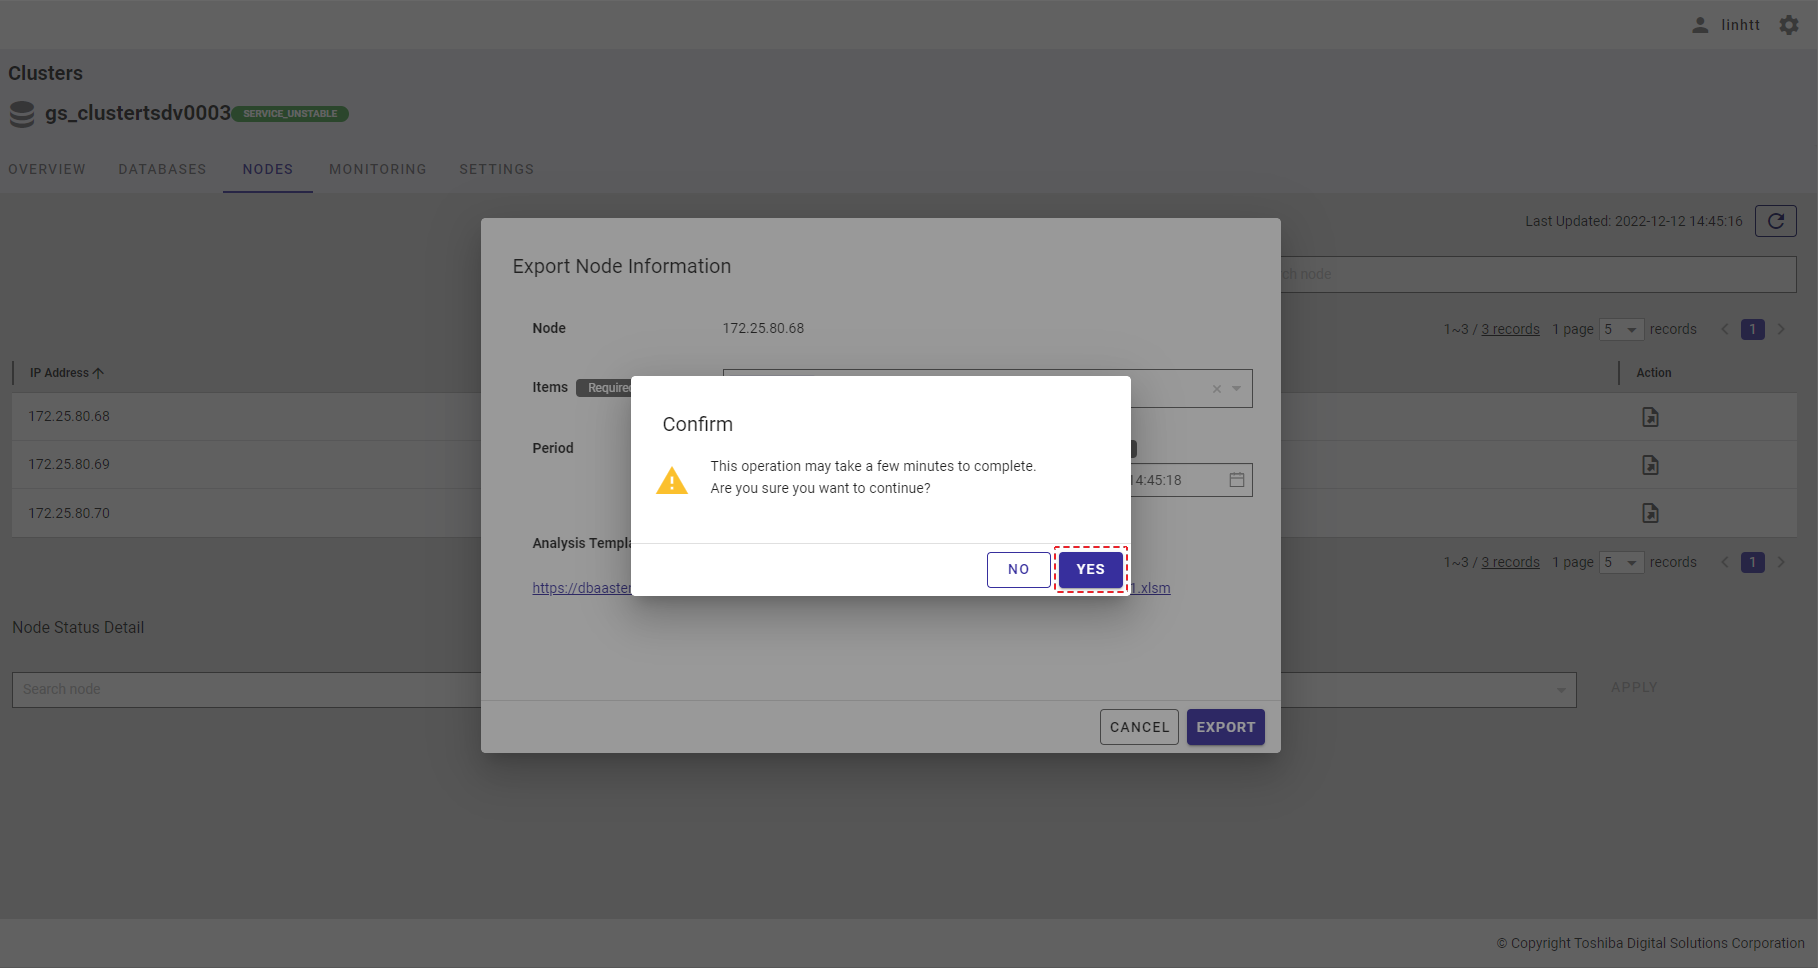
Step 5: After selecting the date and time, click the [EXPORT] button (①) to export data to a CSV file. The exported CSV file will be compressed into a zip file. If you do not want to export data, click the [CANCEL] button to close the dialog.
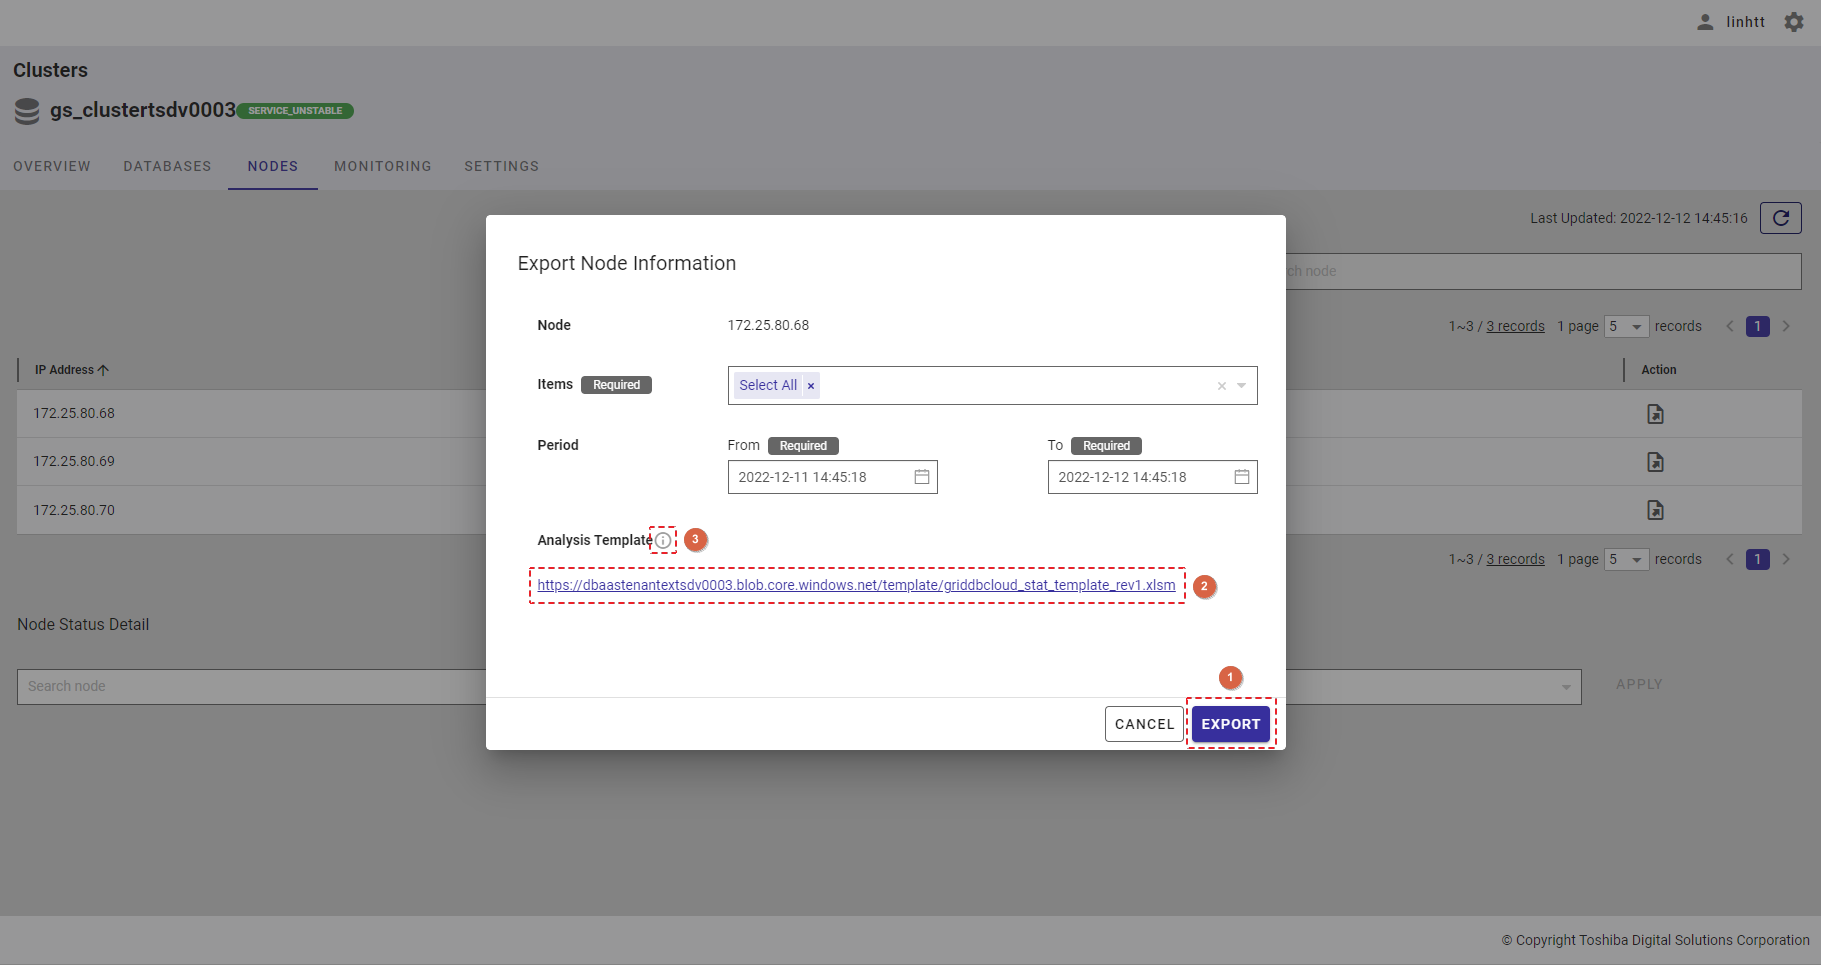
[Note]: You can download a template file that allows you to graph the historical information by clicking the URL (②) to the right of Analysis Template. You can hover the mouse pointer over the information icon (③) to get a hint.
Step 6: Once the [EXPORT] button is clicked, a confirmation dialog will be displayed. Click the [YES] button to continue. If you do not want to continue, click the [NO] button to close the confirmation dialog and return to the Export Node Information dialog.
[Note]: If you successfully export data, the selected items will be stored. The next time you click the [Export historical OS resource information] button again, a list of exported items previously selected will be displayed.
4.8 Node settings function
This function is used for displaying and changing the node settings for GridDB nodes.
4.8.1 Available roles
In the table below, the role with a plus sign (+) can use the function on the left.
| No. | Function | General user | Administrator user |
|---|---|---|---|
| 1 | Display node settings | - | + |
| 2 | Change node settings | - | + |
| 3 | Verify settings with assumed values | - | + |
| 4 | View memory usage trends | - | + |
4.8.2 Displaying node settings
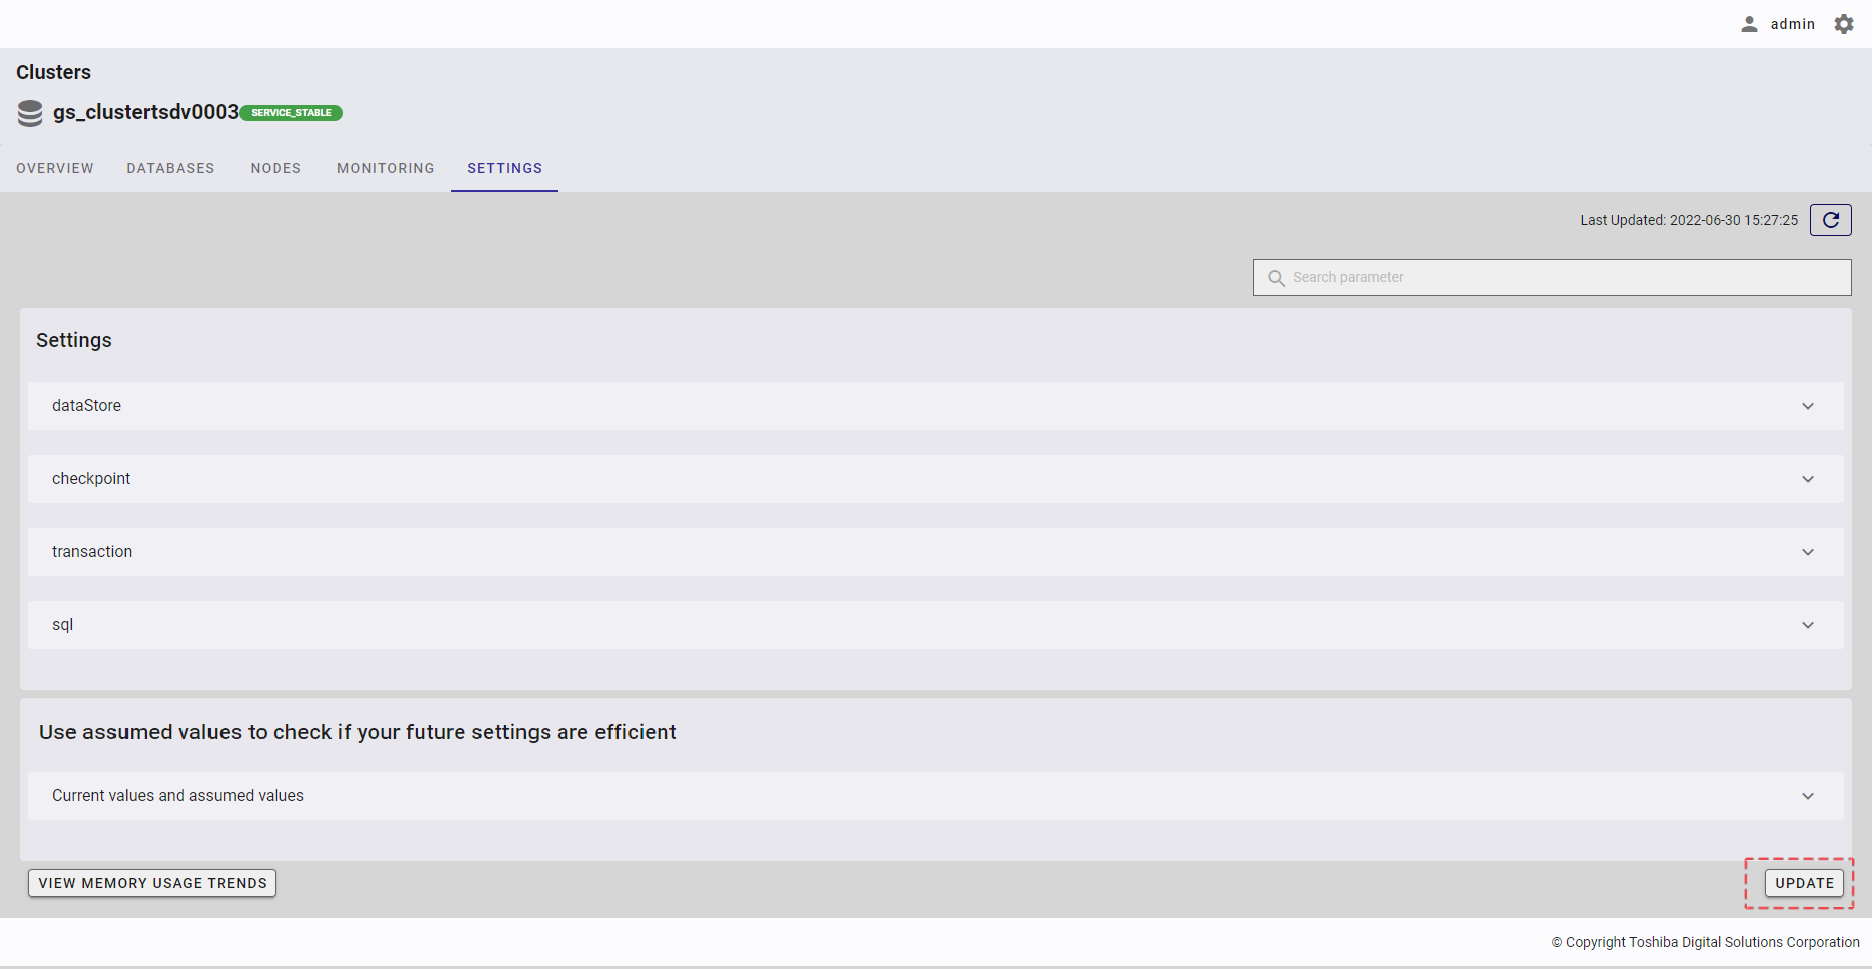
To see the node settings, select the item [Clusters] (①) from the left menu. Then select the [SETTINGS] tab (②) to display the node settings screen.
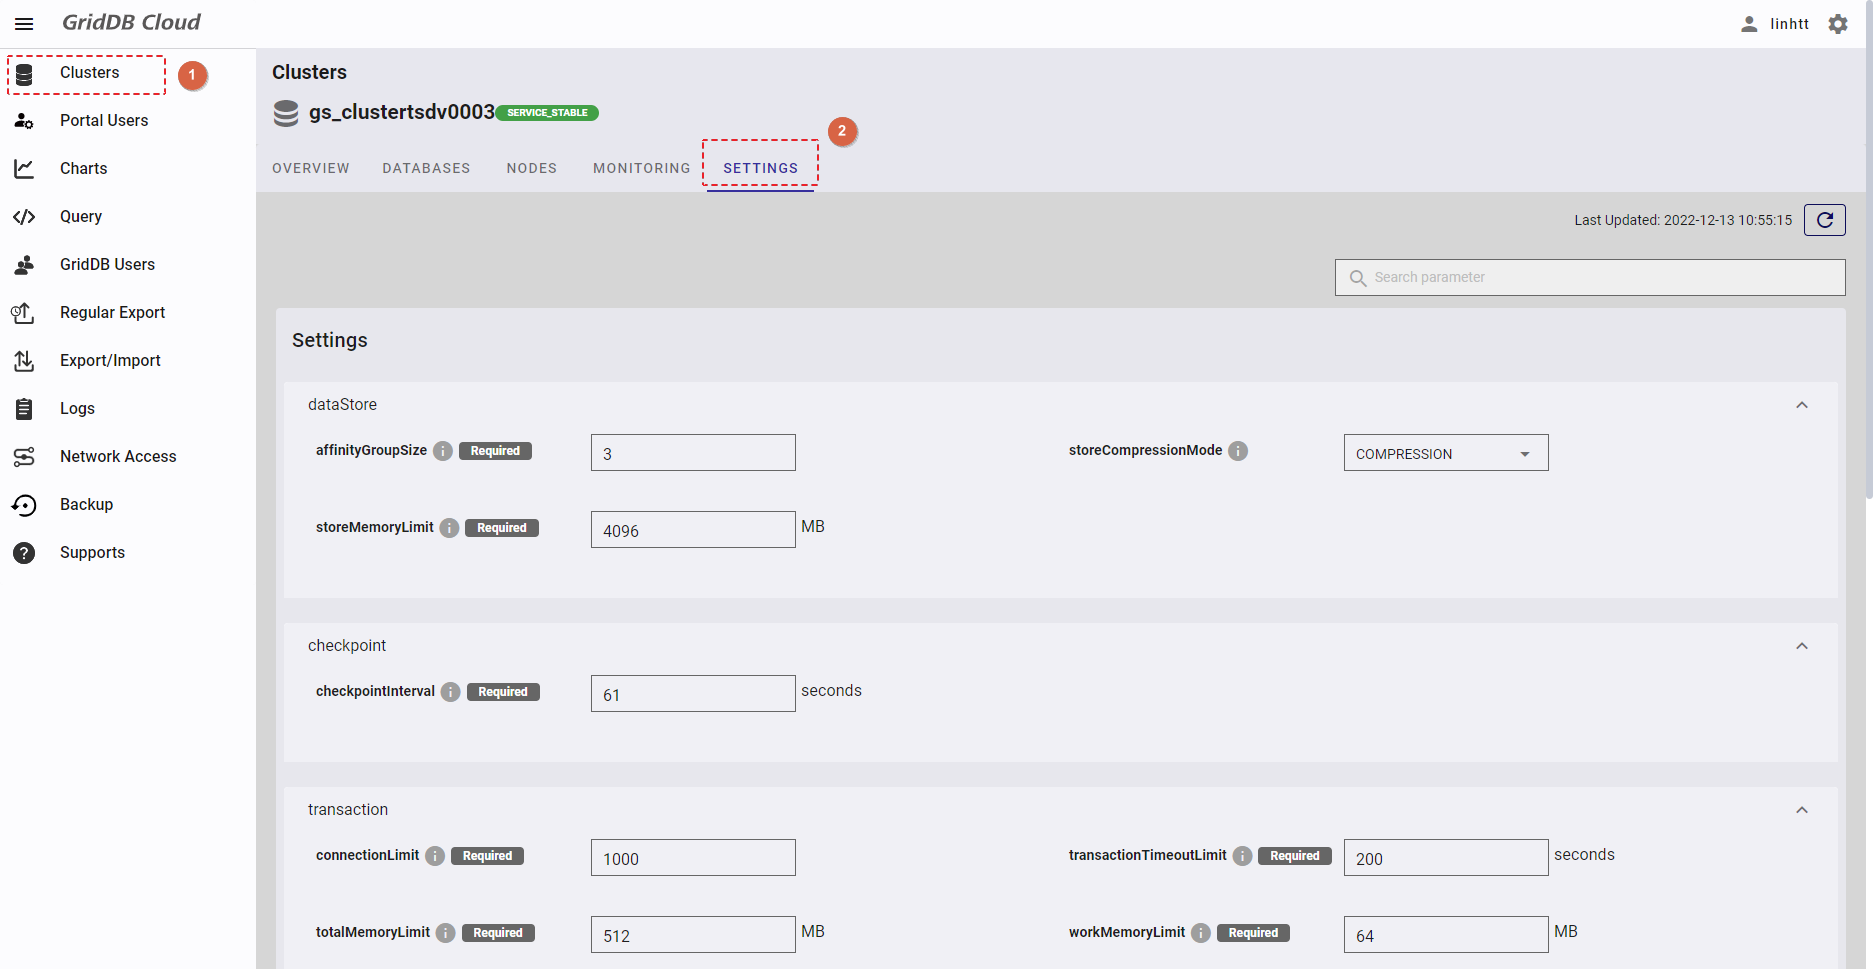
You can change the node settings for items listed in the table below. For more details, refer to the section on the node definition file in the GridDB Features Reference, or the GridDB Administrators Guide.
| Setting group | Setting |
|---|---|
| dataStore | affinityGroupSize |
| storeCompressionMode | |
| storeMemoryLimit | |
| checkpoint | checkpointInterval |
| transaction | connectionLimit |
| transactionTimeoutLimit | |
| totalMemoryLimit | |
| workMemoryLimit | |
| sql | storeMemoryLimit |
| workMemoryLimit | |
| workCacheMemory | |
| connectionLimit | |
| concurrency | |
| traceLimitExecutionTime |
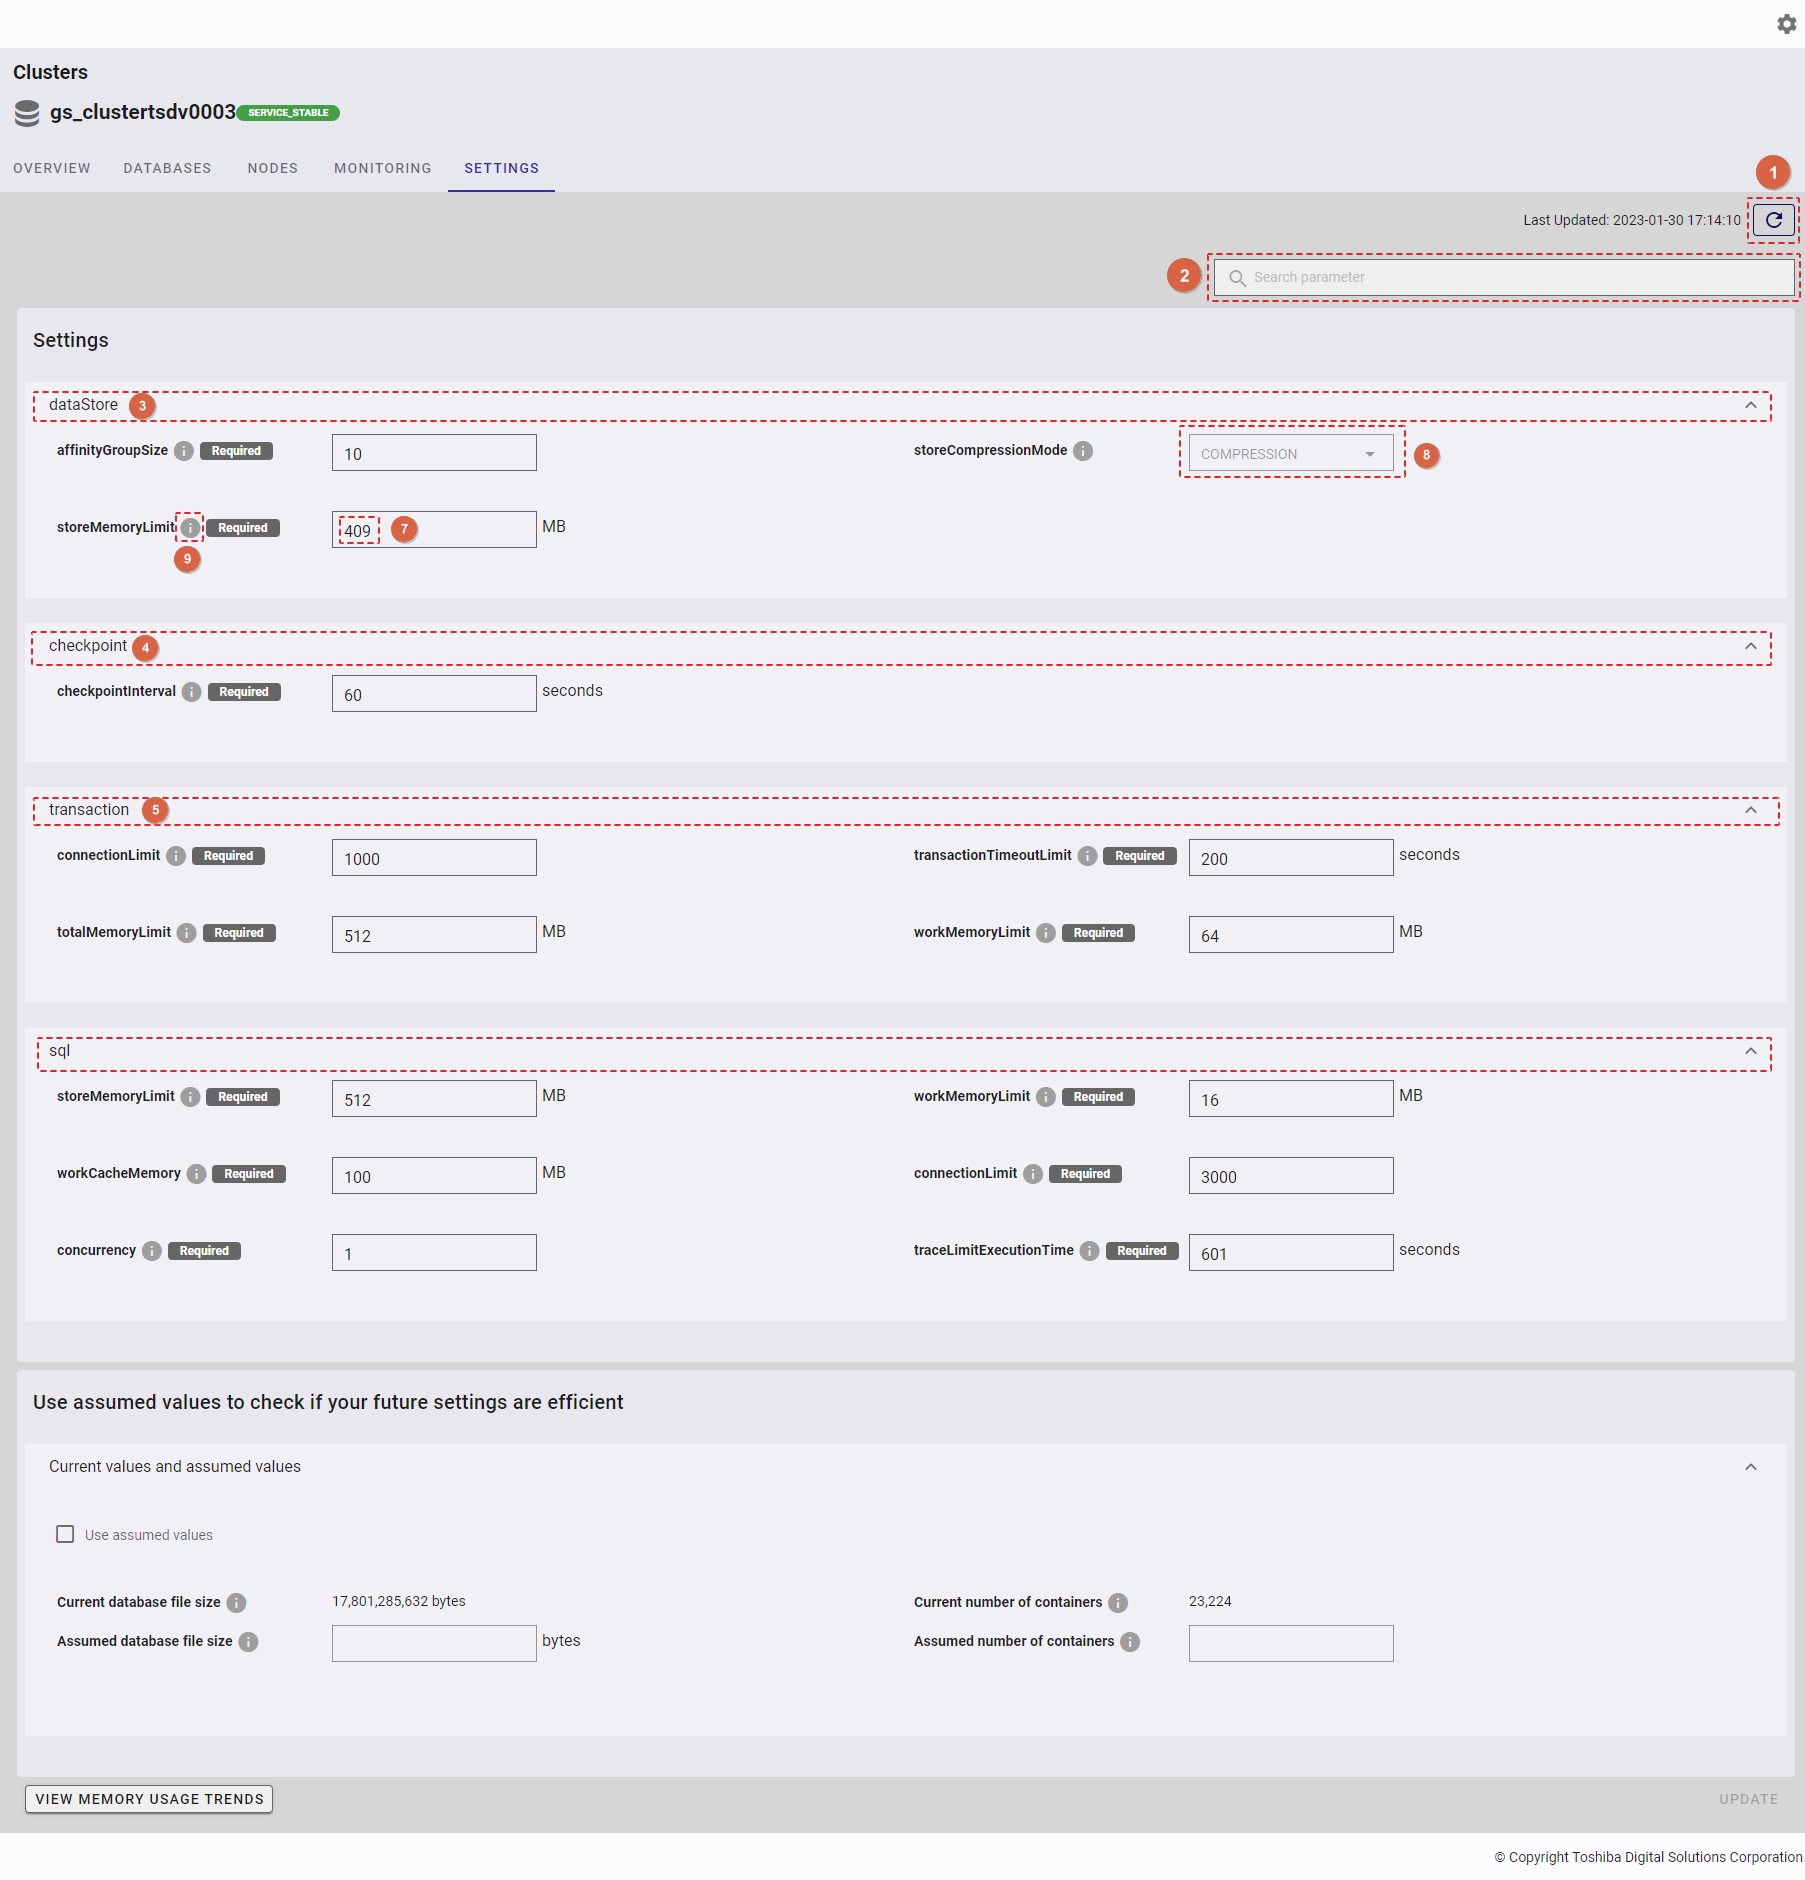
- To search for a specific parameter, type the information in the search bar (②).
- To refresh the node settings and obtain the latest information about the node settings, click the [Refresh] button (①).
- Click the [dataStore] tab (③) to show/hide the dataStore information.
- Click the [checkpoint] tab (④) to show/hide the checkpoint information.
- Click the [transaction] tab (⑤) to show/hide the transaction information.
- Click the [sql] tab (⑥) to show/hide the sql information.
- You can edit the value of each parameter (⑦) by entering the value in the text field or selecting the value from the drop-down list (⑧).
- You can hover the mouse pointer over the information icon (⑨) to show the tooltip for the details of the parameter.
4.8.3 Changing node settings
Step 1: Change the value of any parameter in the panels.
Step 2: Click the [UPDATE] button when the button becomes enabled to change node settings.
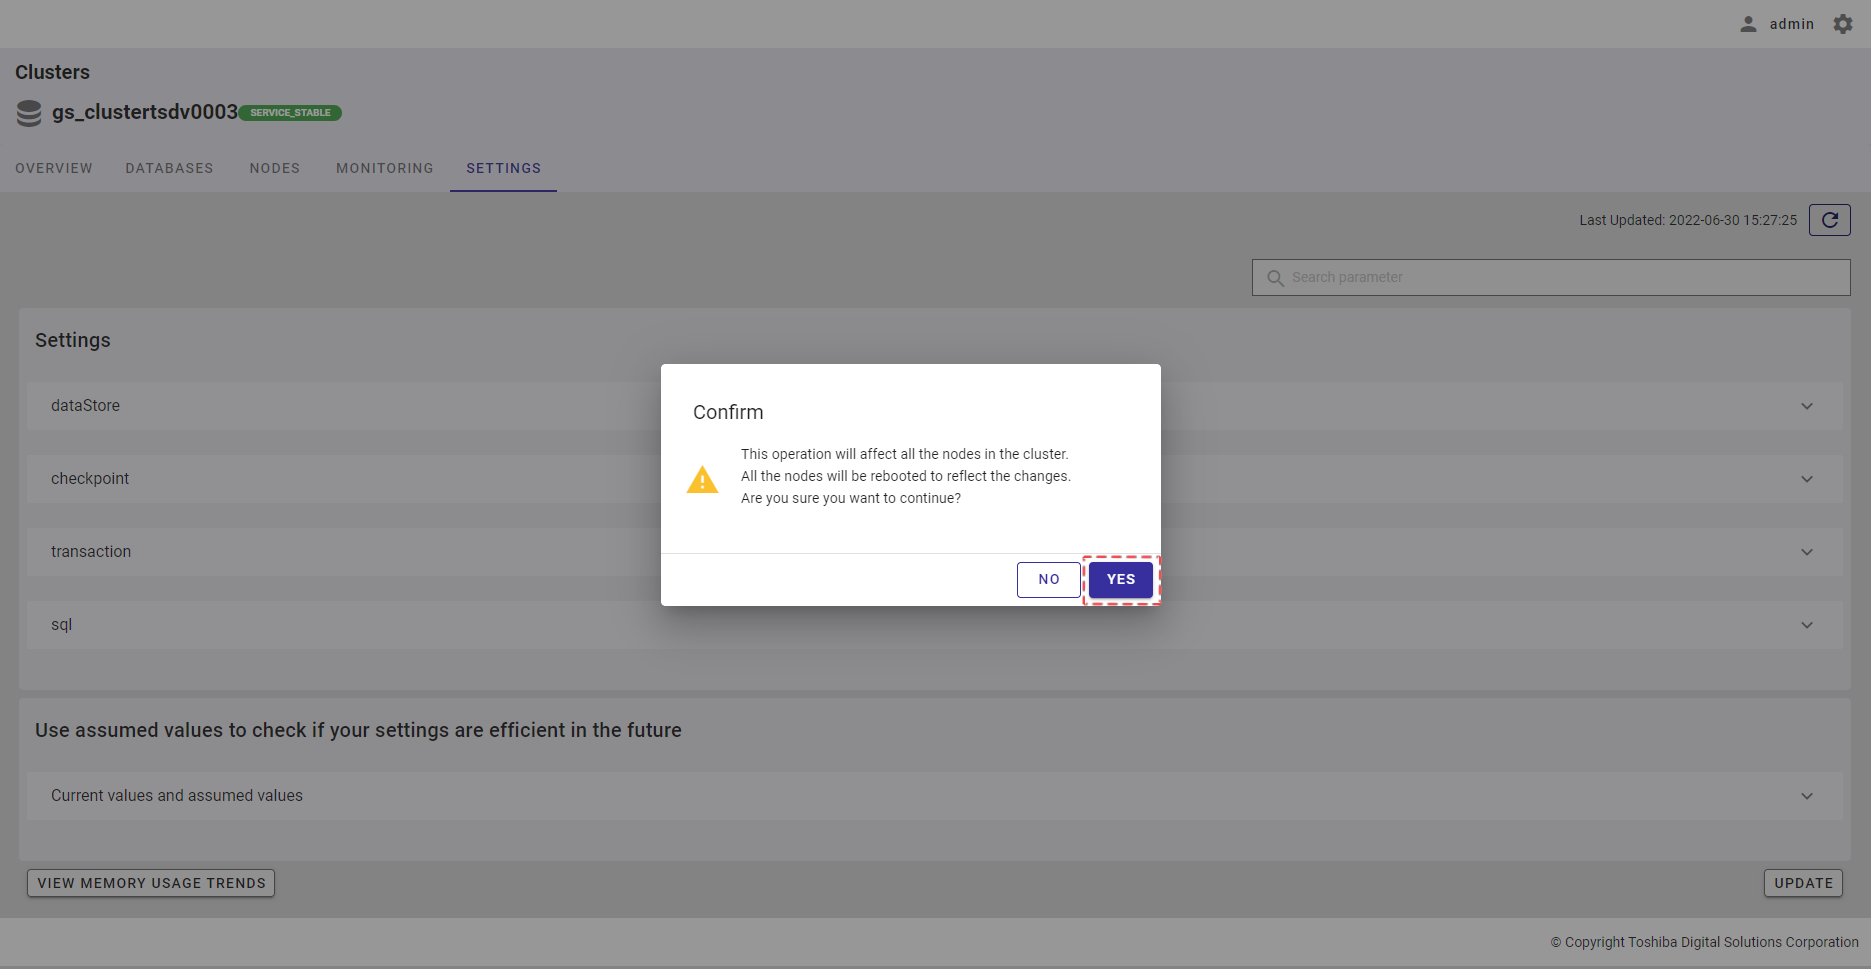
Step 3: Once the [UPDATE] button is clicked, a confirmation dialog will be displayed. Click the [YES] button to start updating node settings. If you do not want to update node settings, you can click the [NO] button to close the confirmation dialog and return to the node settings screen.
4.8.4 Verifying settings with assumed values
Click the [Current values and assumed values] tab to show/hide the [Use assumed values to check if your future settings are efficient] panel. By default, the [Current values and assumed values] tab is expanded.
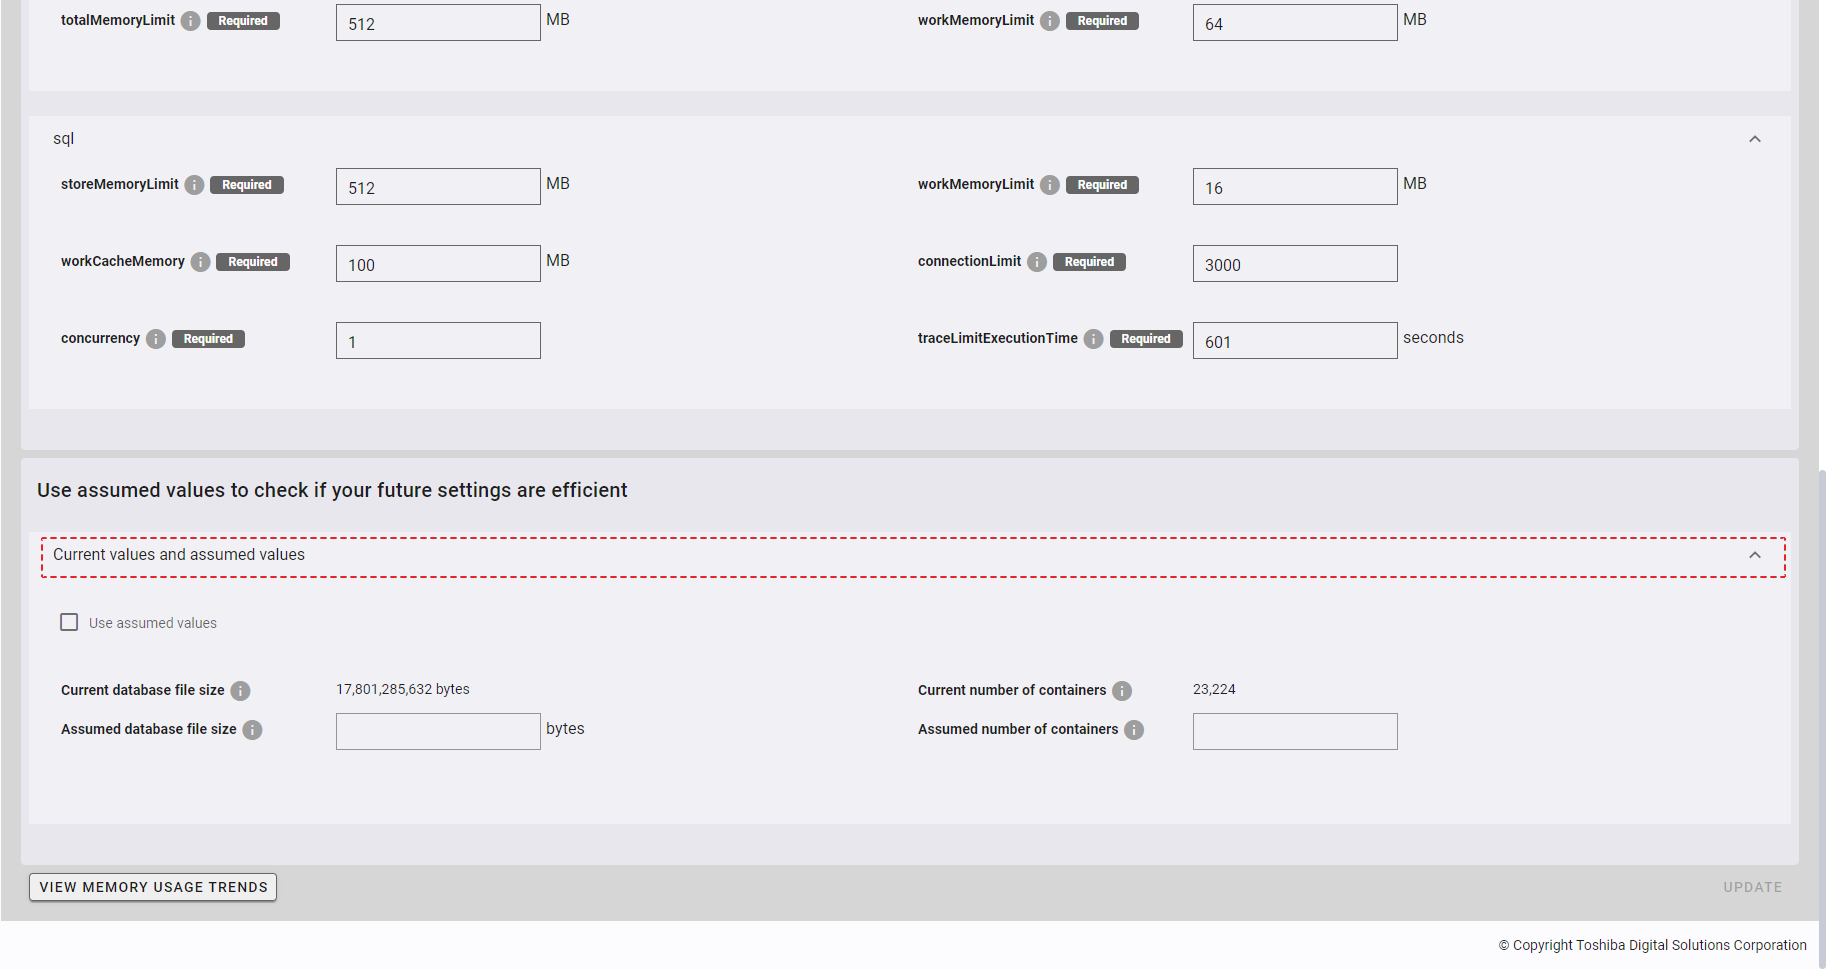
The text boxes for Assumed database file size and Assumed number of containers are disabled at the initial stage.
Click the [Use assumed values] checkbox (①) to verify the future settings.
- You can enter the value of each parameter (② and ③) in the text field.
- If the current settings remain efficient in light of assumed values, a valid validation message (④) will appear, and the [UPDATE] button will be disabled.
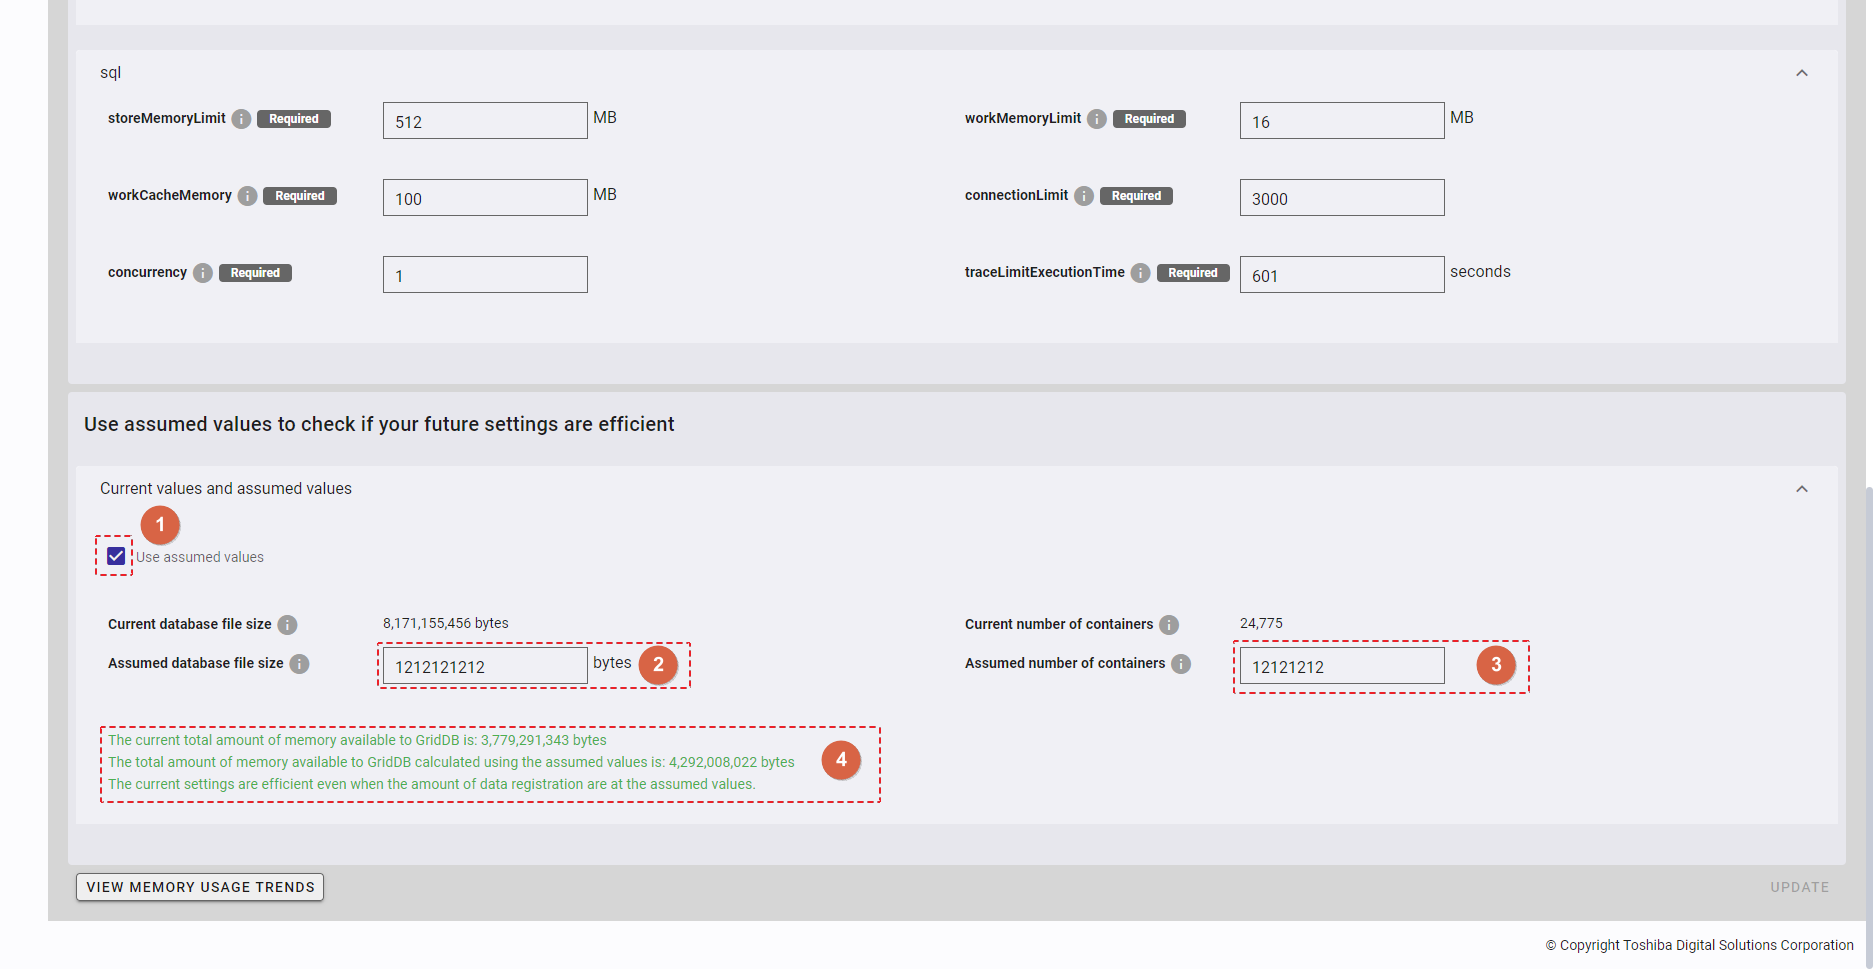
- If the current settings are not efficient in light of assumed values, an invalid validation message (⑤) will appear.
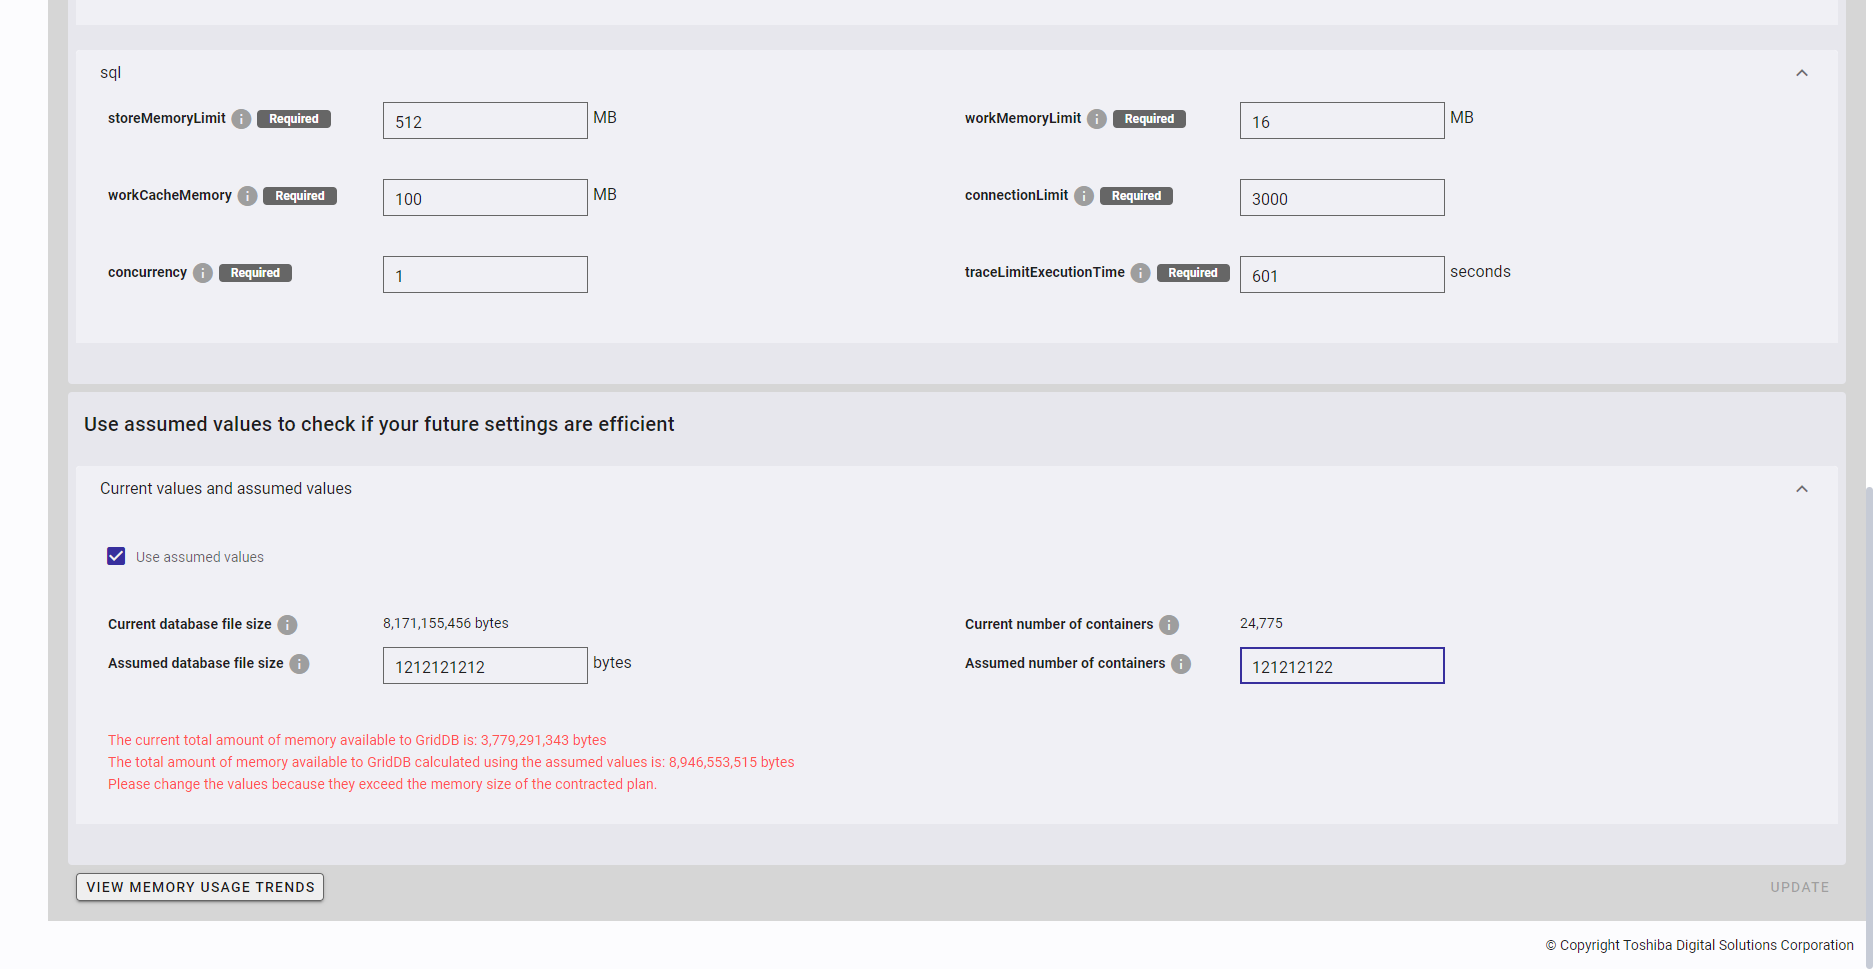
[Note]: If you click the [Use assumed values] checkbox (①) again to uncheck it, the text boxes for Assumed database file size and 'Assumed number of containers` will be set to blank and disabled.
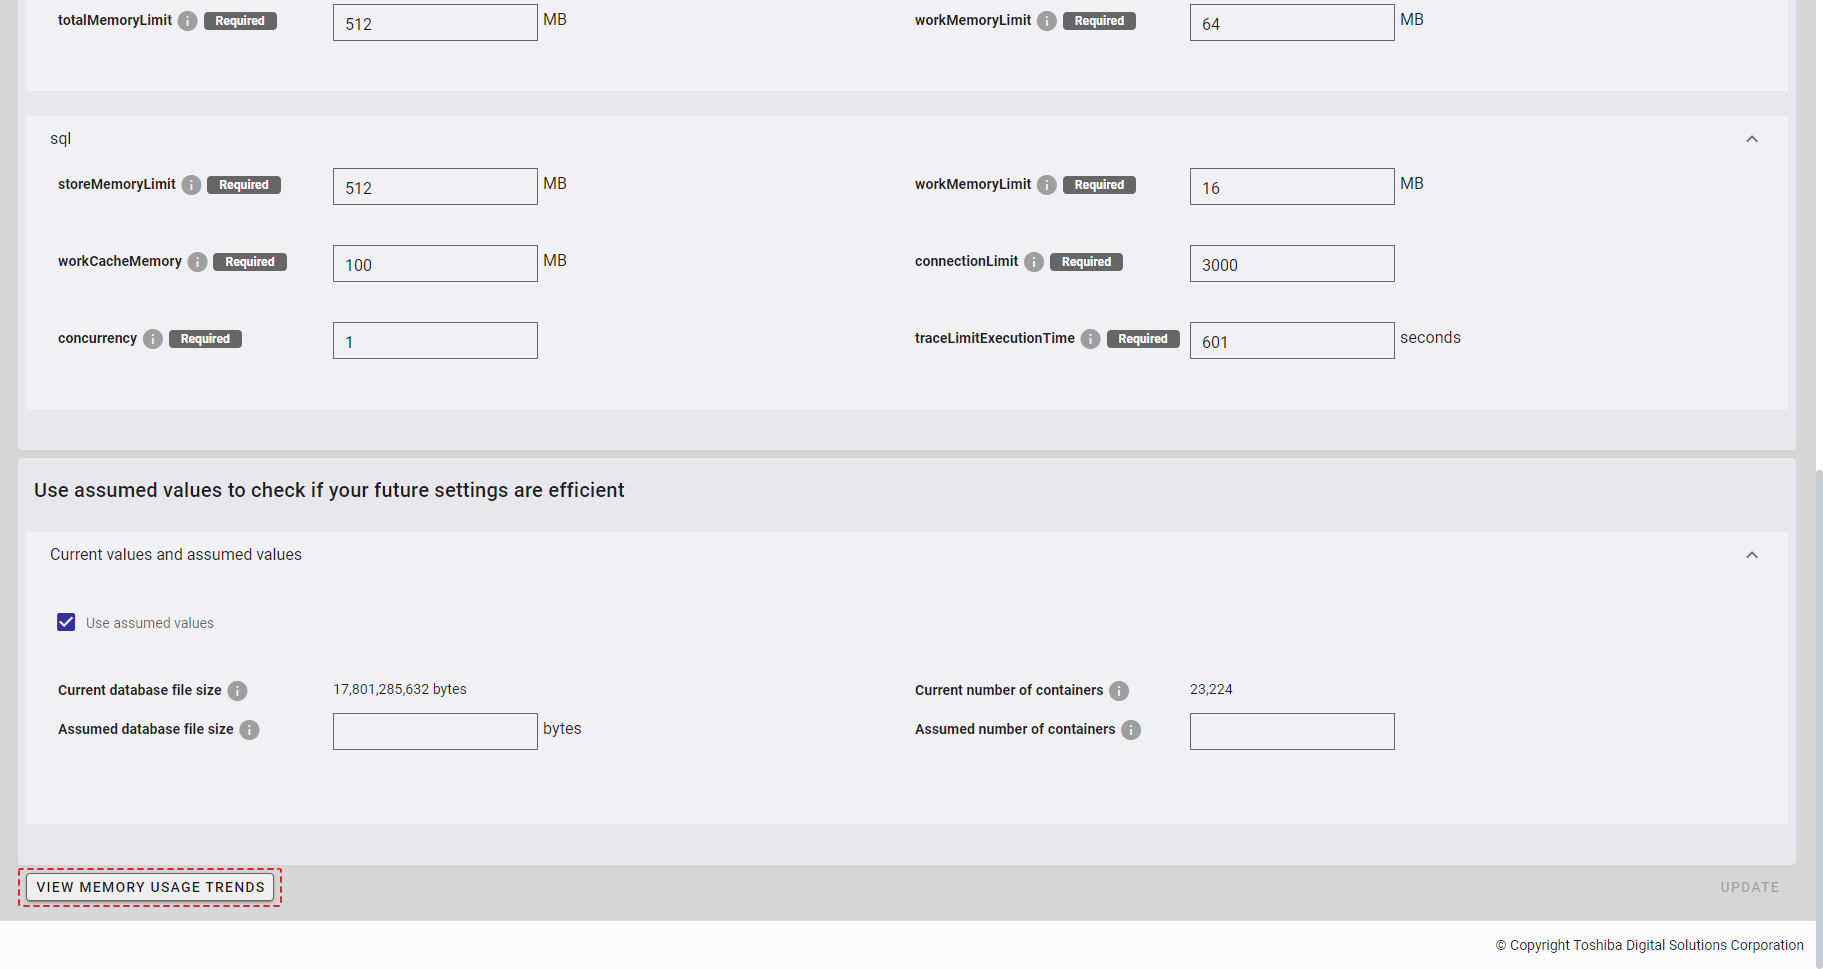
4.8.5 Viewing memory usage trends
Step 1: To view memory usage trends, click the [View memory usage trends] button.
[Note]: If you cannot get node settings parameters, the [View memory usage trends] button will be disabled.
Step 2: The View memory usage trends dialog is displayed. You can select a time range in two ways:
- Select a time range from the [Time range] list (①). The default time range is
1M. The number of days (②) in the range just selected is automatically selected.
- In the input field (②), enter the number of days in the time range. The number of days must be between 30 and 1825. If the number of days is one of the following numbers
{30, 90, 270, 365, 1095, 1825}, the corresponding number of months or years is automatically selected in the [Time range] list (①).
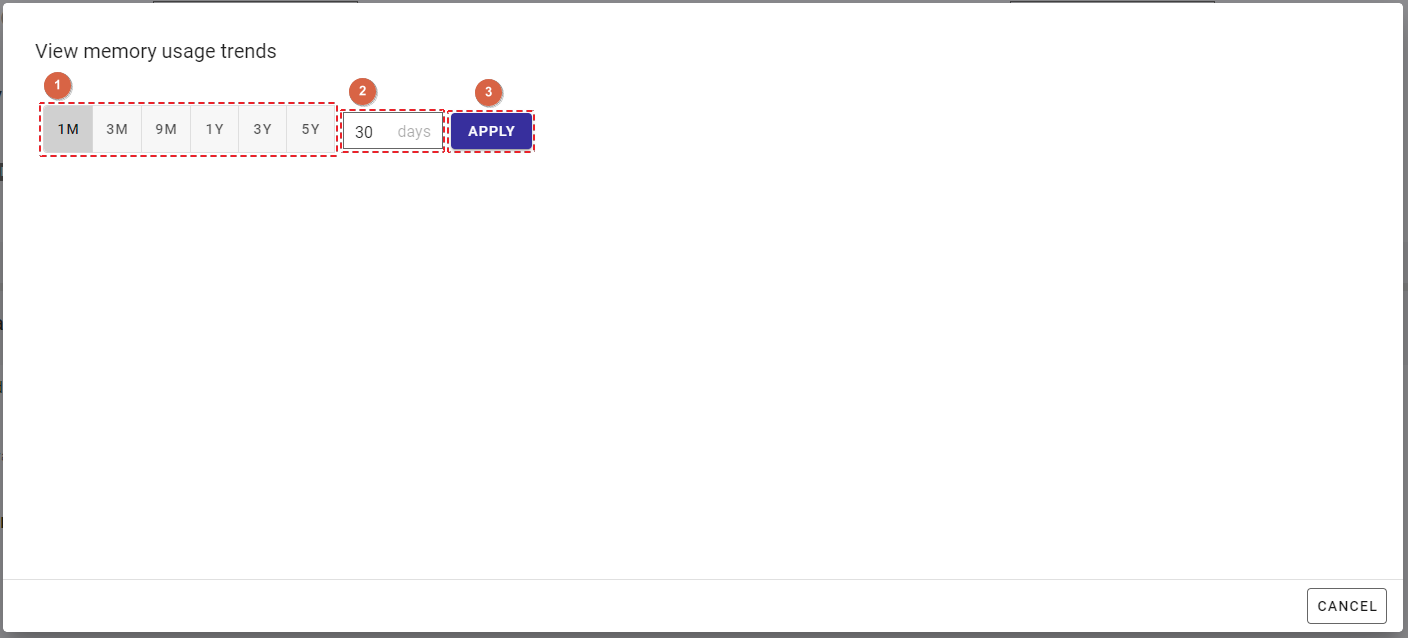
- Time range list:
| Time range | Description |
|---|---|
| 1M | 1 month (30 days) from the current time. |
| 3M | 3 months (90 days) from the current time. |
| 9M | 9 months (270 days) from the current time. |
| 1Y | 1 year (365 days) from the current time. |
| 3Y | 3 years (1095 days) from the current time. |
| 5Y | 5 years (1825 days) from the current time. |
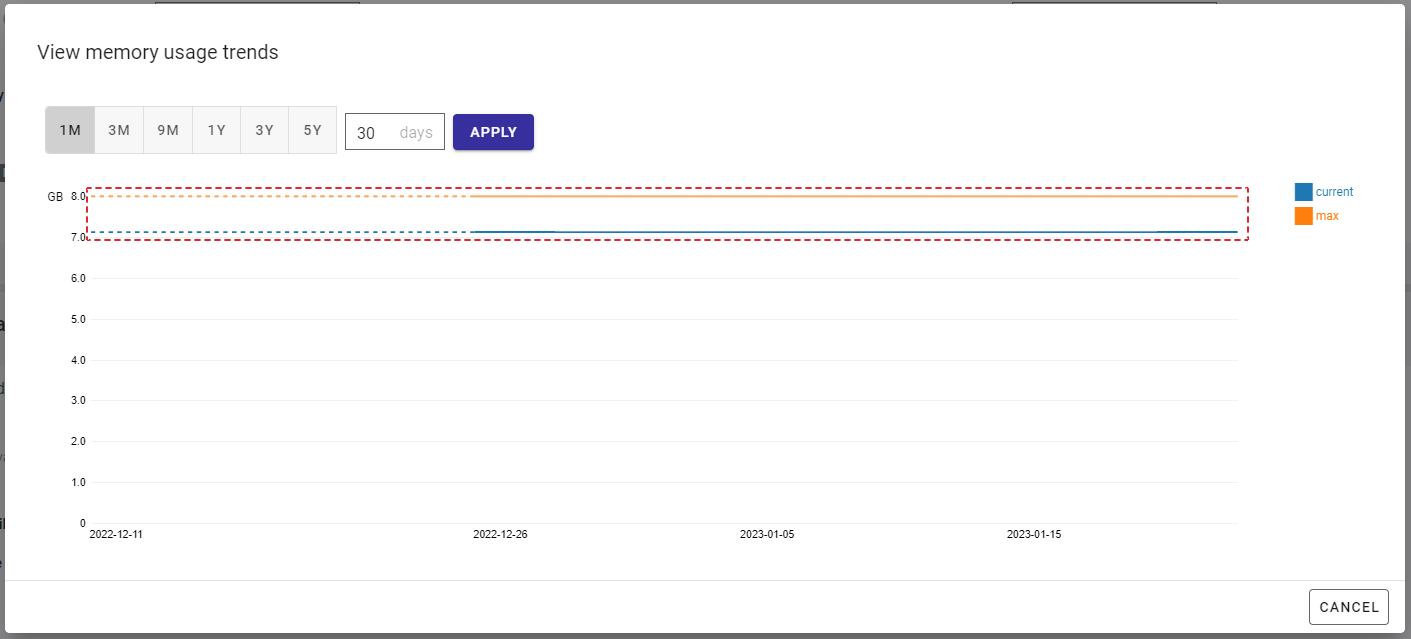
Step 3: Click the [Apply] button (③) to display a chart for memory usage trends. You can click the [Cancel] button (④) to close the dialog. The solid line displays memory usage trends in the future, and the dotted line displays those in the past.
4.9 Management GUI user management function
This function is used for various user-related operations through management GUI, including creating and deleting a user, editing user information, viewing the user details, and changing the user password.
4.9.1 Available roles
In the table below, the role with a plus sign (+) can use the function on the left whereas the role with a minus sign (-) cannot use it.
| No. | Function | General user | Administrator user |
|---|---|---|---|
| 1 | Display a user list | - | + |
| 2 | Create a user | - | + |
| 3 | Edit user information | - | + |
| 4 | Change the user password | - | + |
| 5 | Delete a user | - | + |
4.9.2 Displaying a user list
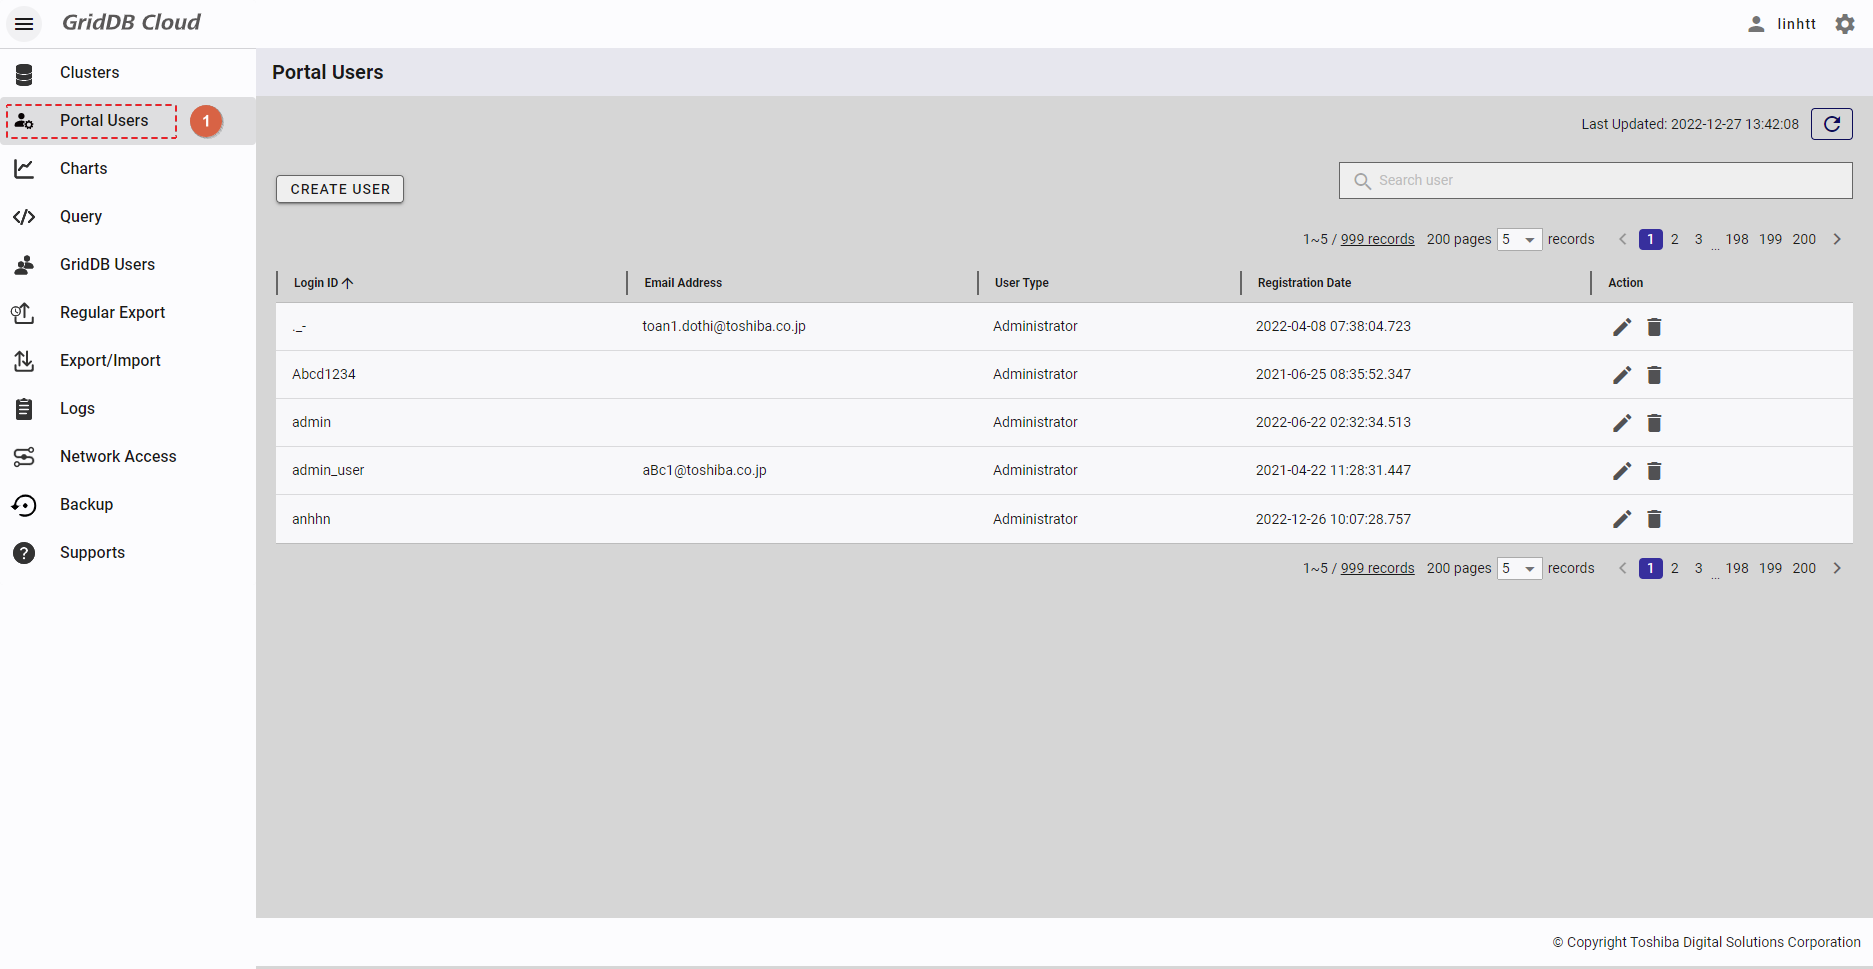
- To access the user list screen, first you must log in to the system and click the item [Portal Users] (①) in the left menu.
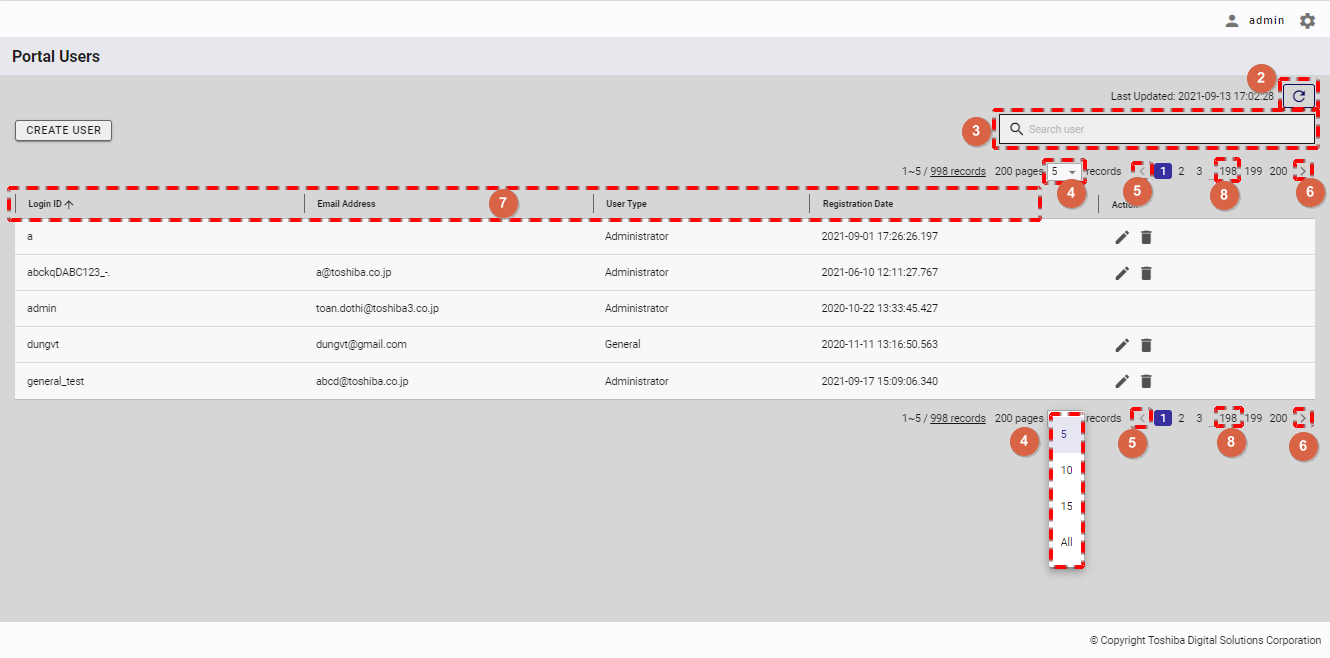
- You can choose the number of users displayed on one page by selecting the number from [5, 10, 15, All] (④) at the top or bottom of the page. Click the [Next] button (⑥) or the [Back] button (⑤), or click the page number (⑧) to view another page.
- To search for a specific GUI user, type the name of that GUI user in the search bar (③).
- To refresh the user list and get the latest information about the user list, click the [Refresh] button (②) at the top of the right panel.
- You can sort the list of users by id, by email address, by user type, or by registration date, by clicking the header (⑦) of each column.
- You can adjust the column size by dragging and dropping the vertical bar "|" on the header.
4.9.3 Creating a user
Step 1: In the user management screen, click the [CREATE USER] button to create a new user.
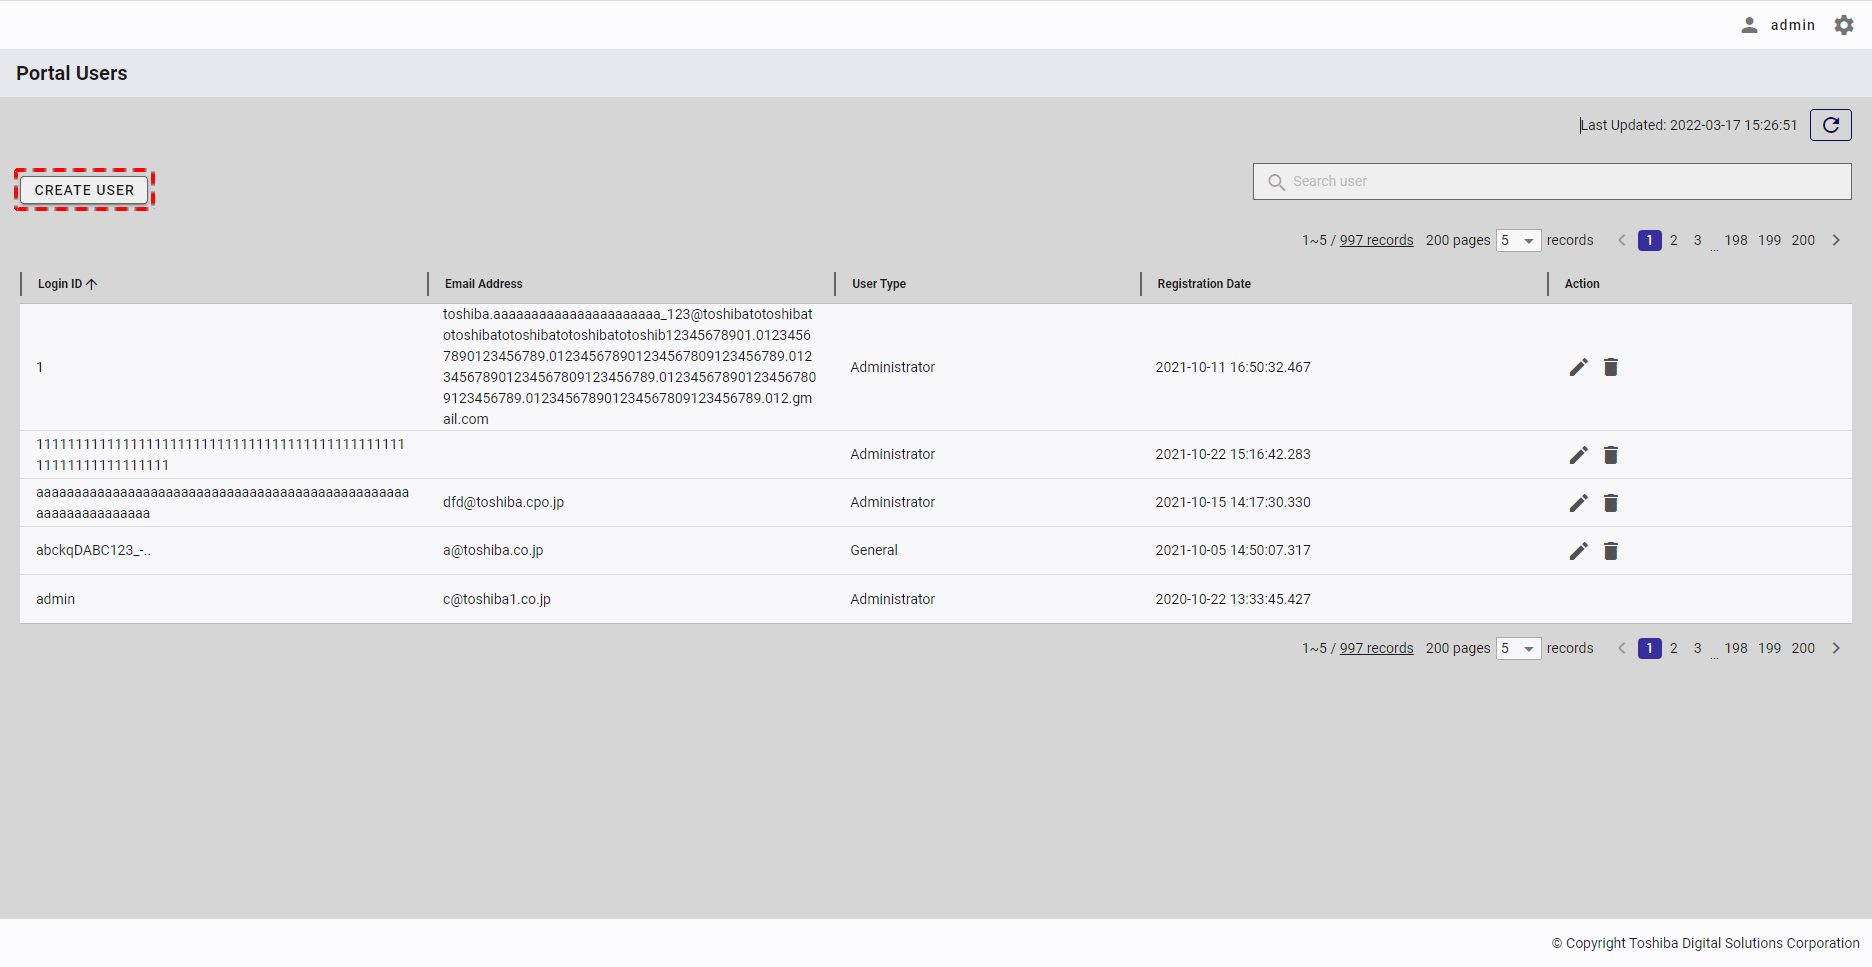
[Note]: You can create up to 1000 users. The [CREATE USER] button will be disabled if there are already 1000 users on the list.
Step 2: When the Create User dialog is displayed, enter user information in the [Login ID] and [Email Address] (optional) fields, choose the user type (Administrator/General), and type the password in the [Password] and [Retype Password] fields (①). You can see your password in plain text by clicking the [Show/Hide] button (②). You can click the [Password conditions] tab (③) to show/hide the conditions for the password of a new user.
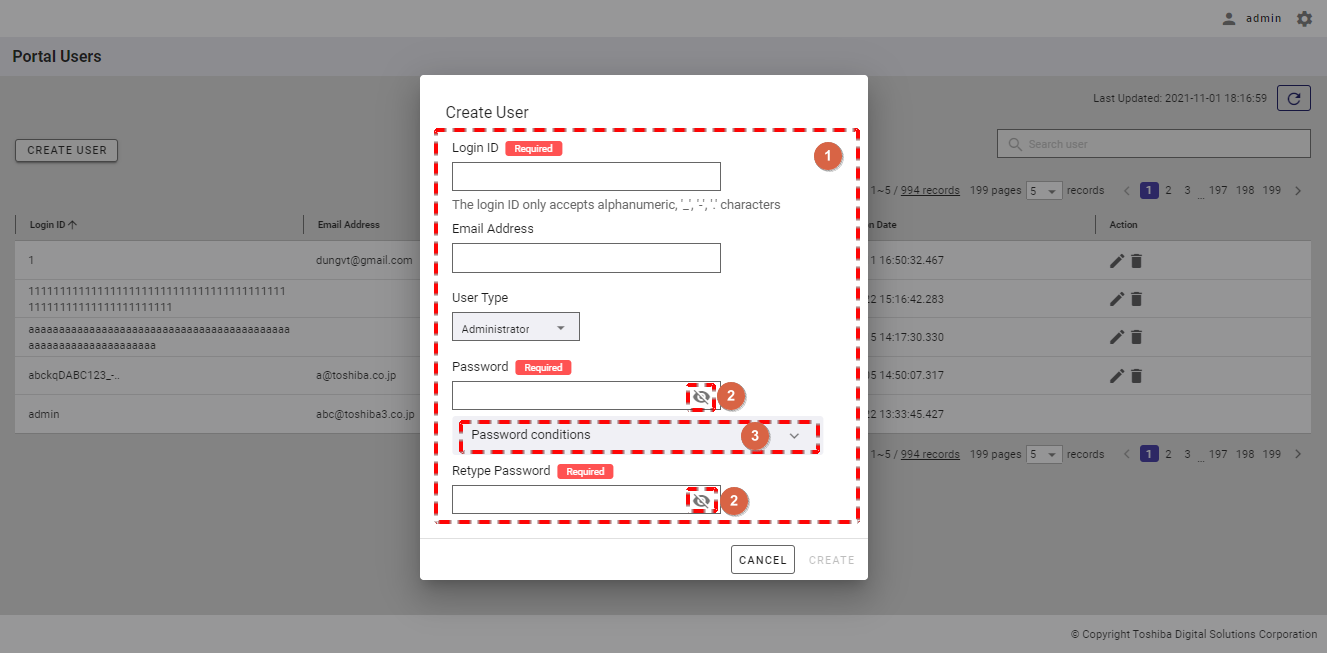
Step 3: After filling in all information, click the [CREATE] button to create the user. If you do not want to create the user, click the [CANCEL] button to close the dialog and return to the user list screen.
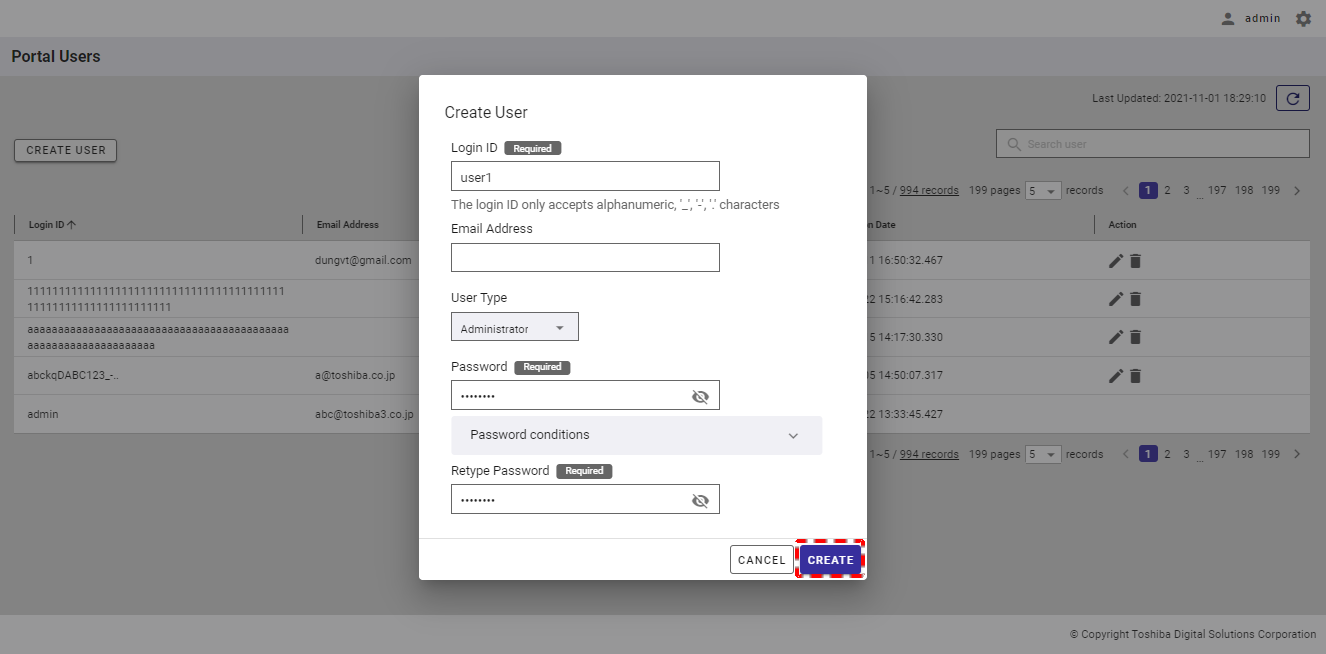
[Note]: The new password and the retyped password must be the same; otherwise, the [CREATE] button will be disabled.
4.9.4 Editing user information
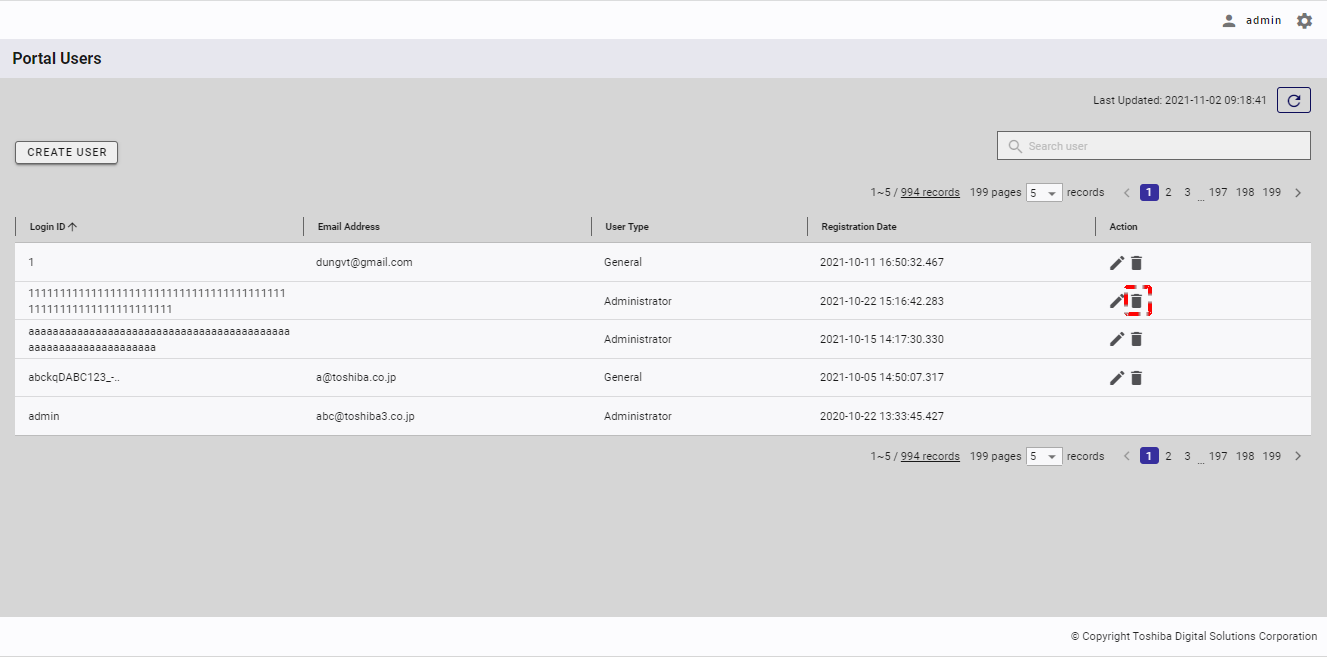
Step 1: To edit user information, click the [EDIT] button in the [Action] column in the user management screen.
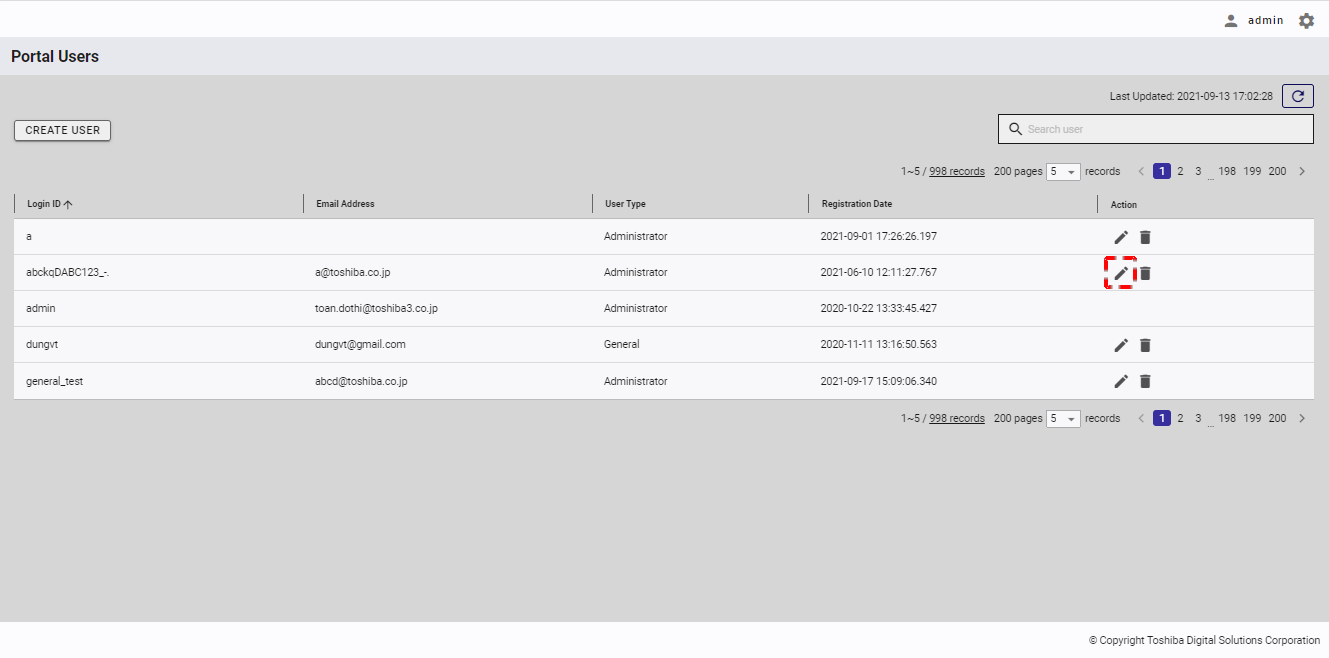
[Note]: You cannot edit the information on a user who is currently logged in.
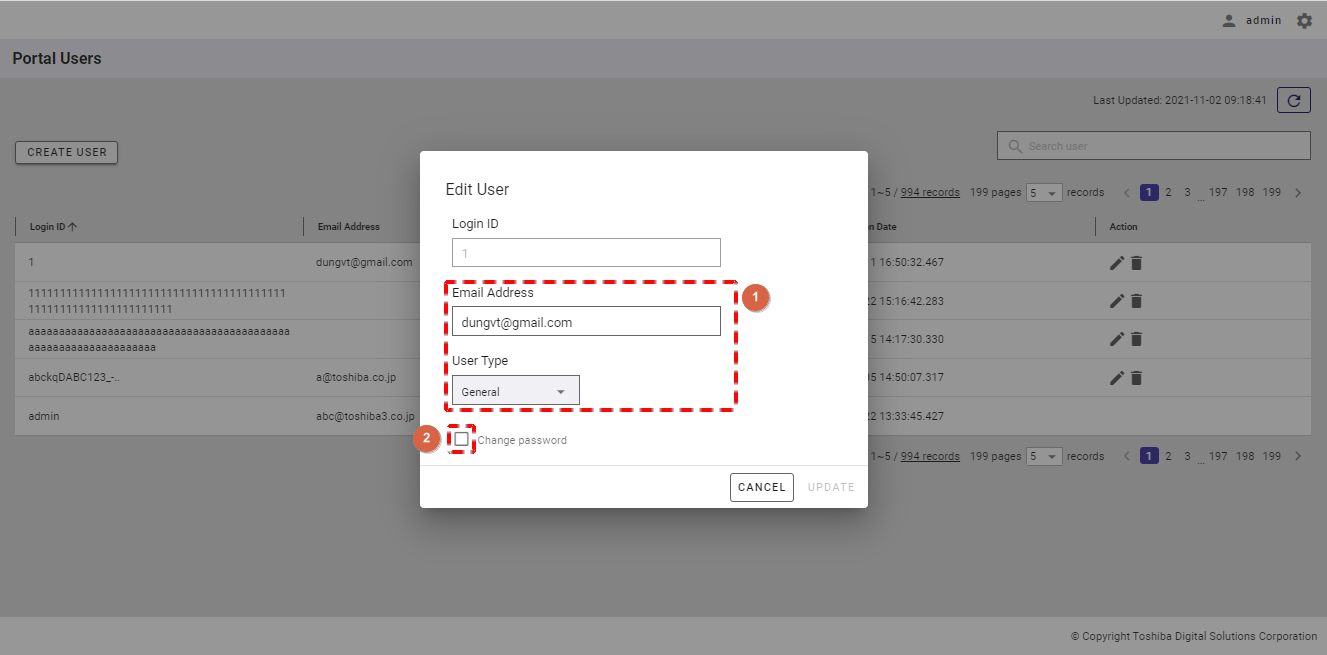
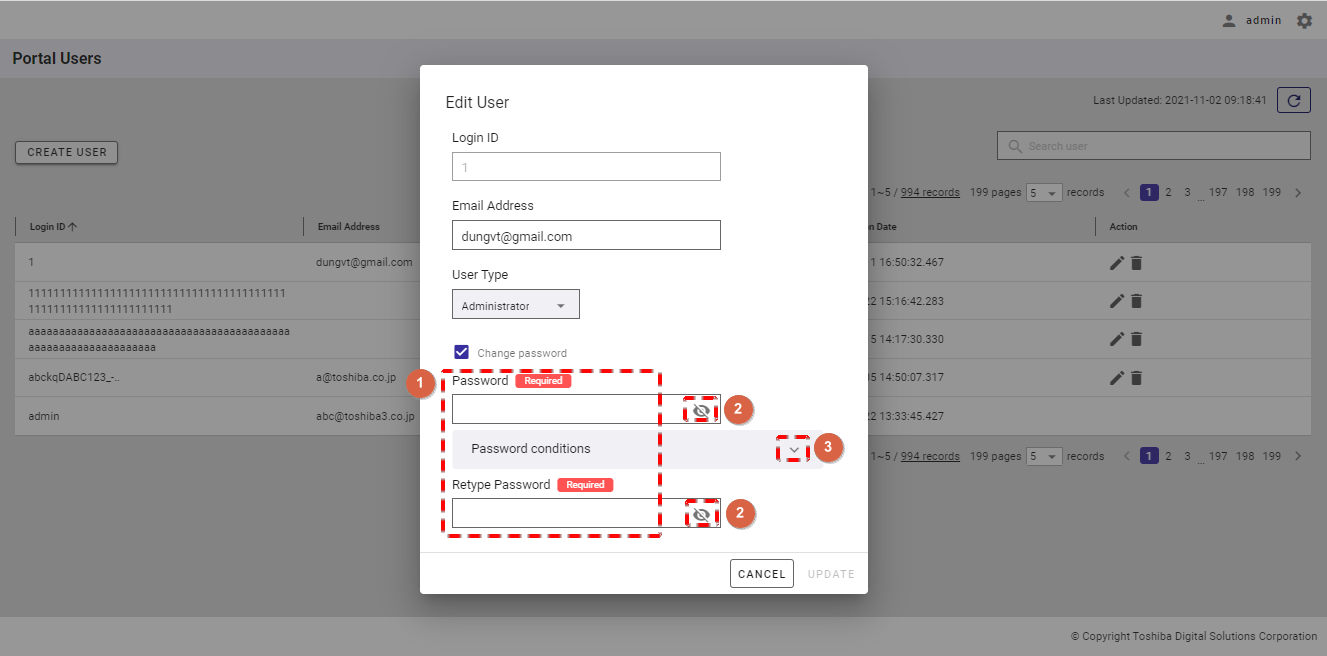
Step 2: When Edit User dialog is displayed, you can change the email address and user type (①). You can also change the password by checking the [Change password] checkbox (②).
Step 3: Finally, click the [UPDATE] button. If you do not want to edit the user information, click the [CANCEL] button to close the dialog and return to the user list screen.
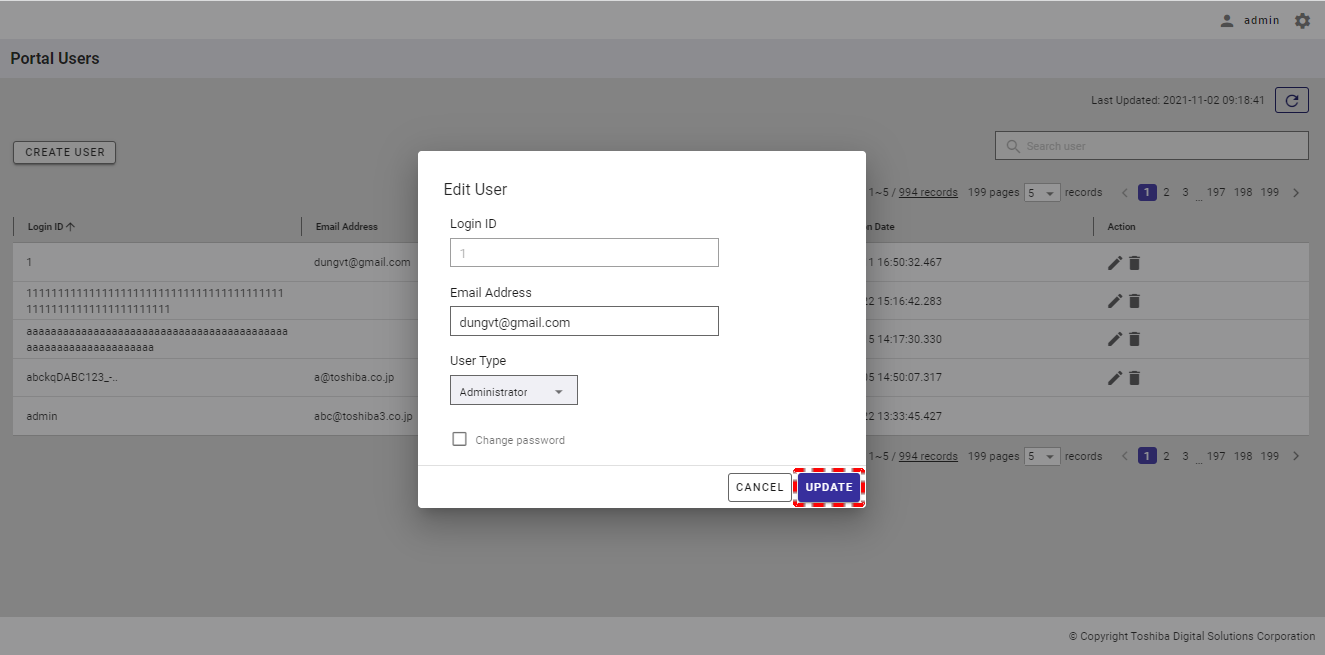
[Note]: The [UPDATE] button is enabled only when the user enters information other than the current information.
4.9.5 Changing the user password
Step 1: To change the password, click the [Change password] checkbox in the Edit User dialog. For details, see Editing user information. Then, enter a new password in the [Password] and [Retype Password] fields (①). You can see your password in plain text by clicking the [Show/Hide] button (②). You can click the [Password conditions] tab (③) to show/hide the conditions for a user password.
Step 2: Finally, click the [UPDATE] button. If you do not want to edit the user information, click the [CANCEL] button to close the dialog and return to the user list screen.
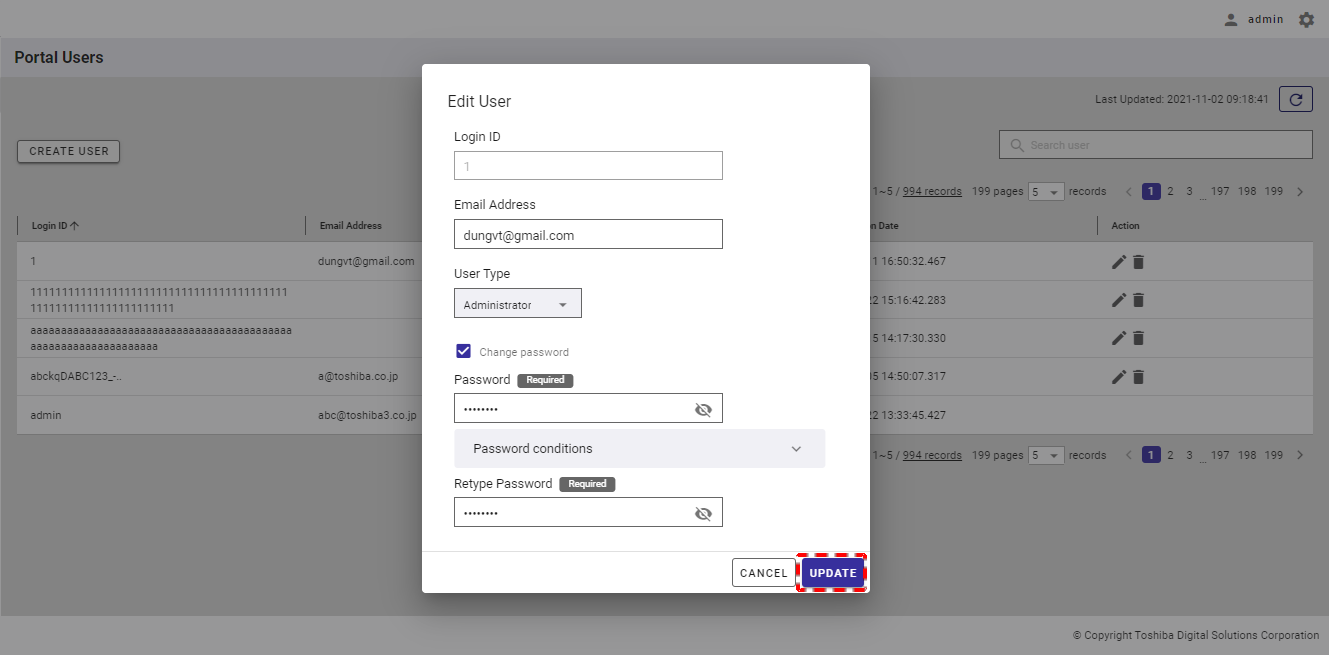
[Note]: The [UPDATE] button is enabled only when the user enters information other than the current information and the new password and the retyped password are the same.
4.9.6 Deleting a user
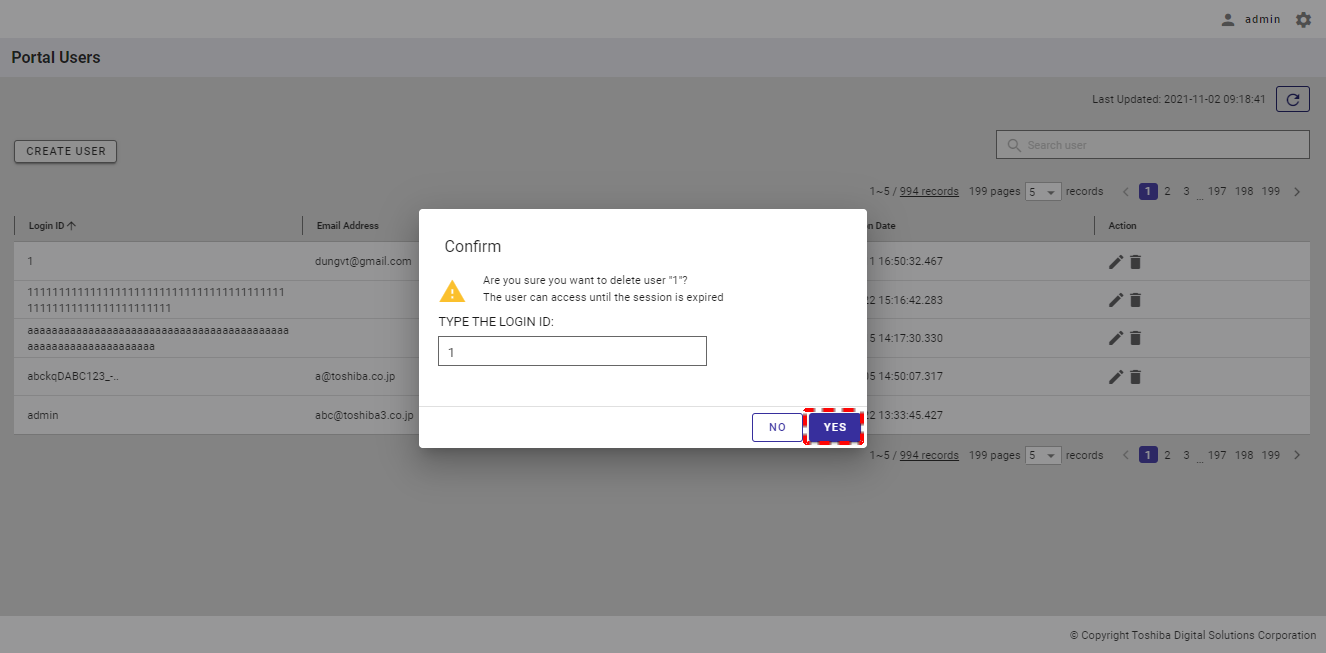
Step 1: In the user management screen, click the [DELETE] button in the [Action] column to delete a user.
Step 2: When the confirmation dialog is displayed, enter the login ID of the user into the text field to confirm deletion.
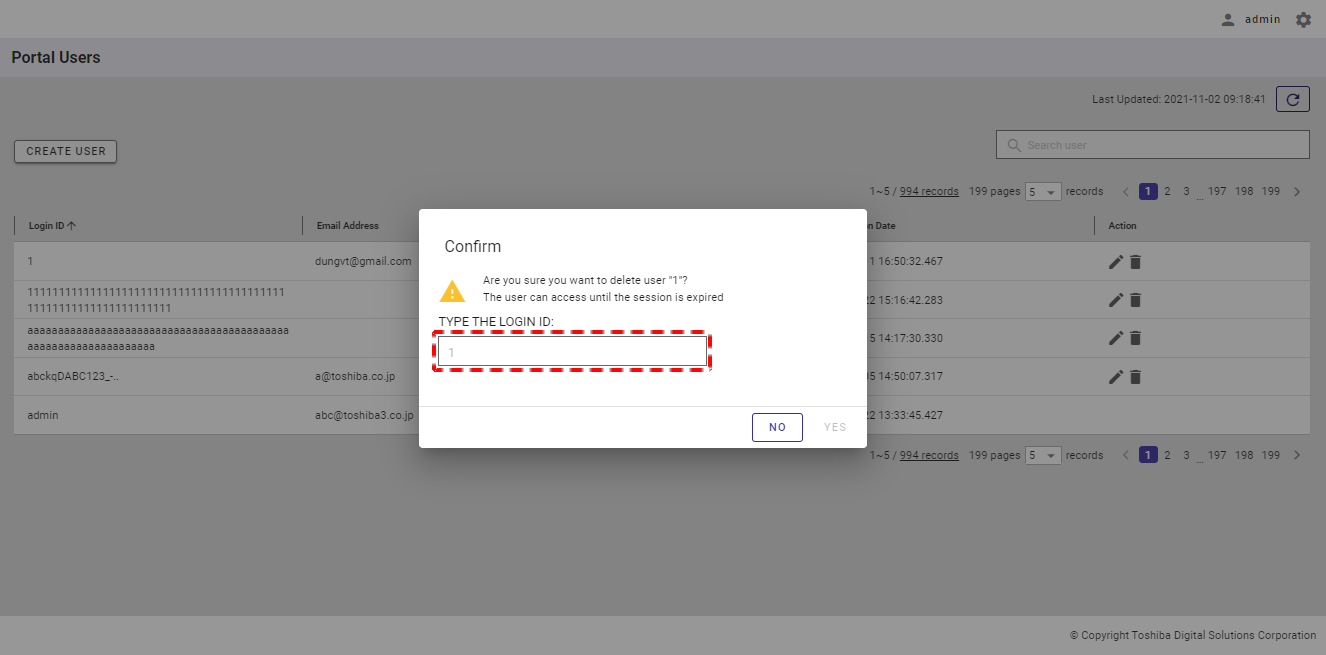
Step 3: Click the [YES] button to delete the user. If you do not want to delete the user, click the [NO] button to close the dialog and return to the user list screen.
4.10 User information function
This function is used for displaying your account details and editing your information (for example, changing your password and email).
4.10.1 Available roles
In the table below, the role with a plus sign (+) can use the function on the left.
| No. | Function | General user | Administrator user |
|---|---|---|---|
| 1 | Change the user password | + | + |
| 2 | Change the user email | + | + |
4.10.2 Displaying user details
To see your account details, click the account icon at the top of the right screen.
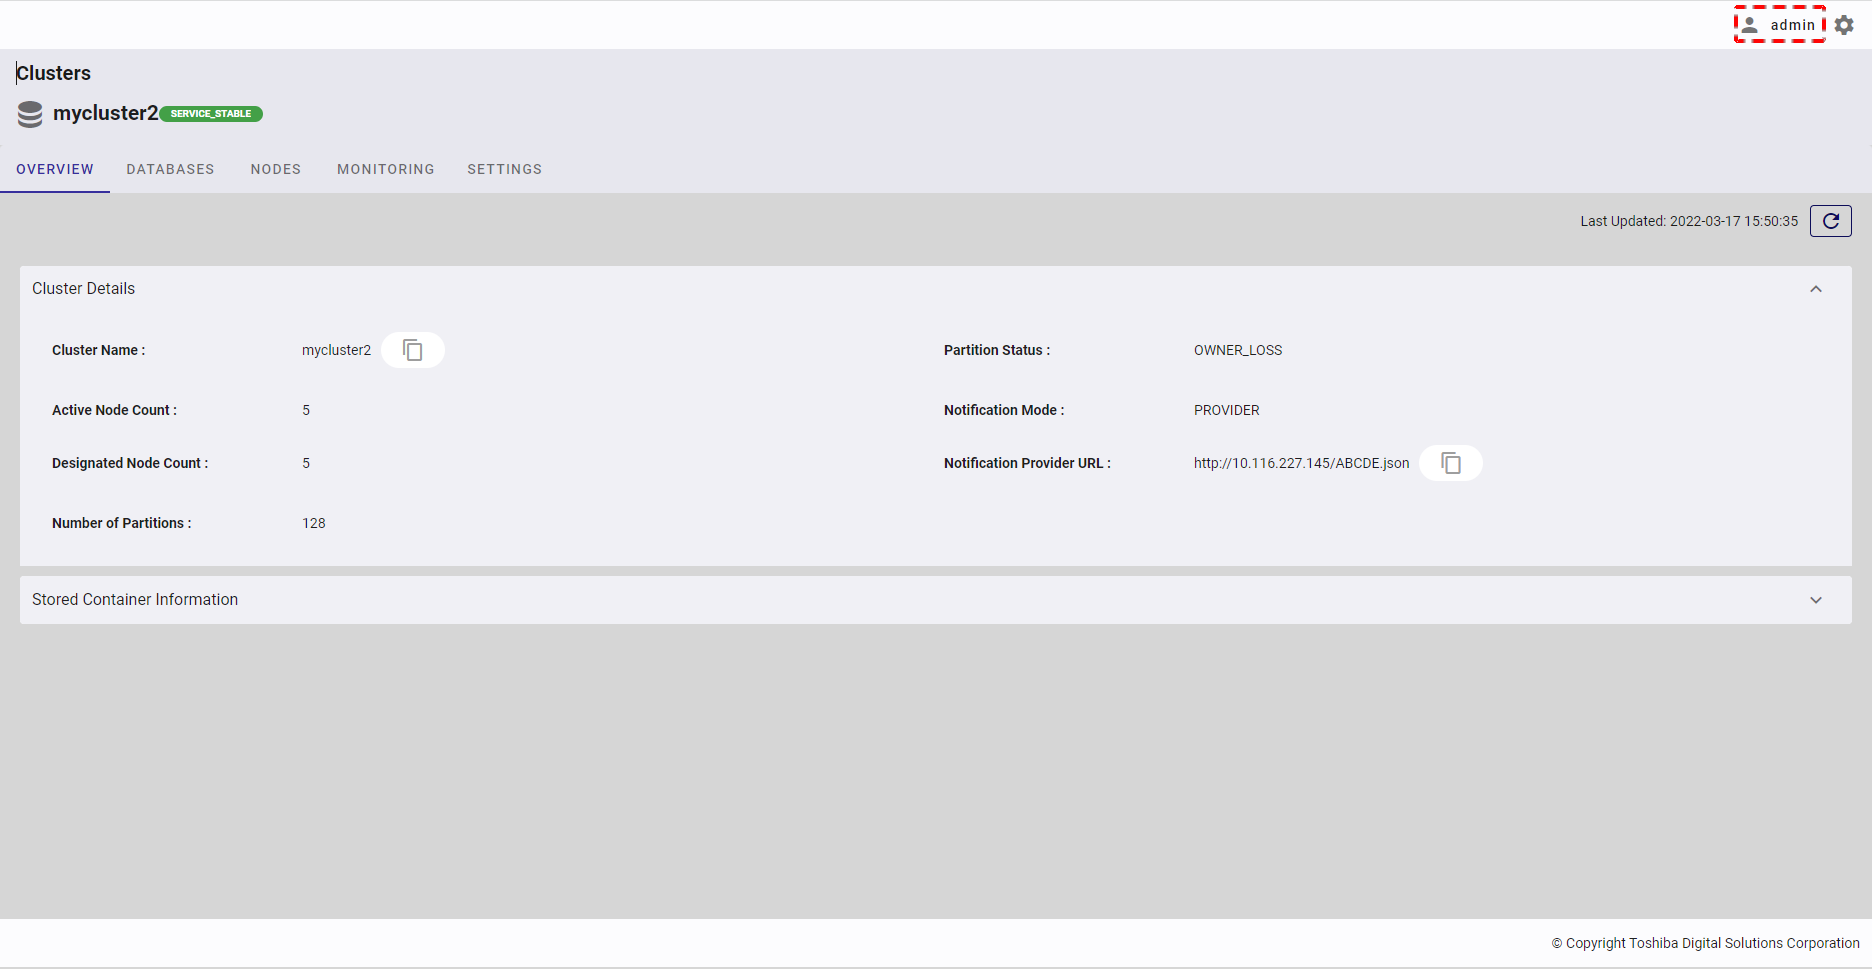
The system will display the user information screen.
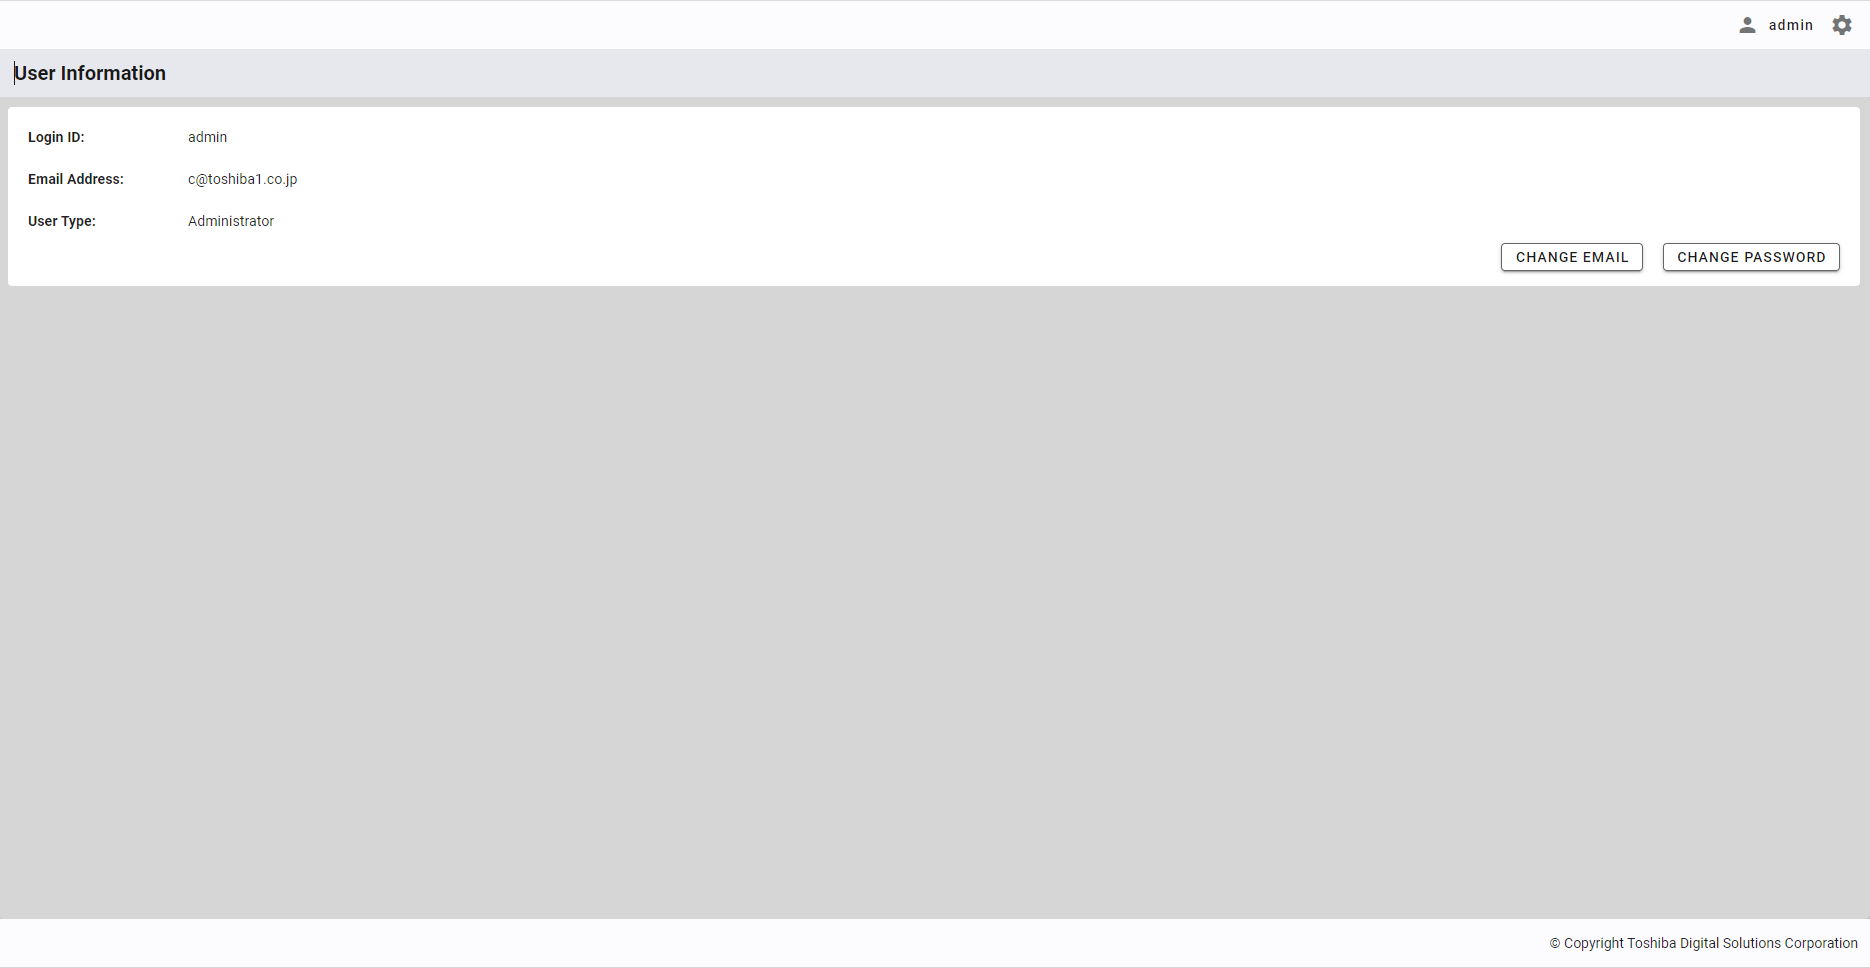
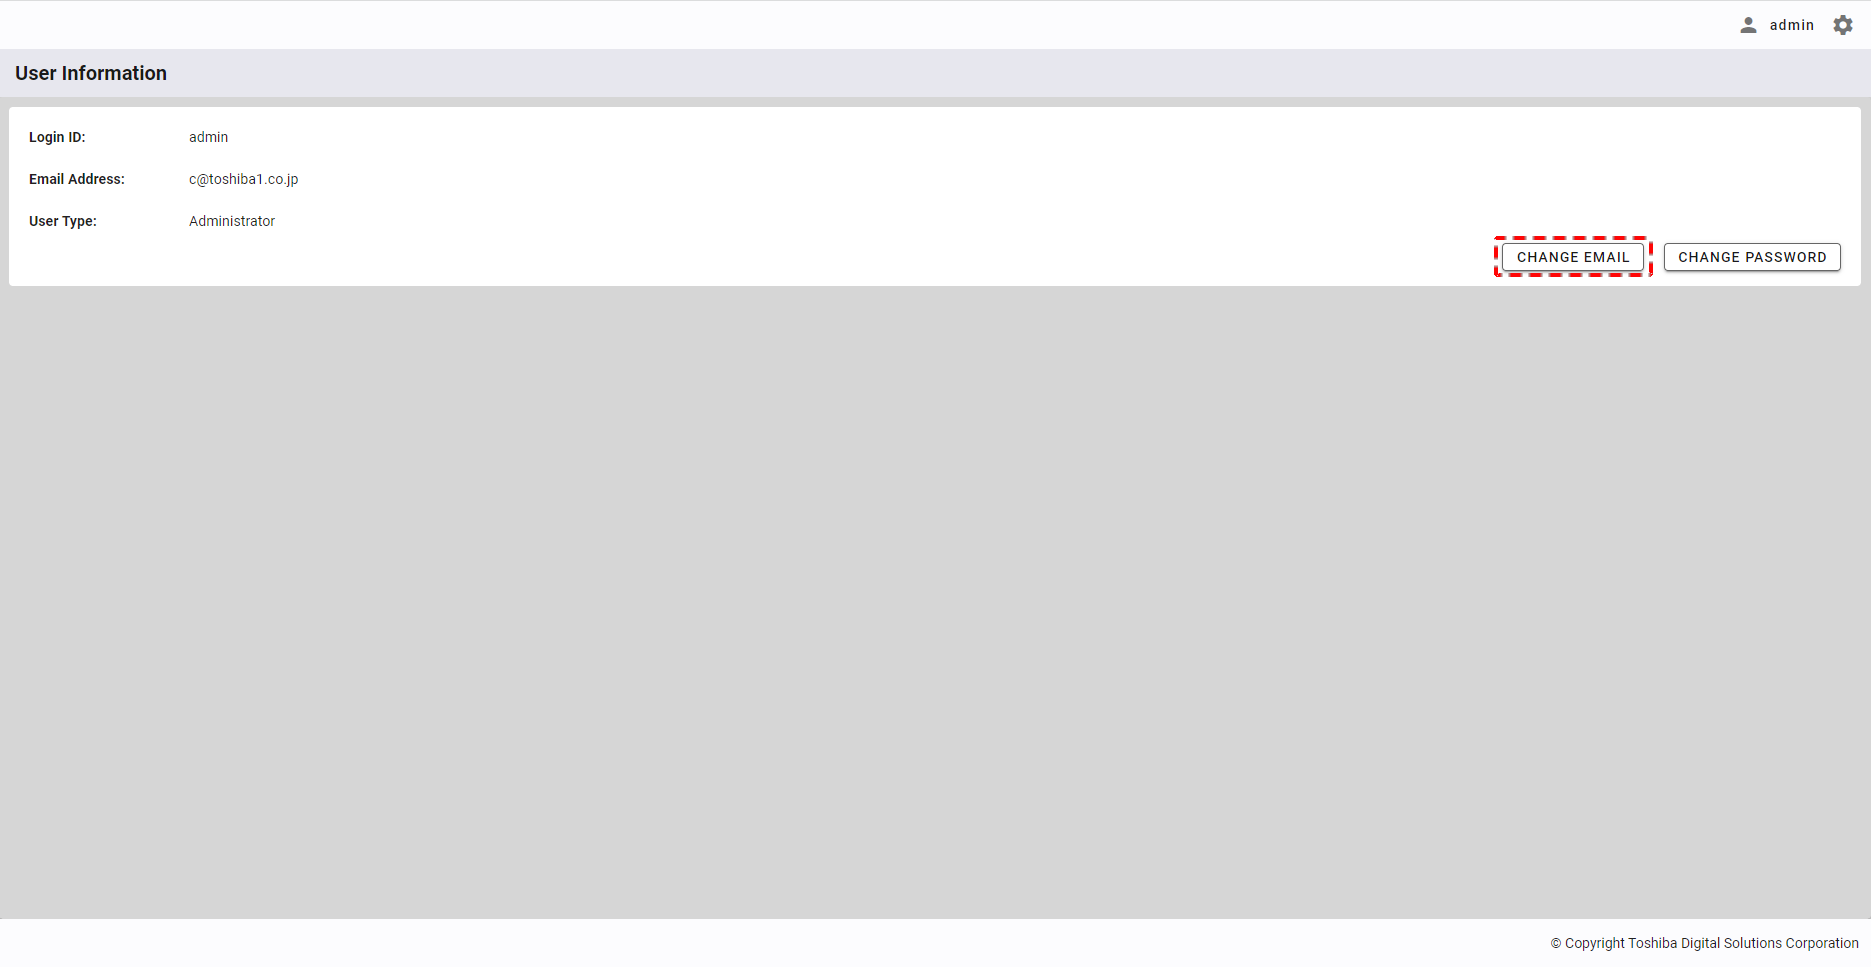
4.10.3 Changing your user email
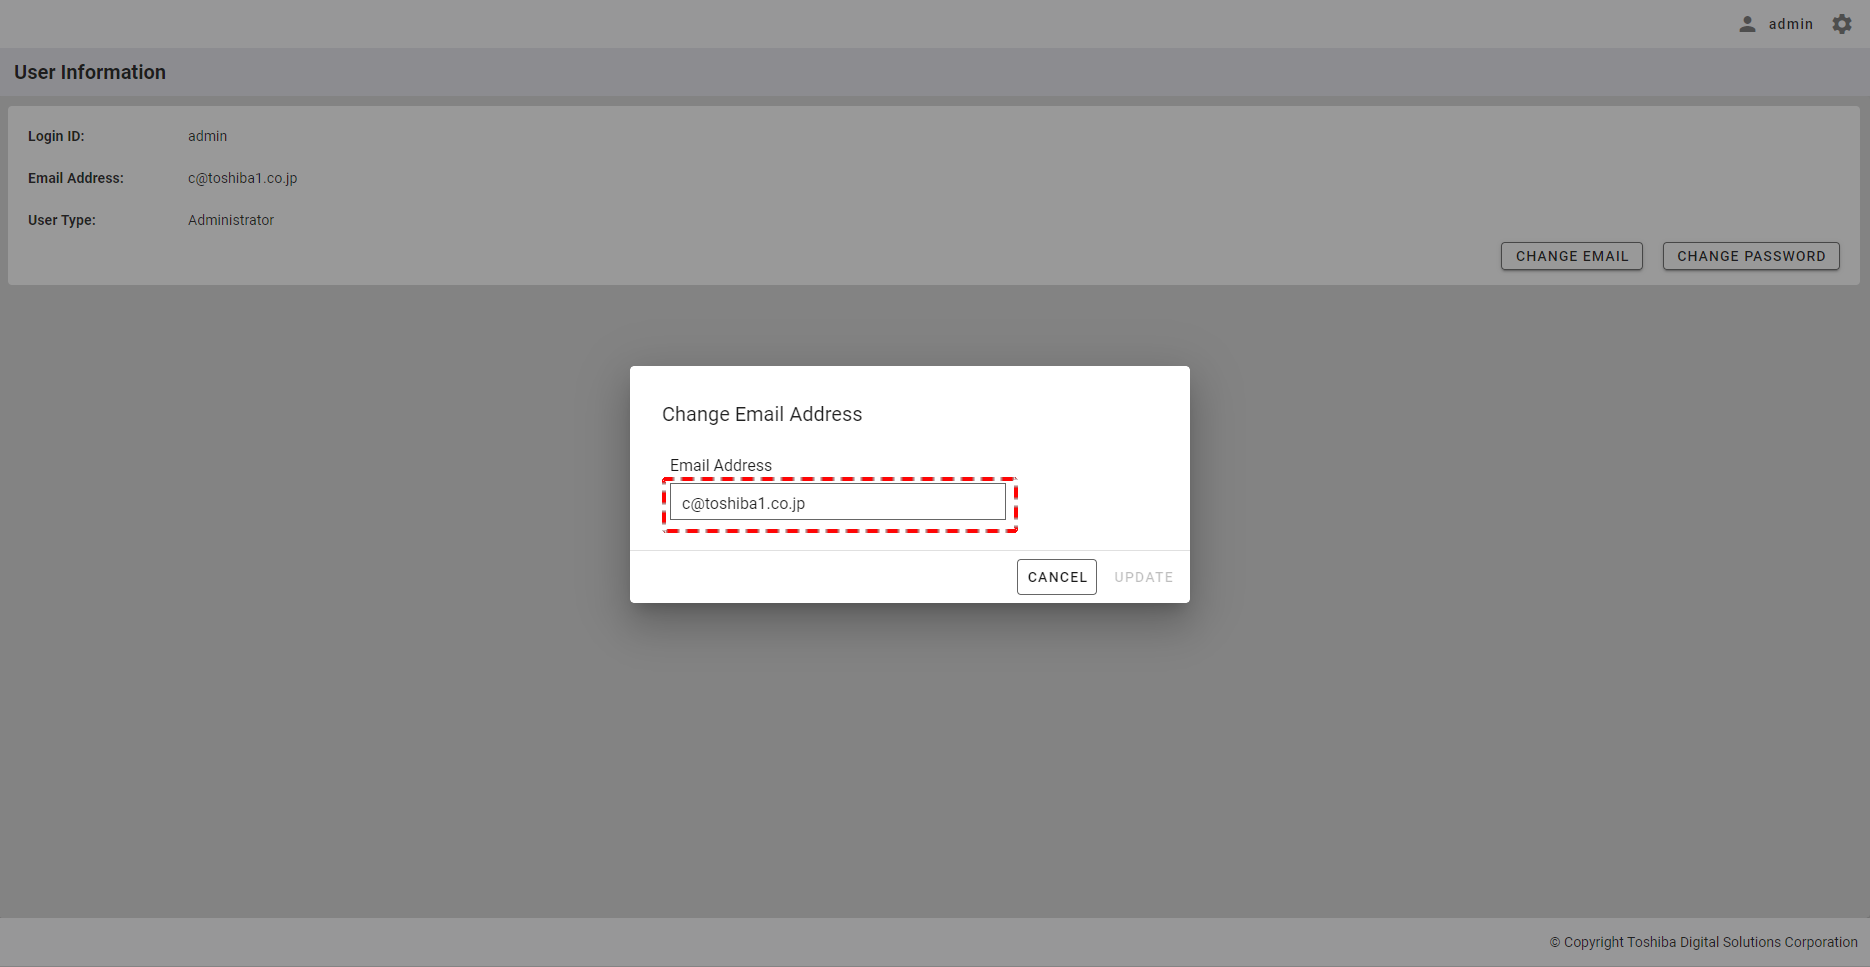
Step 1: To change your user email, click the [CHANGE EMAIL] button.
Step 2: Enter a new user email in the Email Address text box.
Step 3: Click the [UPDATE] button to change your user email. Or click the [CANCEL] button to go back to the user information screen without changing your user email.
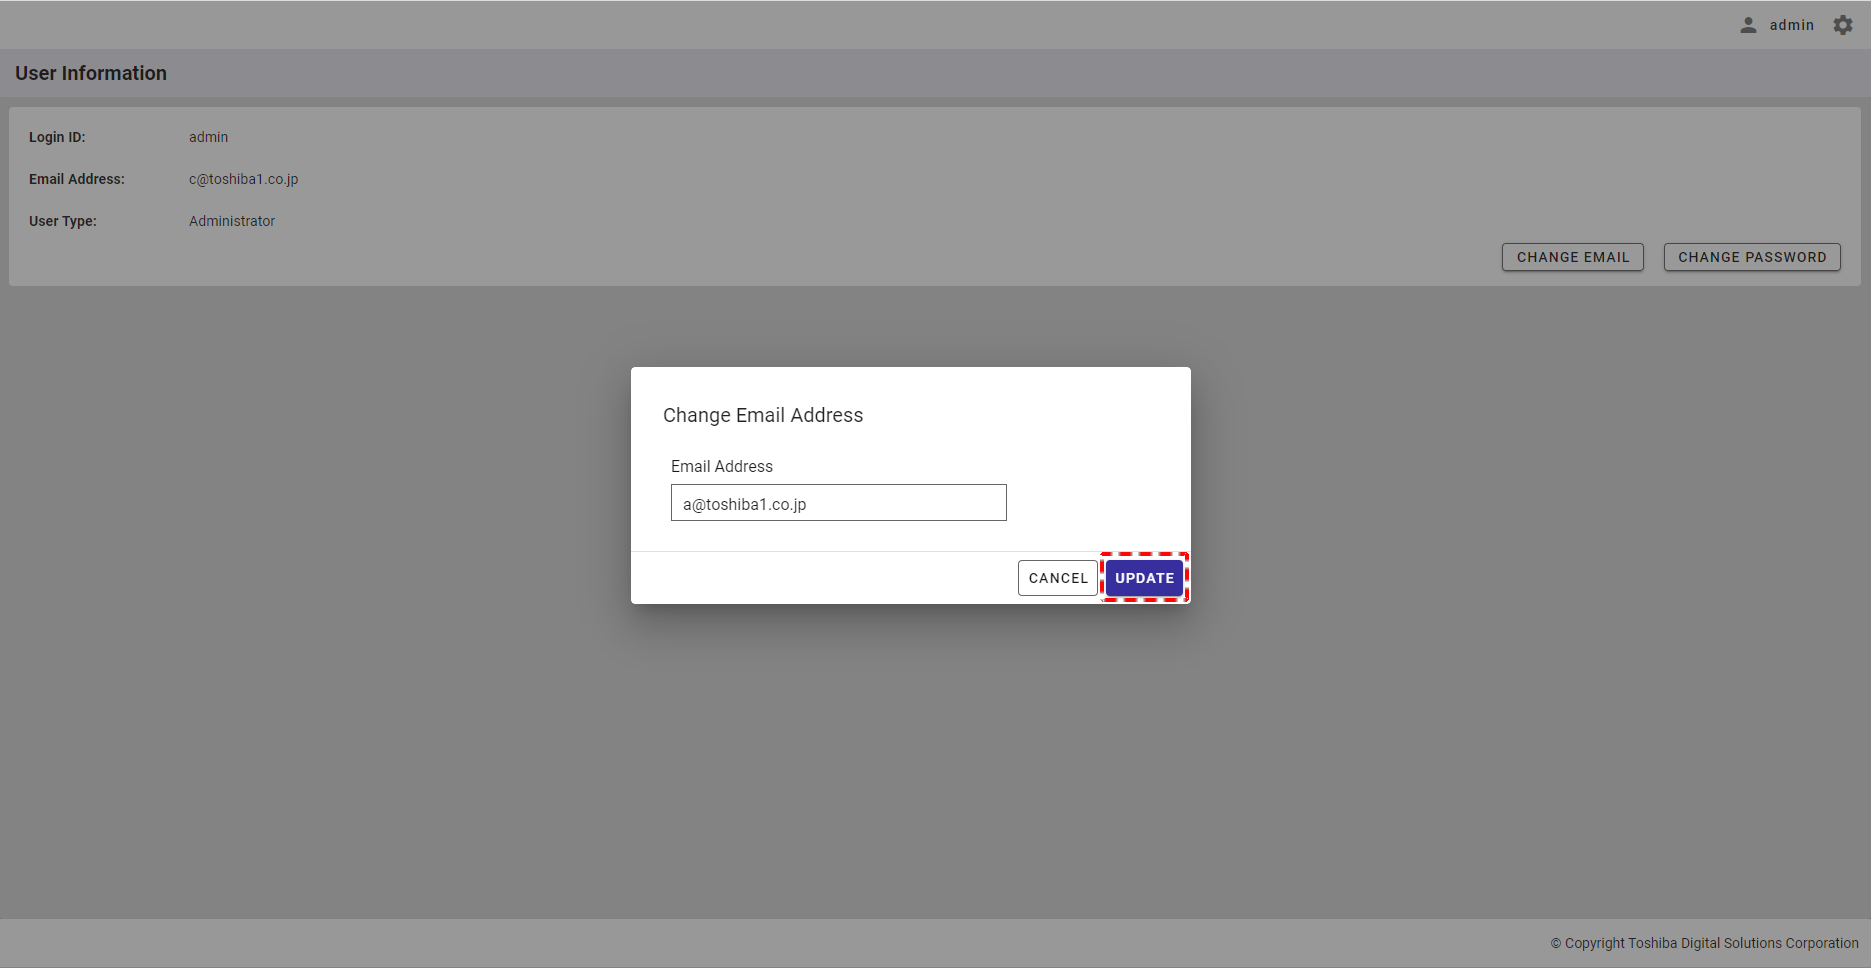
[Note]: The [UPDATE] button is enabled only when you input an email other than the current email.
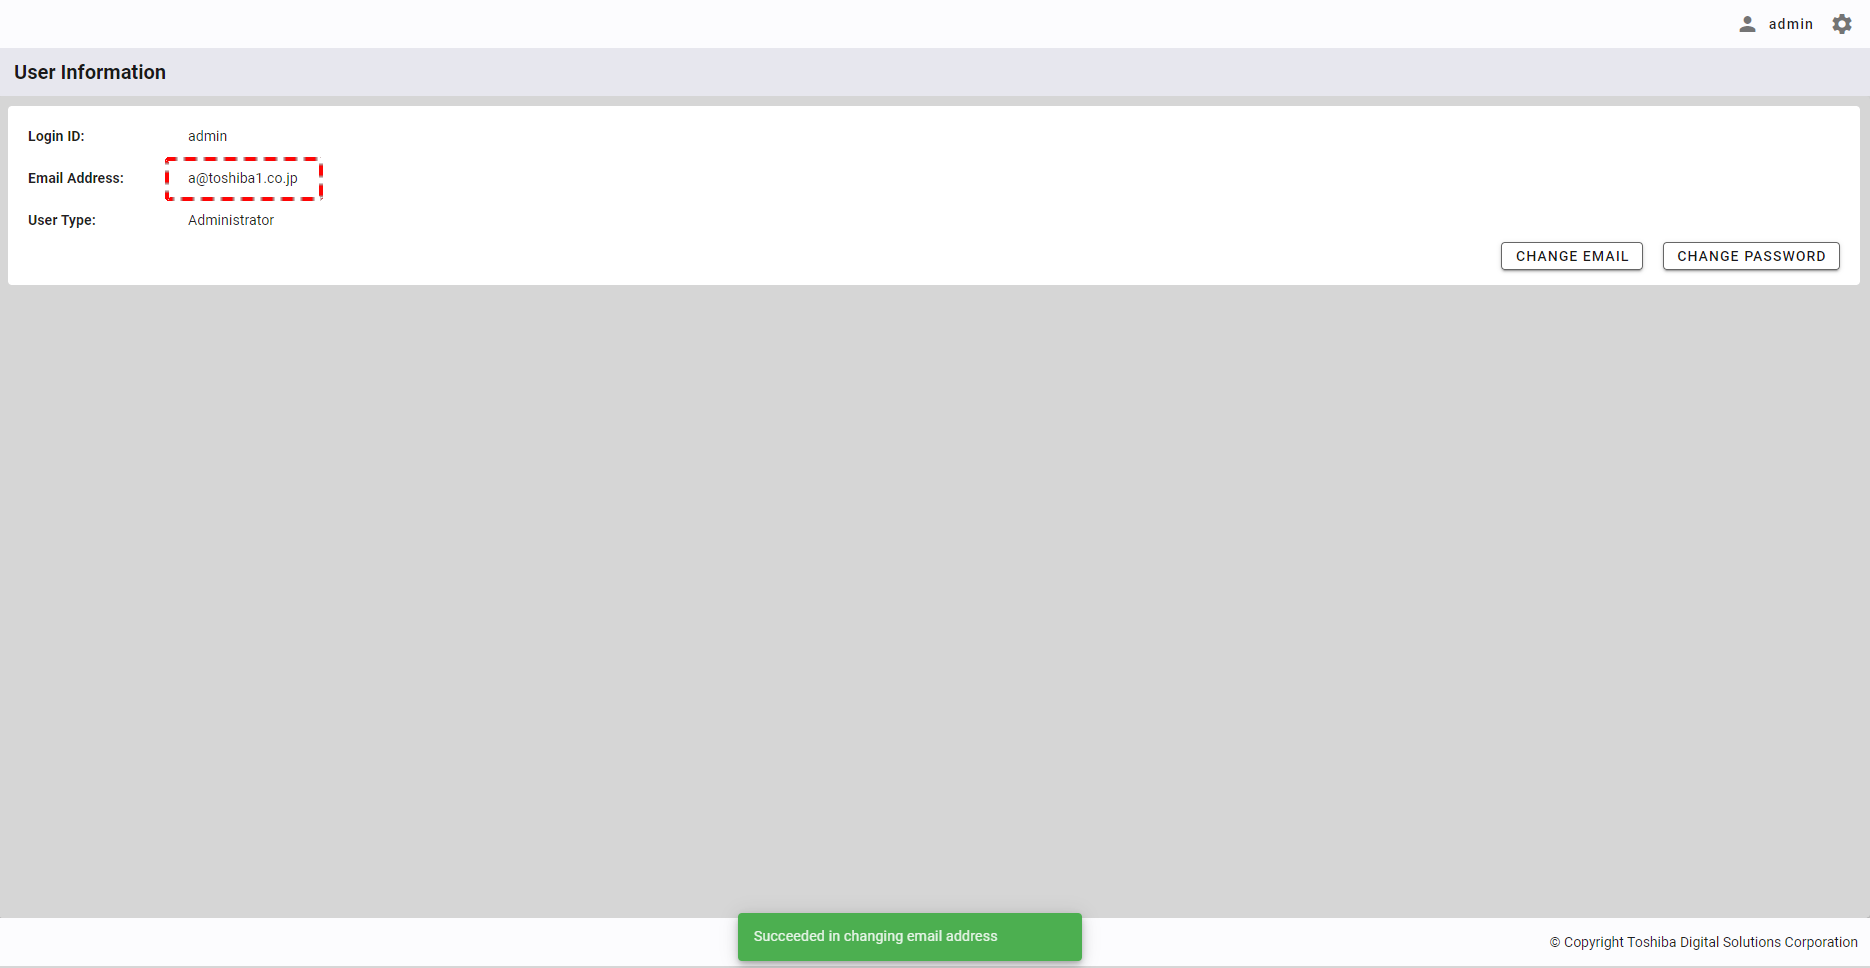
A new user email will be updated in the user information screen.
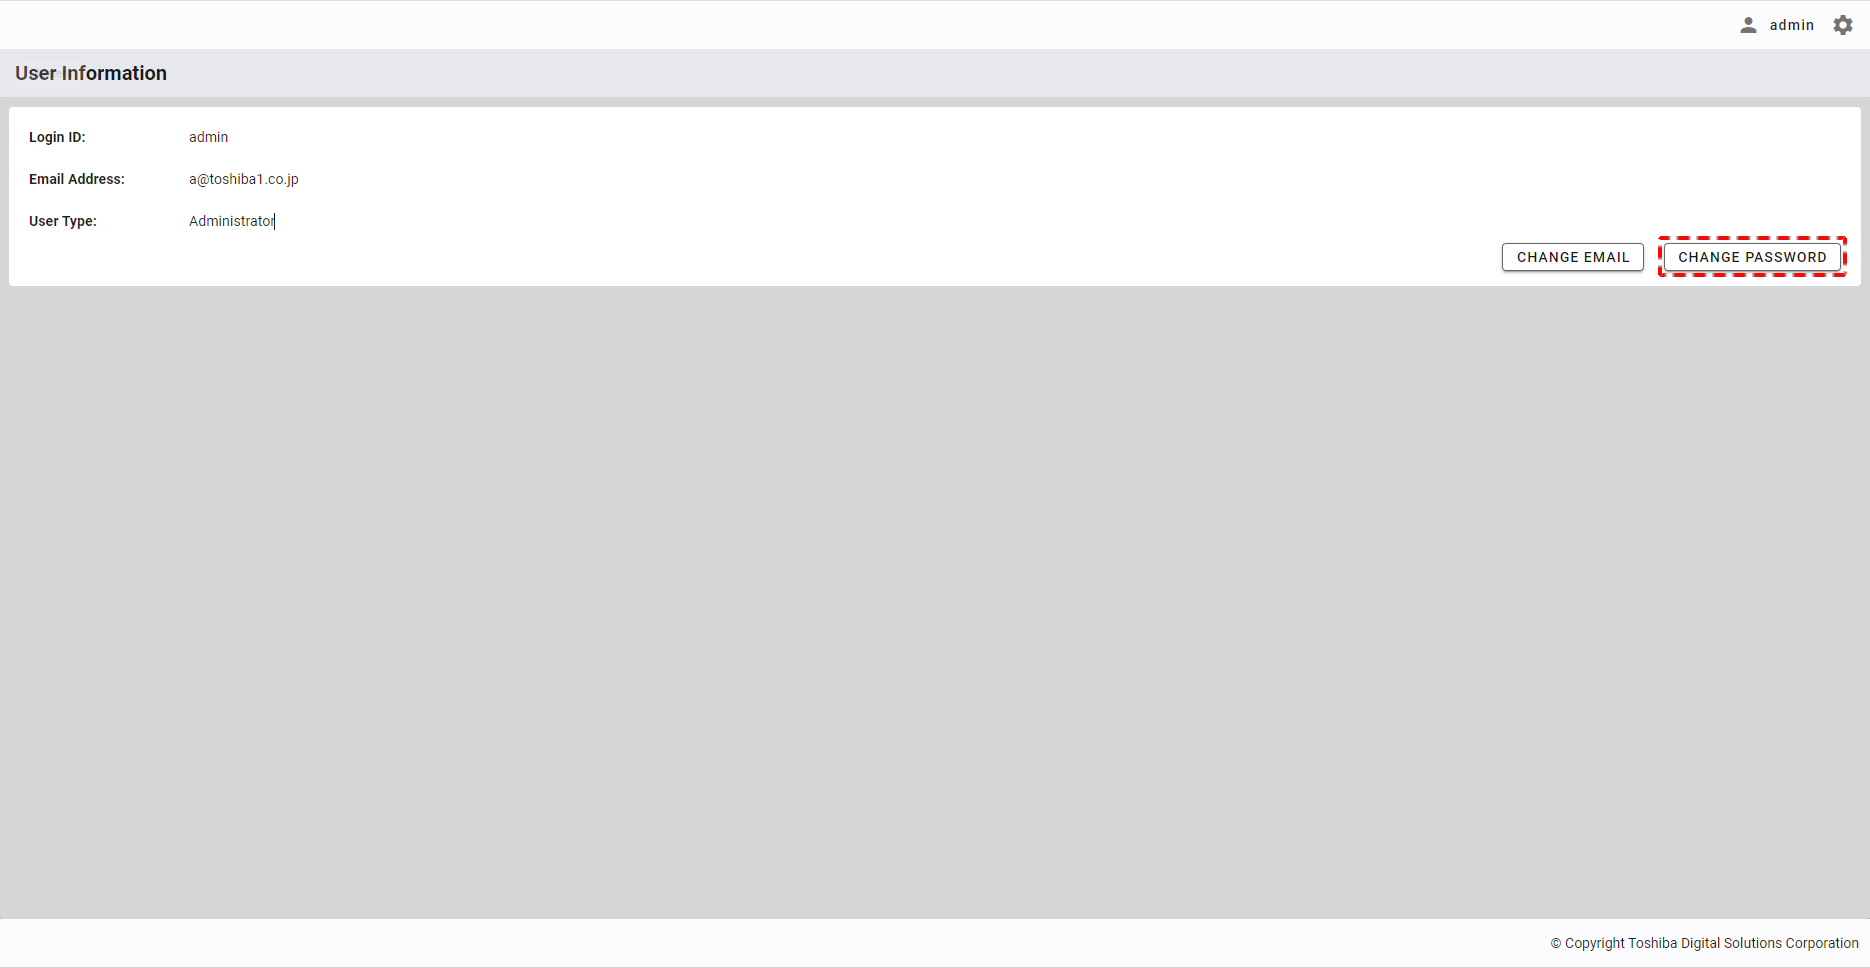
4.10.4 Changing your user password
Step 1: To change your user password, click the [CHANGE PASSWORD] button.
Step 2: Enter a new user password:
- Enter the current password in the text box (①) and a new password in the text box (②), and retype the new password in the text box (③).
- You can check the passwords you entered by clicking the show/hide buttons (④).
- You can click the [New password conditions] tab (⑤) to show/hide the conditions for a new user password.
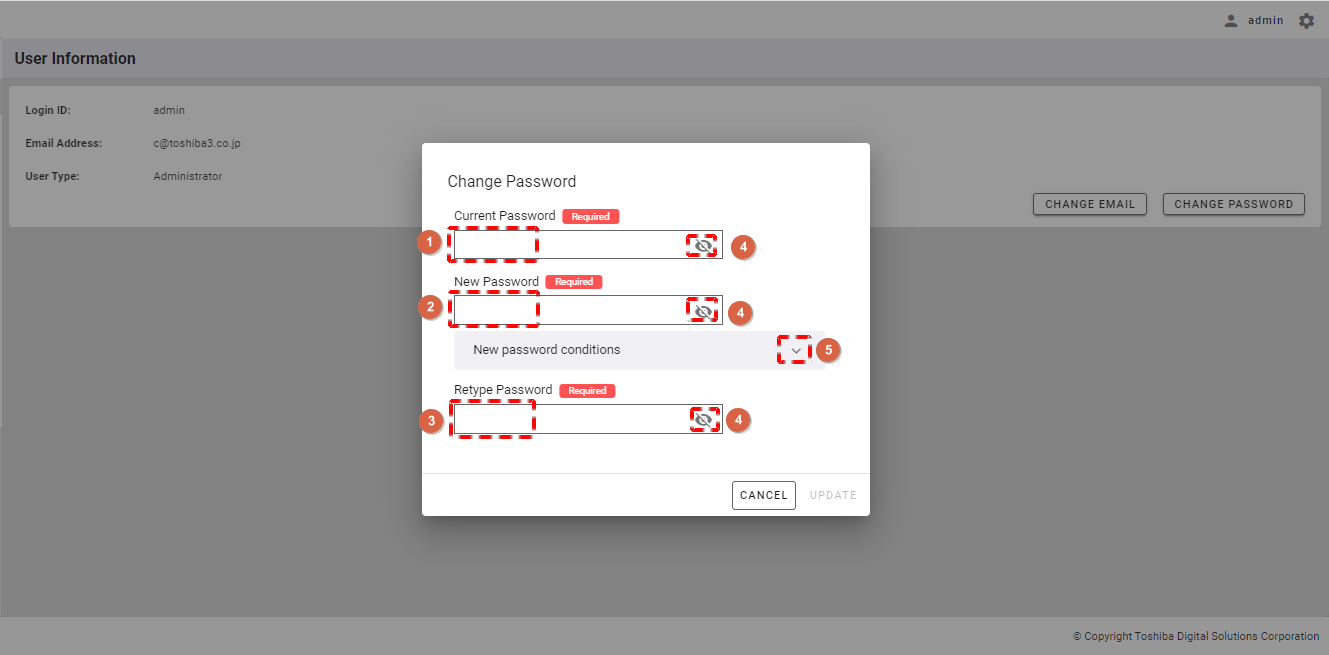
[Note]: The new password and the retyped password must be the same; otherwise, the [UPDATE] button will be disabled.
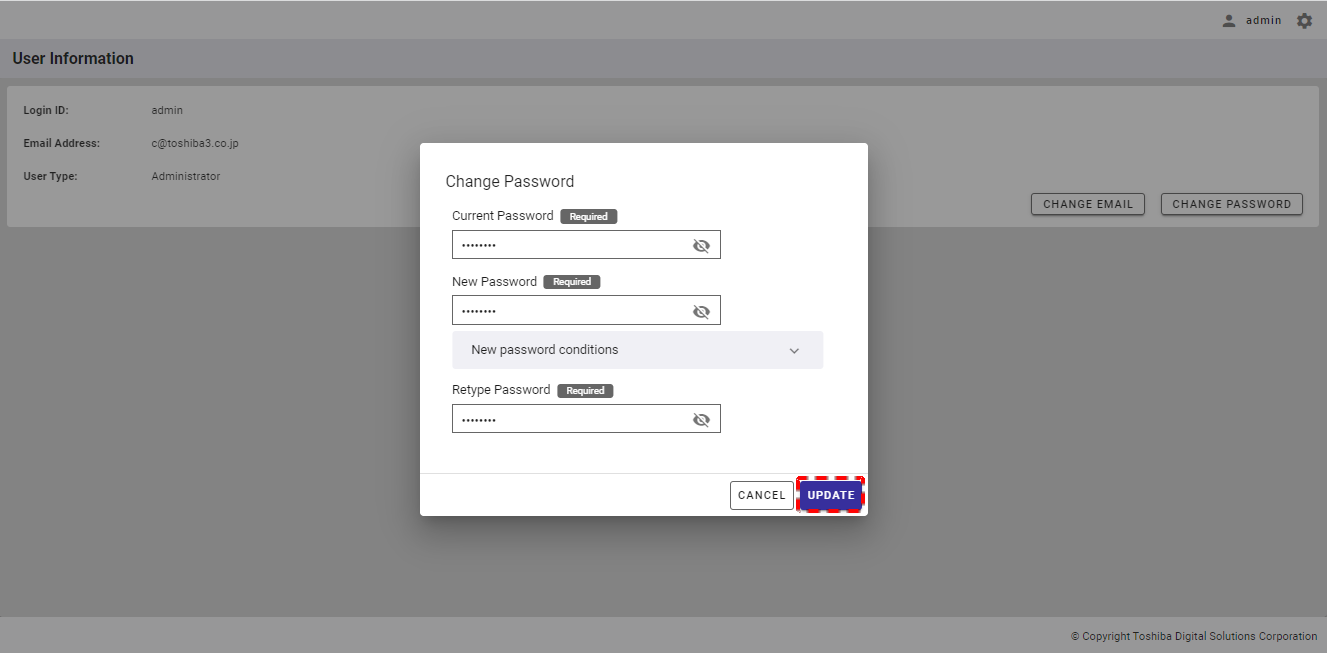
Step 3: After entering a new password, click the [UPDATE] button to change the password for your account. Or click the [CANCEL] button to go back to the user information screen without changing your user password.
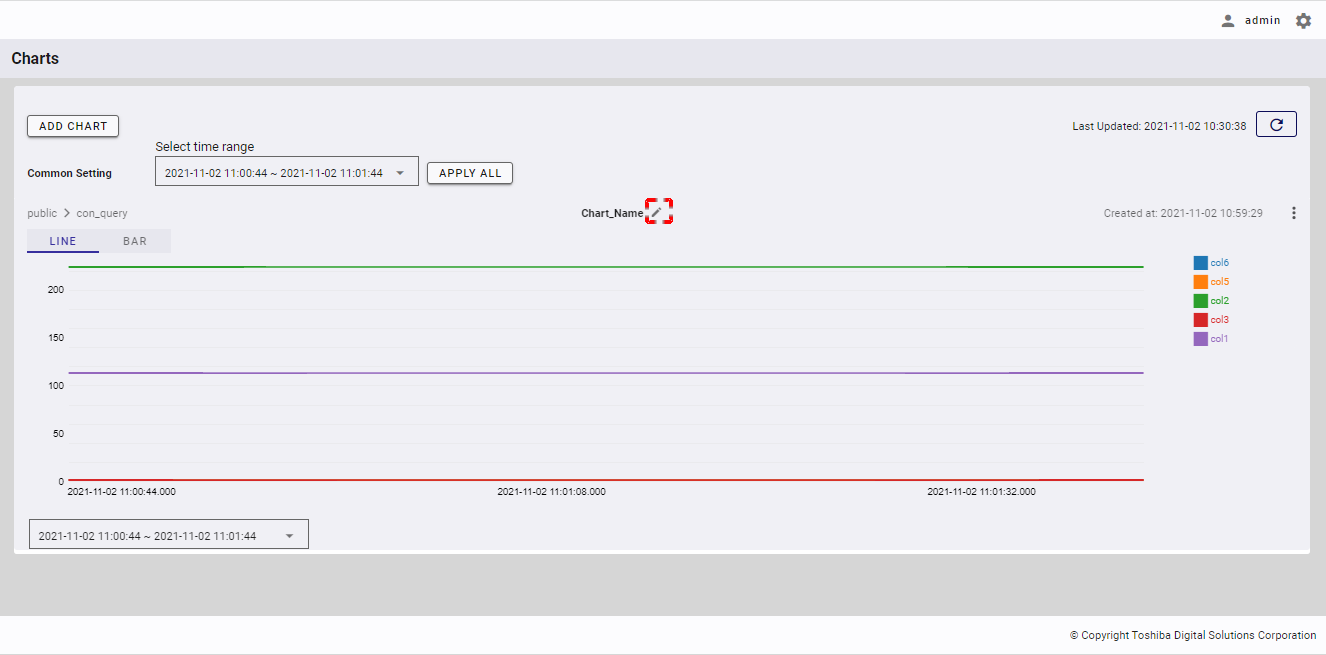
4.11 Chart management function
This function is used for visualizing timeseries data in GridDB. It creates charts based on timeseries data in a container and on a time range. There are two types of visualization charts: Line chart and Bar chart. The chart settings (e.g., time range selection, chart name, date and time the chart was created, database name, container name, and column name) are applied to both Line and Bar charts.
The chart settings will be stored in the local storage of the browser of each logged-in user.
4.11.1 Available roles
In the table below, the role with a plus sign (+) can use the function on the left.
| No. | Function | General user | Administrator user |
|---|---|---|---|
| 1 | Display a chart list | + | + |
| 2 | Add a chart | + | + |
| 3 | Edit a chart | + | + |
| 4 | Delete a chart | + | + |
| 5 | Save a chart as image | + | + |
| 6 | Change the time range | + | + |
| 7 | Rename a chart | + | + |
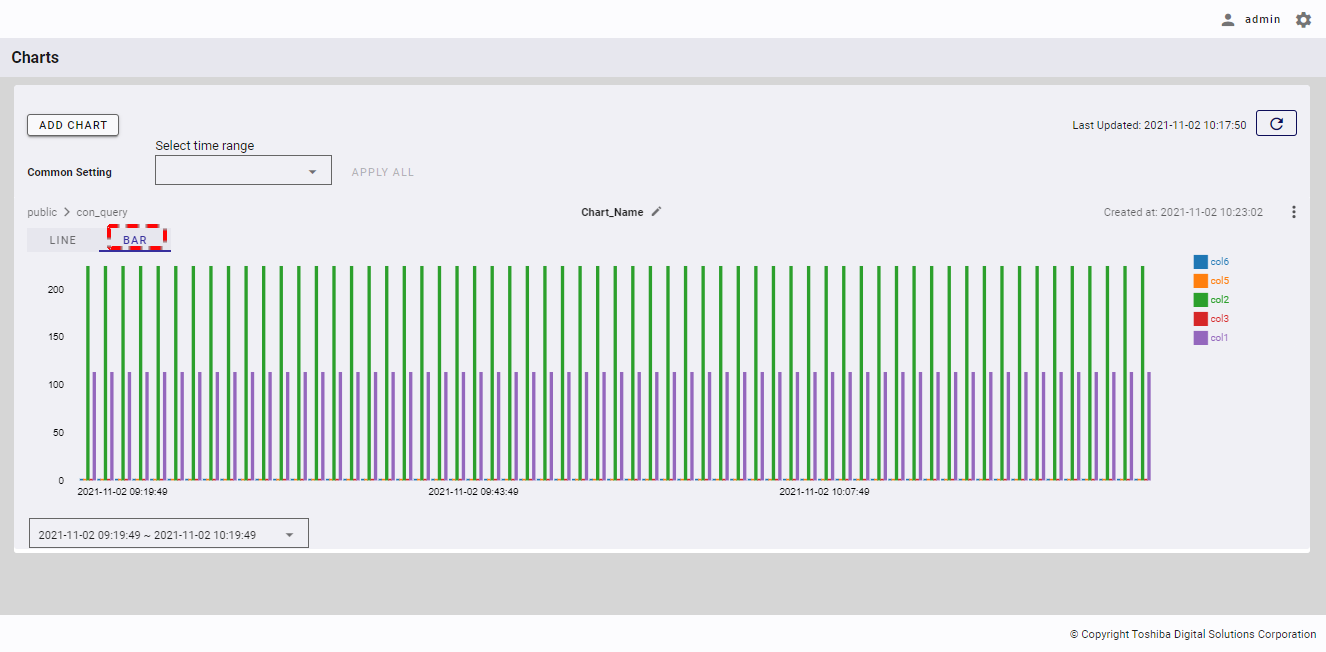
4.11.2 Displaying a chart list
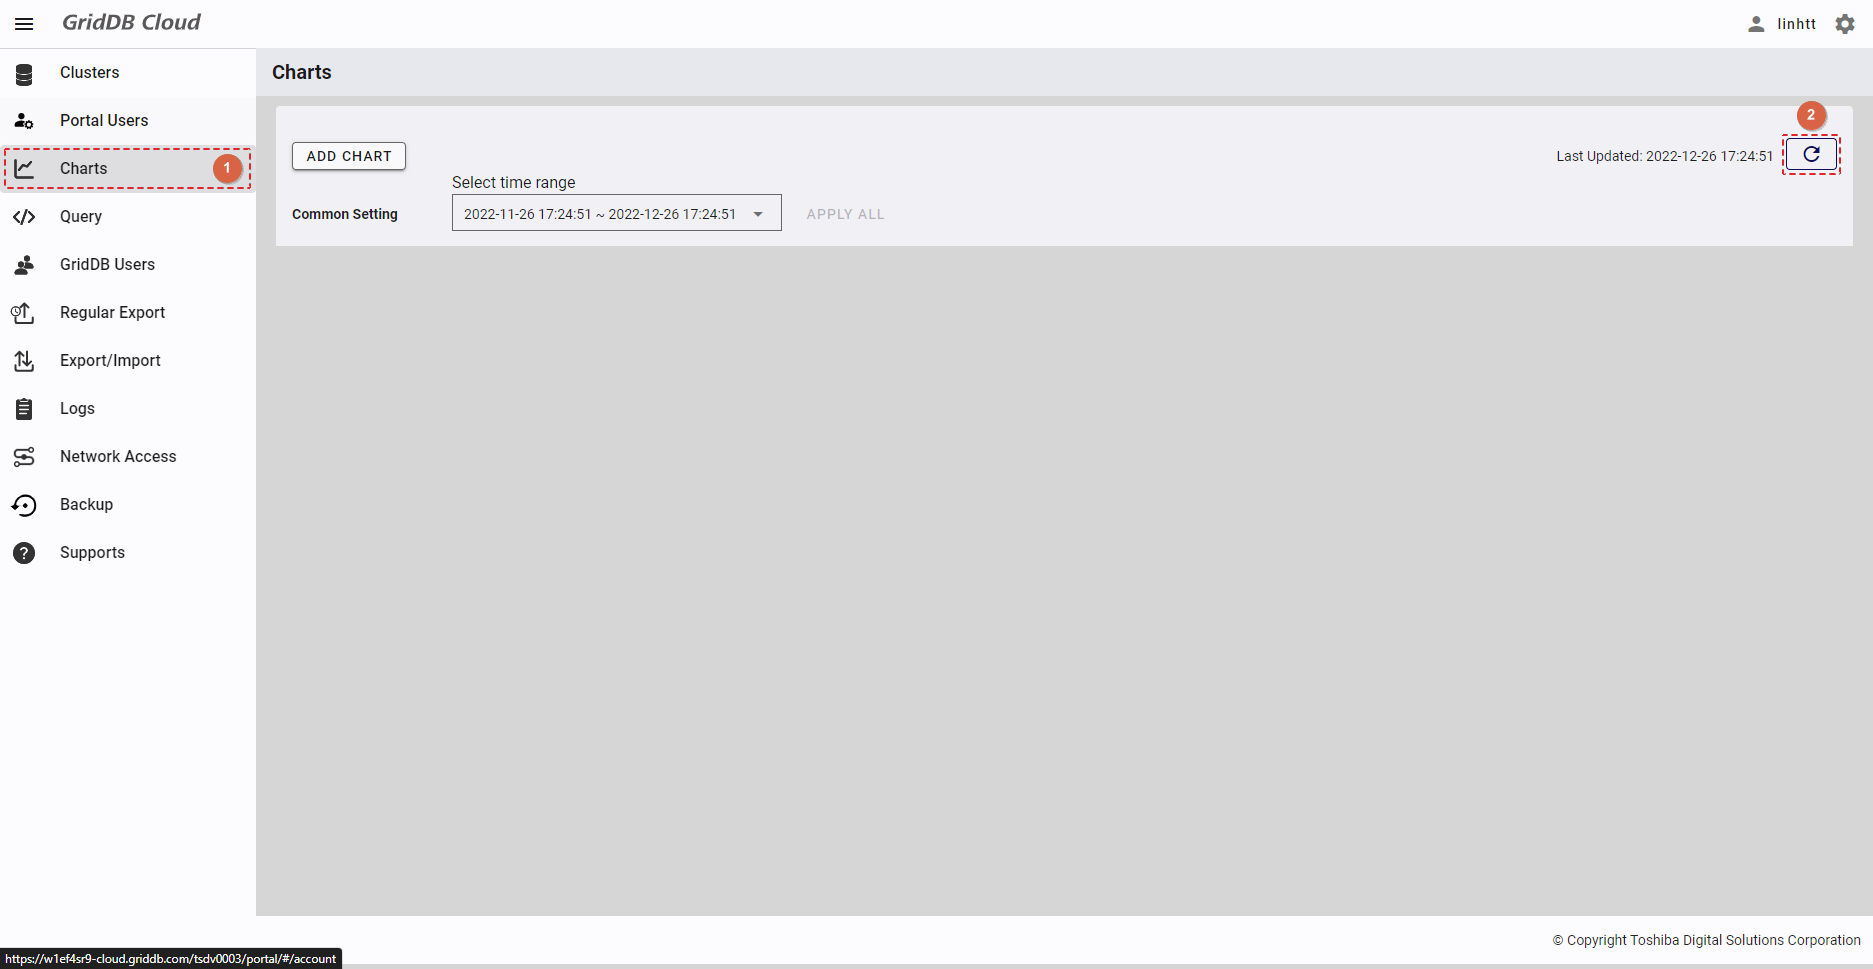
To access the chart list screen, first you must log in to the system and click the item [Charts] in the left menu (①).
To refresh charts and get their latest data, click the [Refresh] button (②) at the top of the right panel.
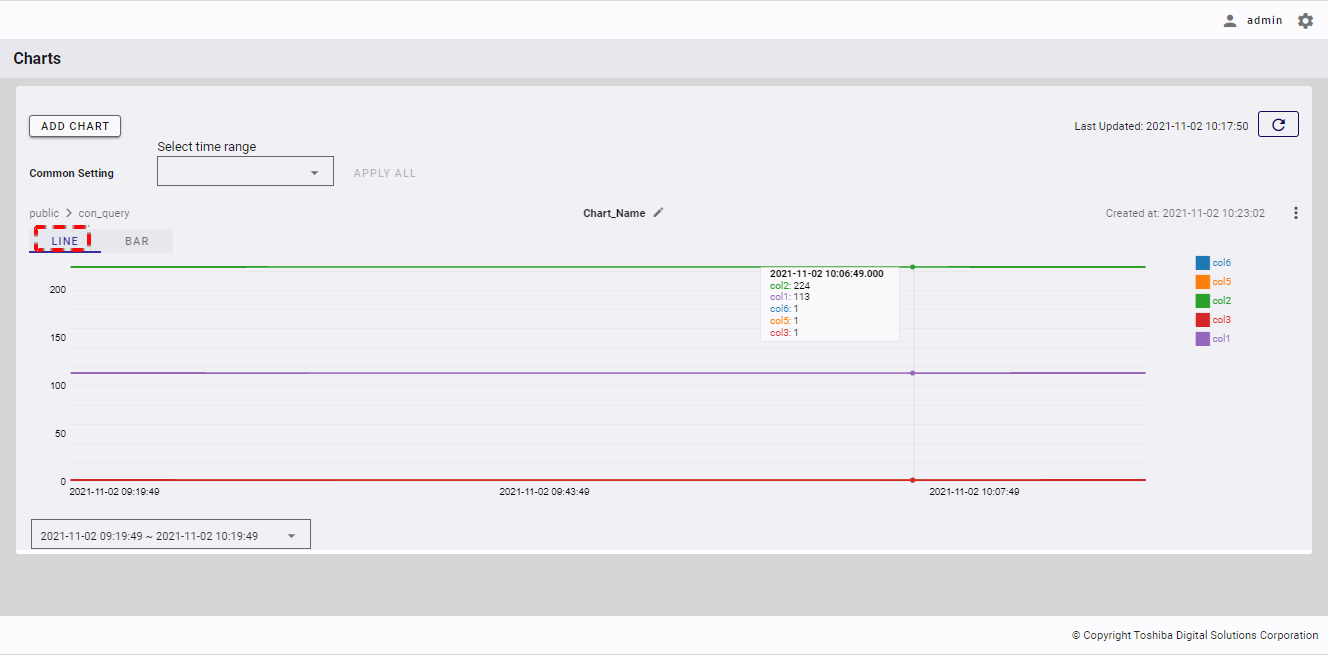
If you already have a chart in the chart list, you can change the chart type to Line or Bar by clicking the [LINE] or [BAR] tab. You can also hover the mouse pointer over the chart to see the value of columns at the specific time or to see the name of each column visualized in the chart as well as its database and container names.
[Note]: The chart list data is stored in the local storage with the key related to the login ID of the user currently logging in. This means that if you log in to another device, the chart list will not be displayed.
4.11.3 Adding a chart
Step 1: In the chart list screen, click the [ADD CHART] button.
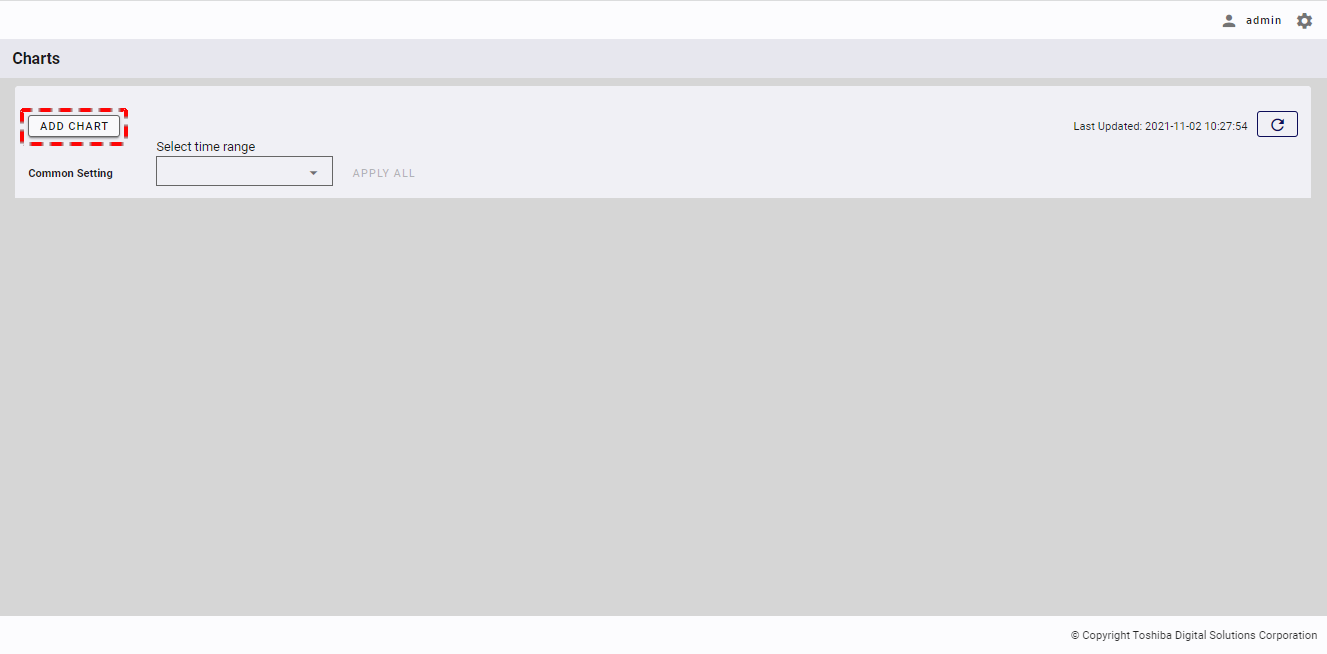
[Note]: You can only add up to 20 charts to the chart list. If there are already 20 charts in the chart list, the [ADD CHART] button will be disabled.
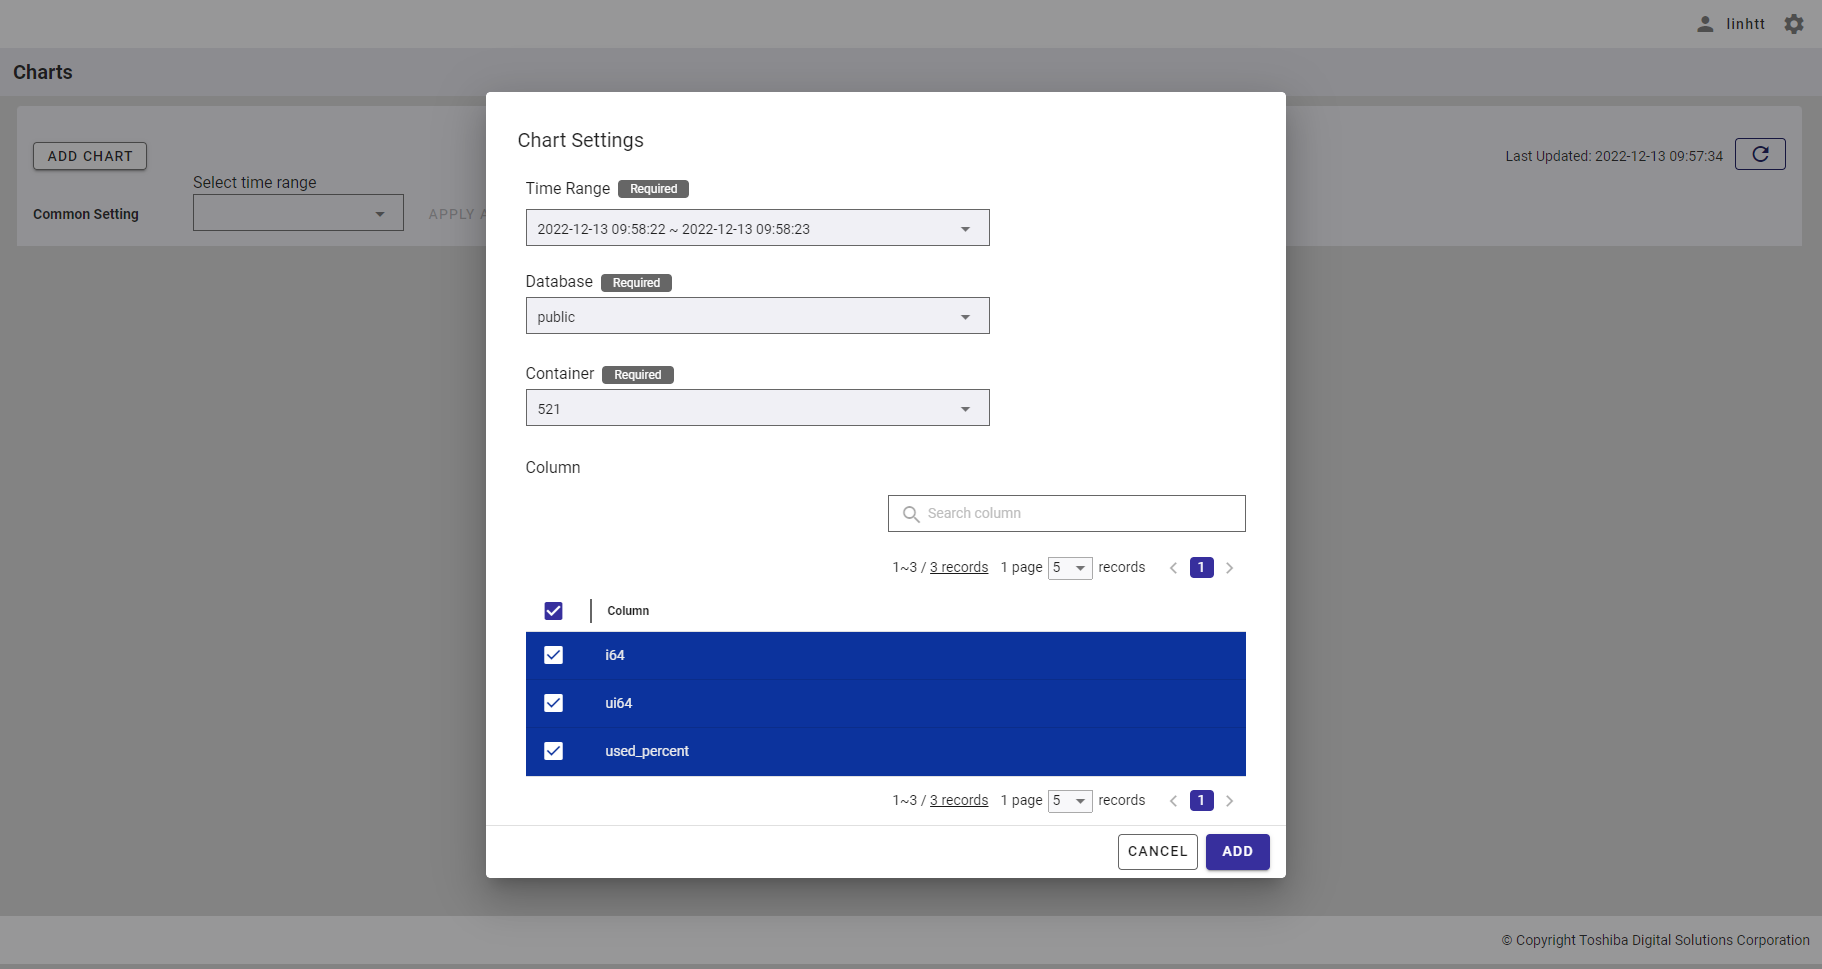
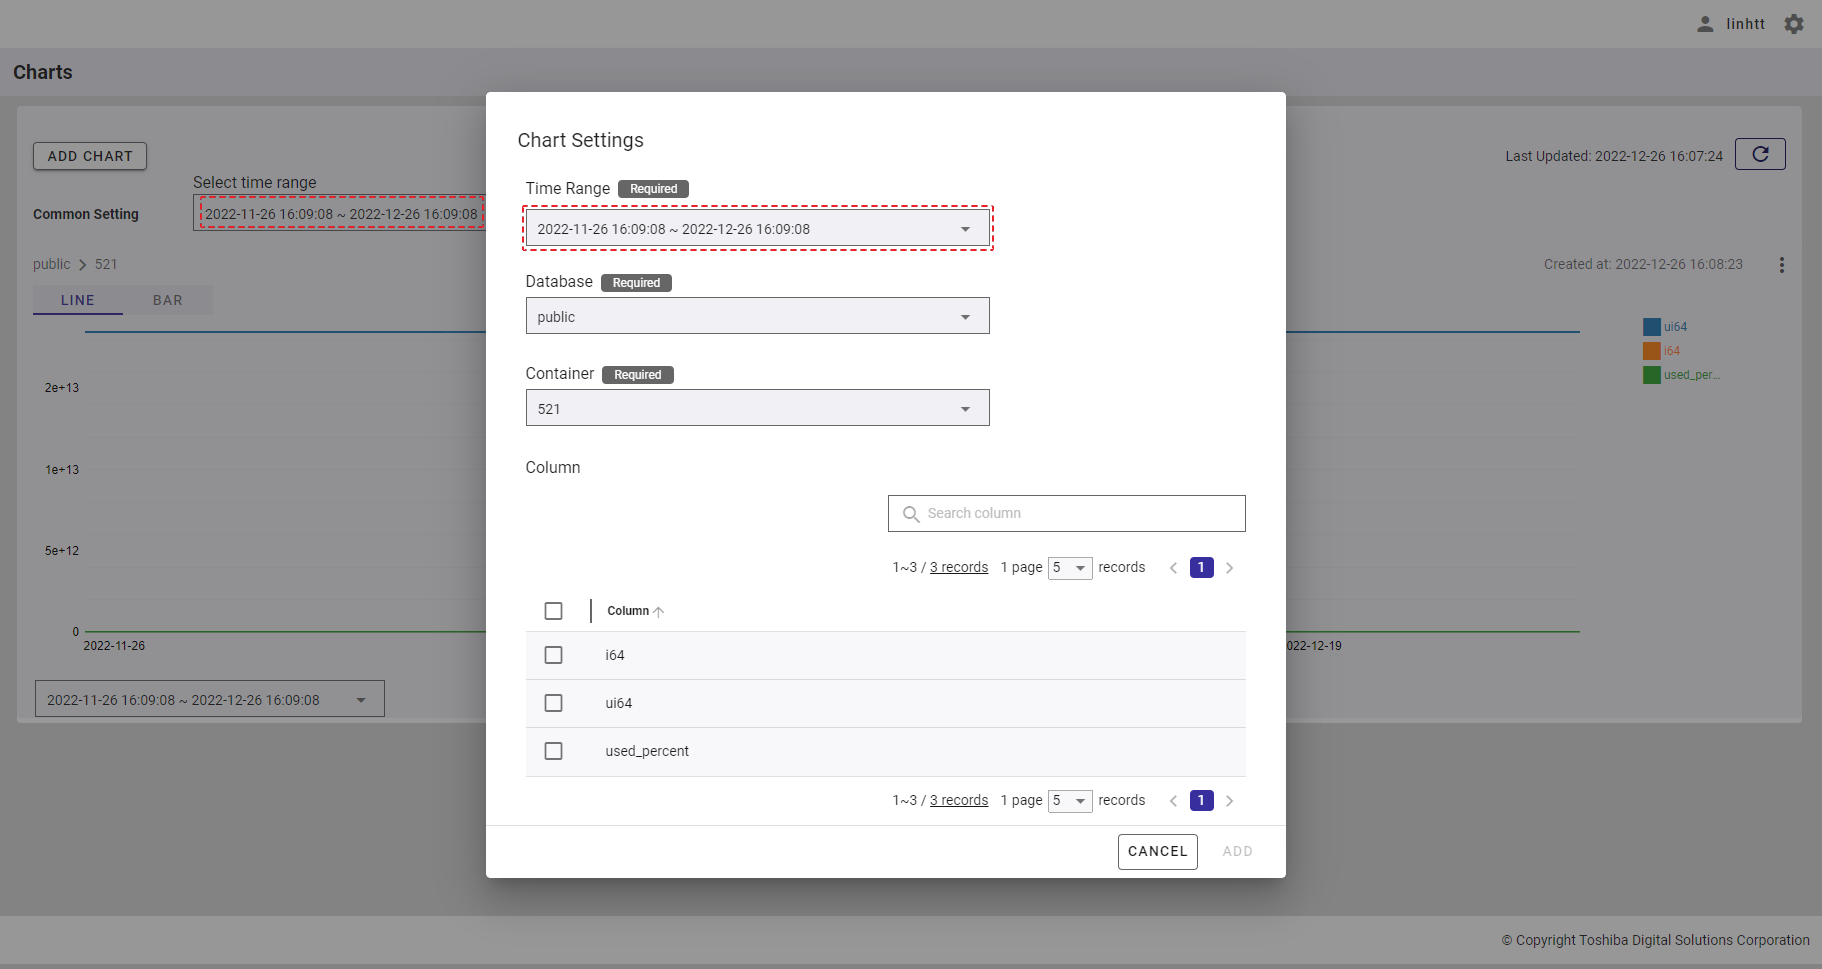
Step 2: After the Chart Settings dialog is displayed, select a time range from the [Time Range] list (①). See Time range selection for more details.
- You can select the database from the [Database] list (②) or by typing the name of the database in this field.
- You can select the container in the [Container] list (③) or by typing the name of the container in this field and press the enter key. The container list only displays timeseries containers.
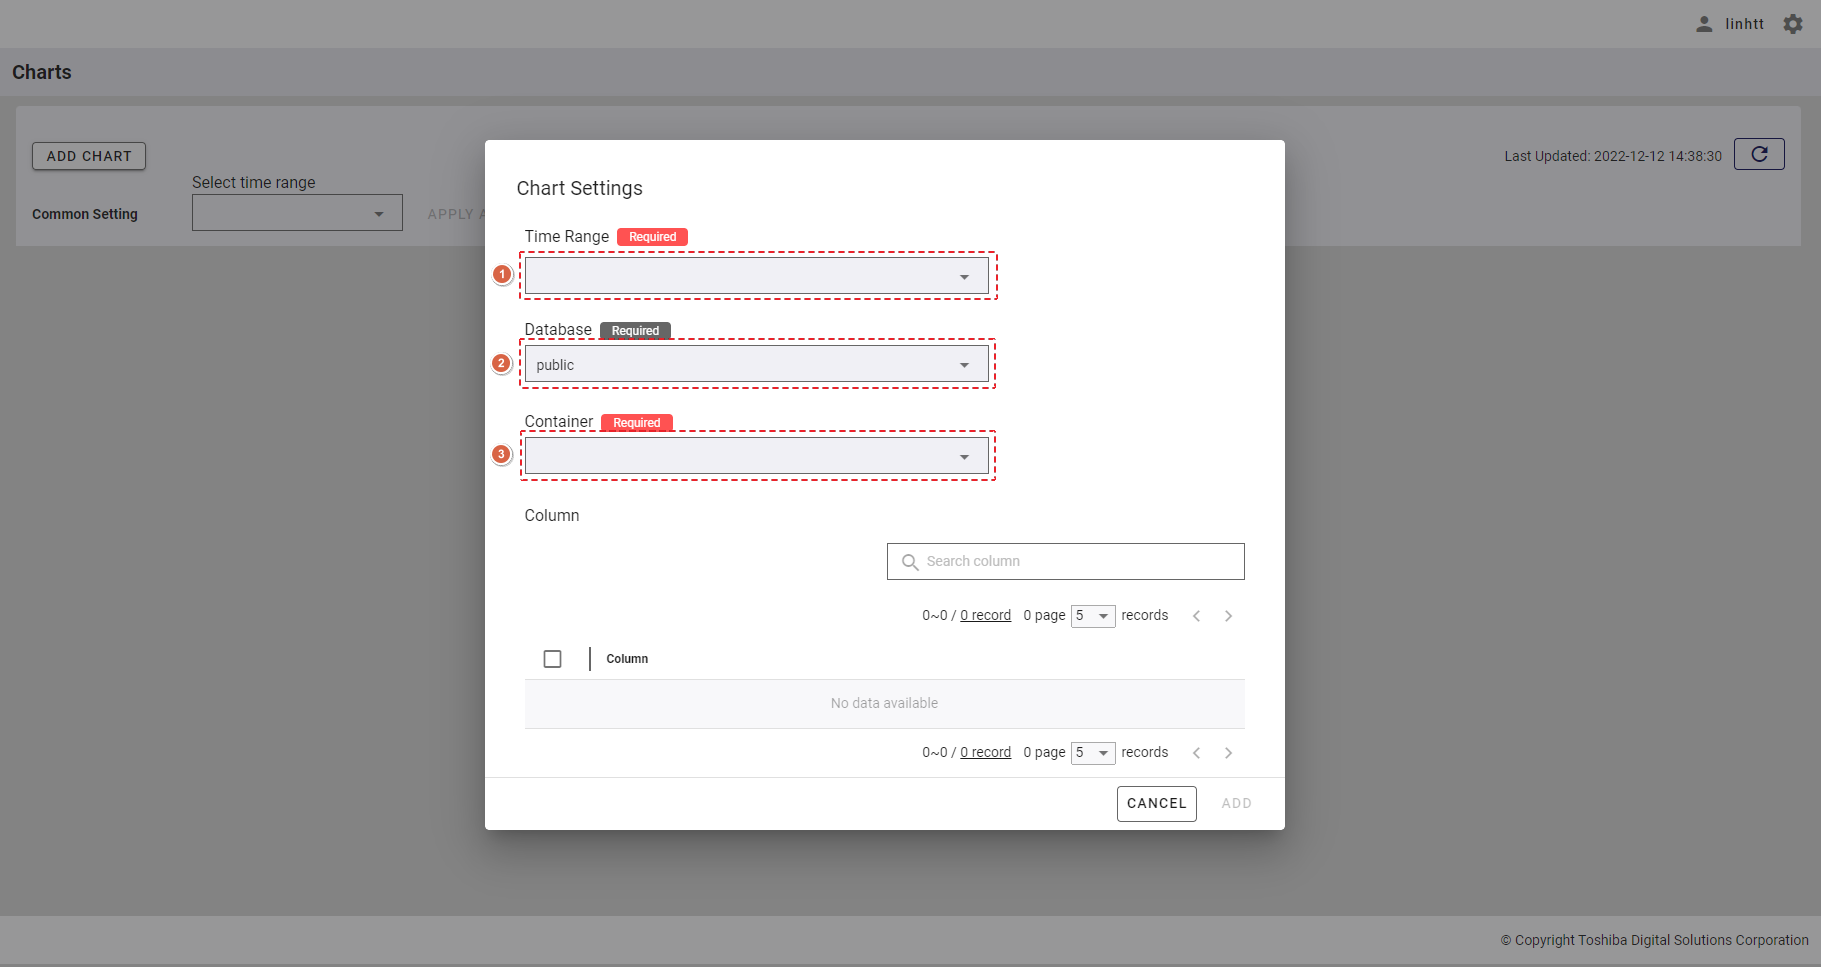
[Note]: There must be at least one timeseries container in any database with at least one numerical column. The numerical column includes column types: BYTE, SHORT, INTEGER, LONG, FLOAT, and DOUBLE.
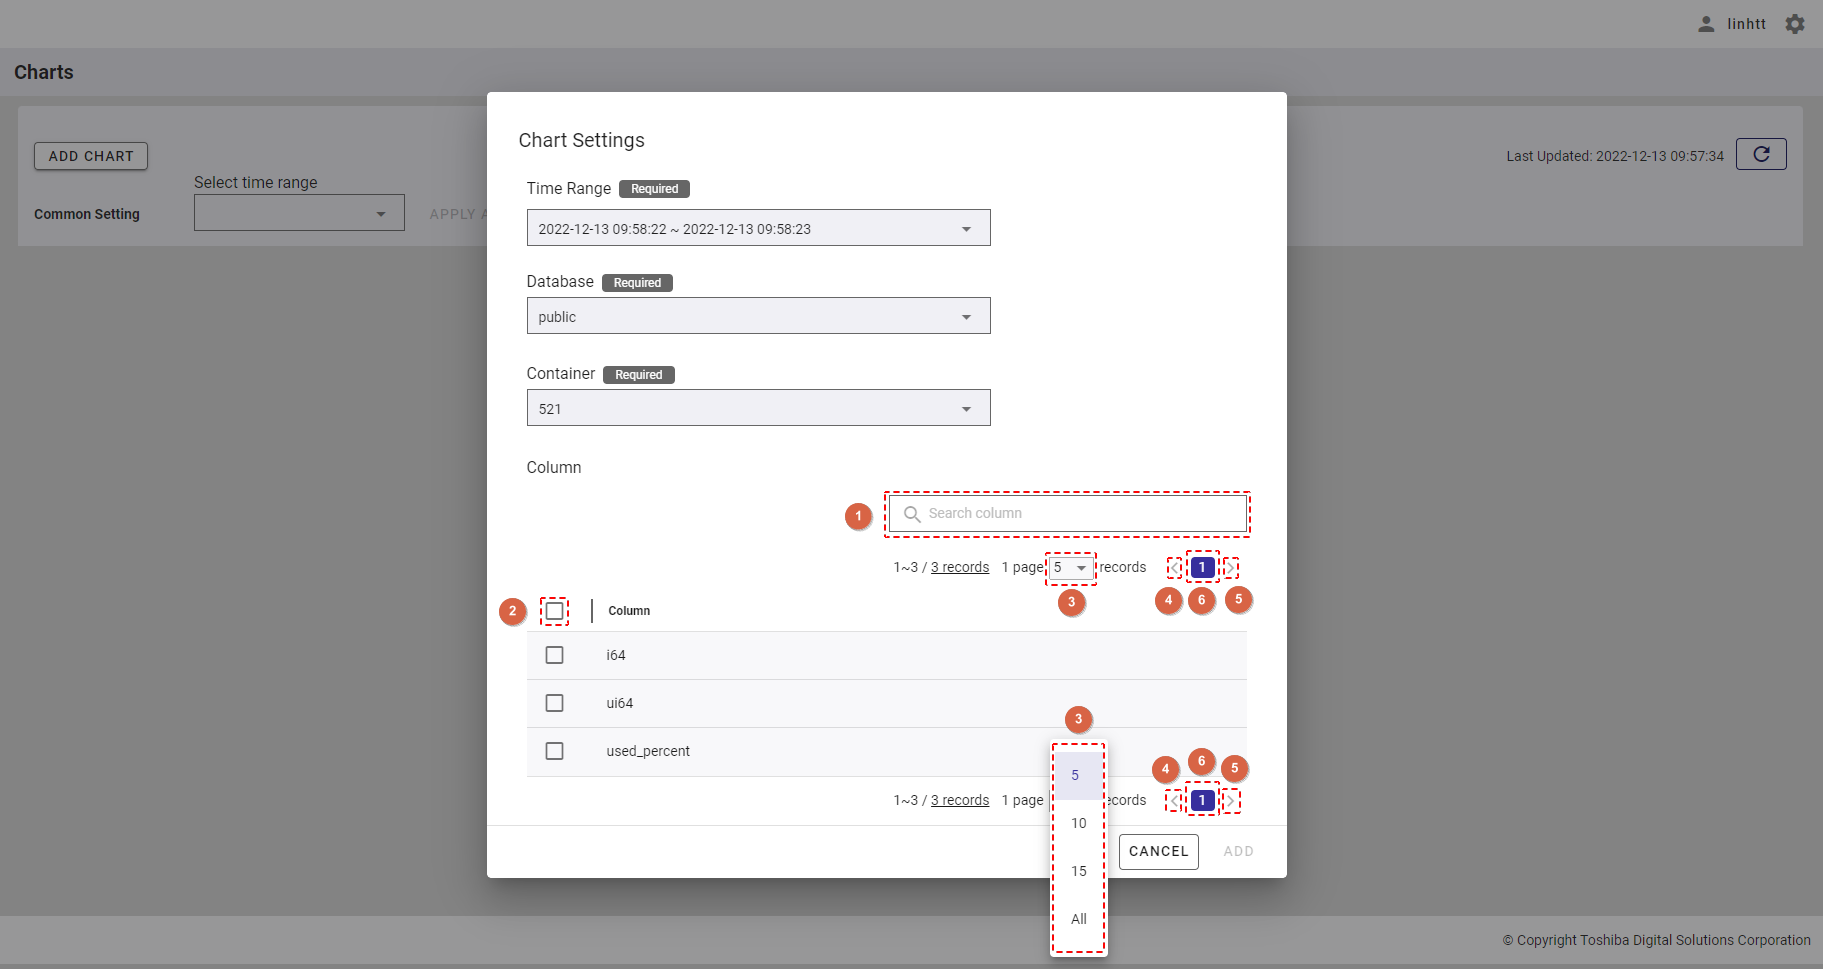
Step 3: Once the container is chosen, the column list of this container will be displayed.
- To search for the specific column, enter the column name in the [Search column] search bar (①).
- You can choose the number of columns displayed on one page by selecting the number from [5, 10, 15, All] (③) at the top or bottom of the page. Click the [Next] button (⑤) or the [Back] button (④), or click the page number (⑥) to view another page.
- To add a column to the chart, check the checkbox on the left of the column name (②). You can select one or multiple columns to add to the chart.
- You can adjust the column size by dragging and dropping the vertical bar "|" on the header.
Step 4: After selecting the column, click the [ADD] button to add this chart to the chart list. If you do not want to add a chart, click the [CANCEL] button to close the dialog and return to the chart list screen.
- You can quickly select all columns to add to the chart by checking the [Select all] checkbox. See Limitations for more details.
[Note]: The maximum number of columns in a chart is 10, and the maximum number of charts that you can add is 20. After the maximum number is reached, the error dialog will be displayed if you click the [ADD] button.
4.11.4 Time range selection
When selecting a time range, you choose whether to select a time range quickly or customize a time range.
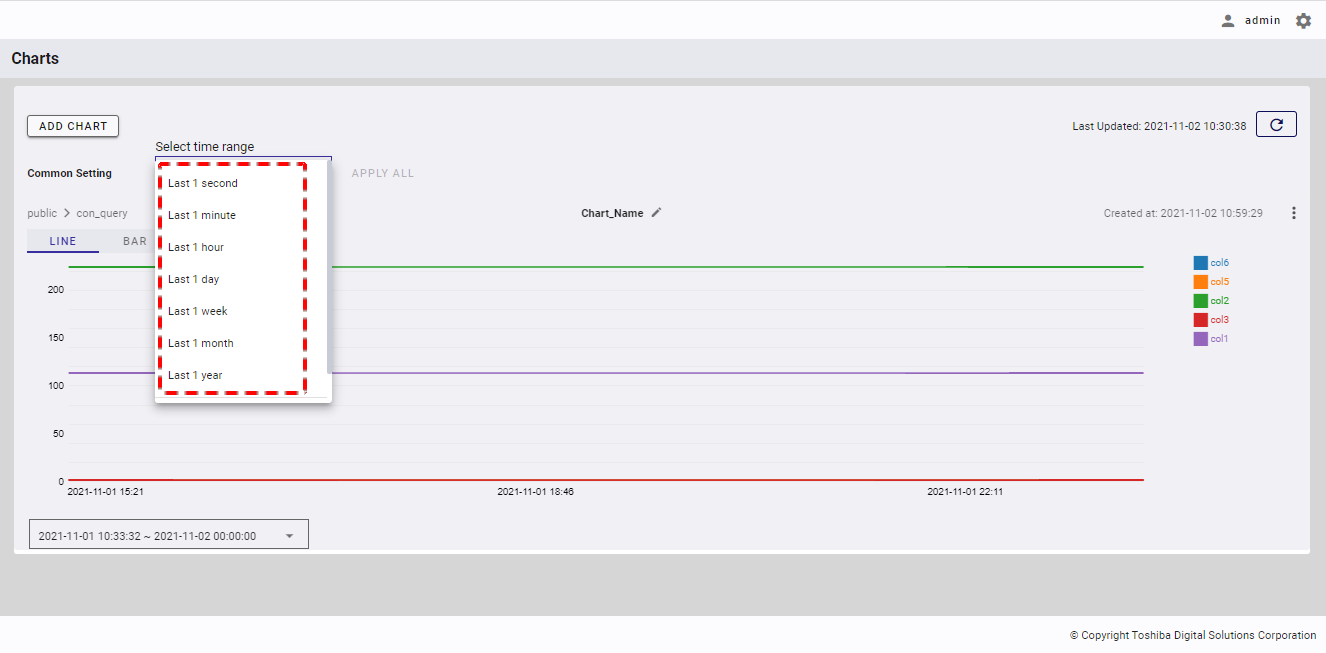
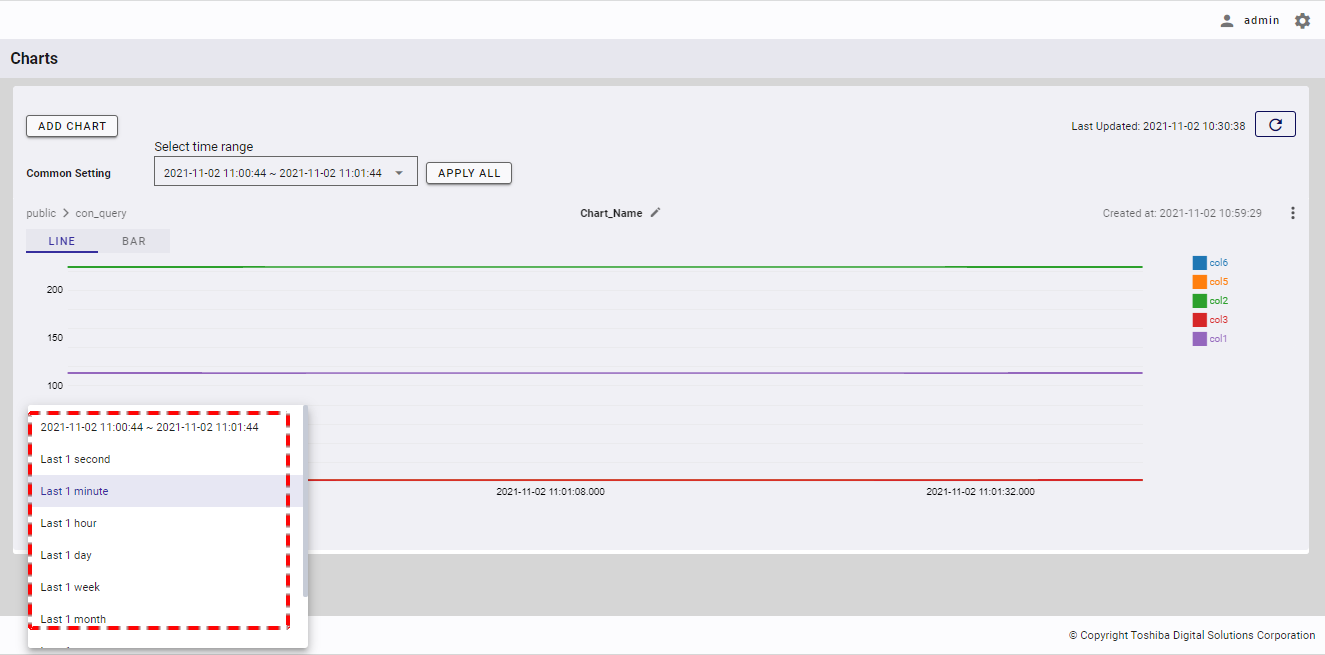
4.11.4.1 Time range quick selection
You can select a time range quickly by selecting an item in the time range list, described in the table below.
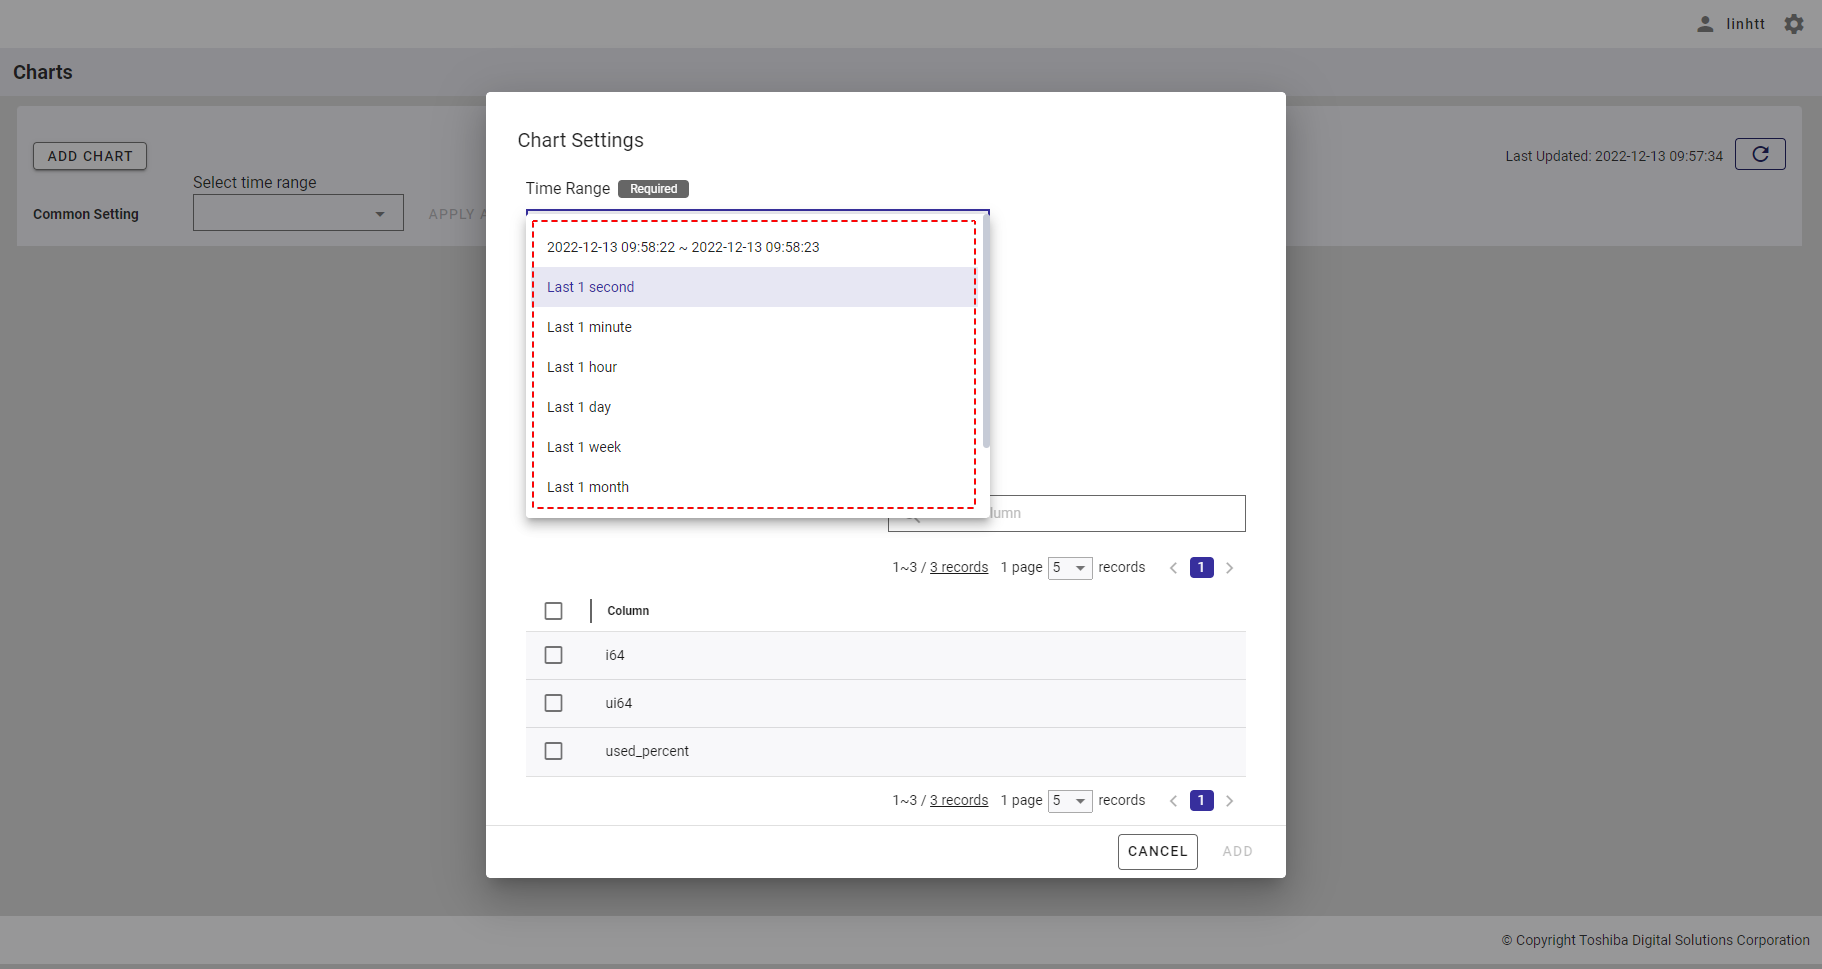
- Time range list:
| Time range | Description |
|---|---|
| Last 1 second | Last 1 second from the current time. |
| Last 1 minute | Last 1 minute from the current time. |
| Last 1 hour | Last 1 hour from the current time. |
| Last 1 day | Last 1 day from the current time. |
| Last 1 week | Last 7 days from the current time. |
| Last 1 month | Last 30 days from the current time. |
| Last 1 year | Last 365 days from the current time. |
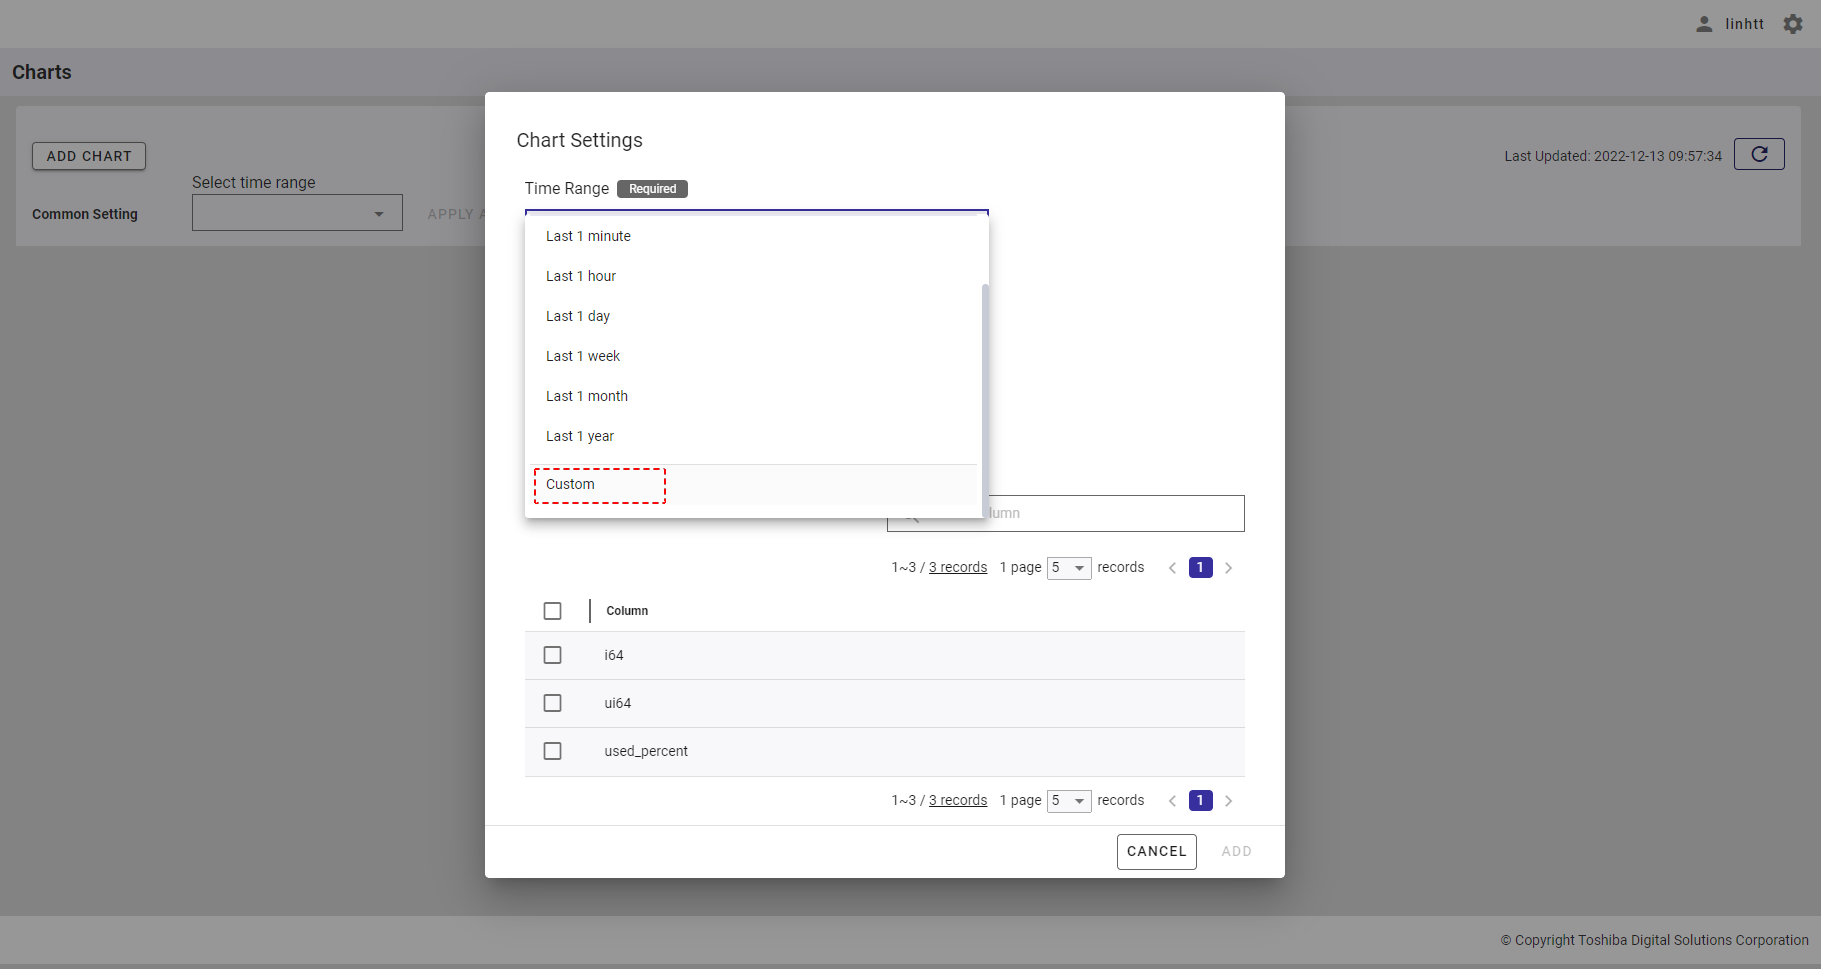
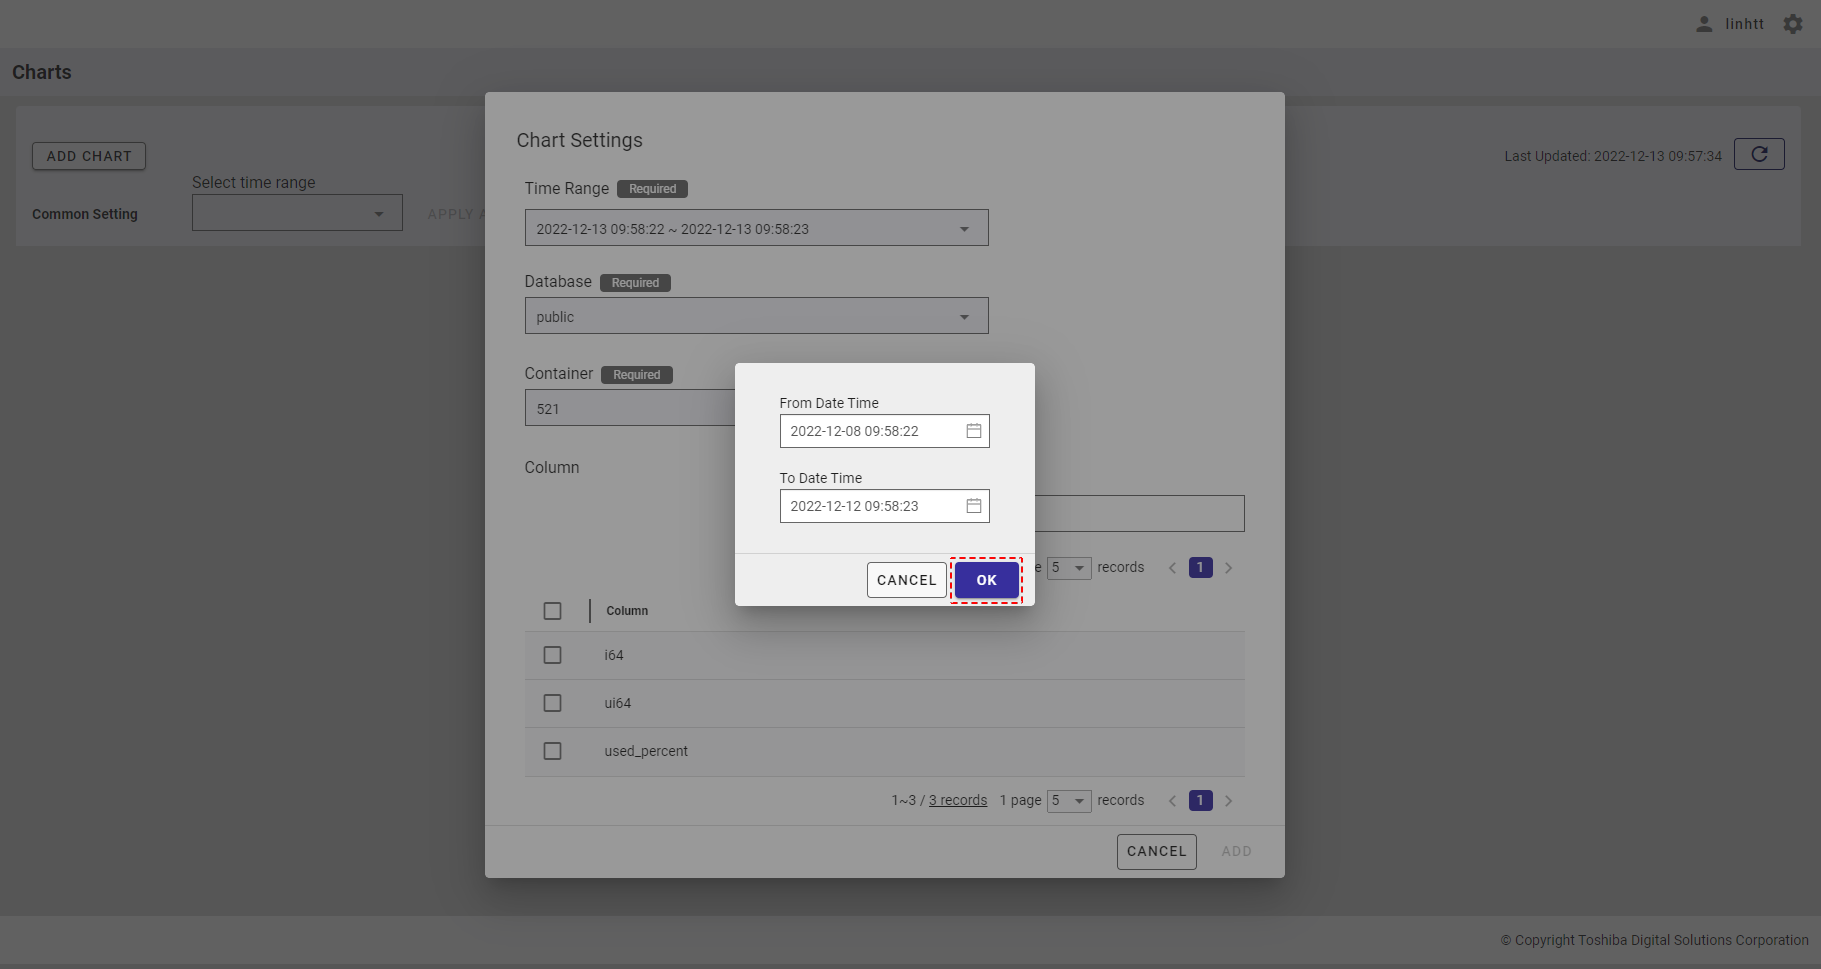
4.11.4.2 Time range custom selection
Step 1: You can customize the time range to visualize a chart by selecting the [Custom] item in the time range list.
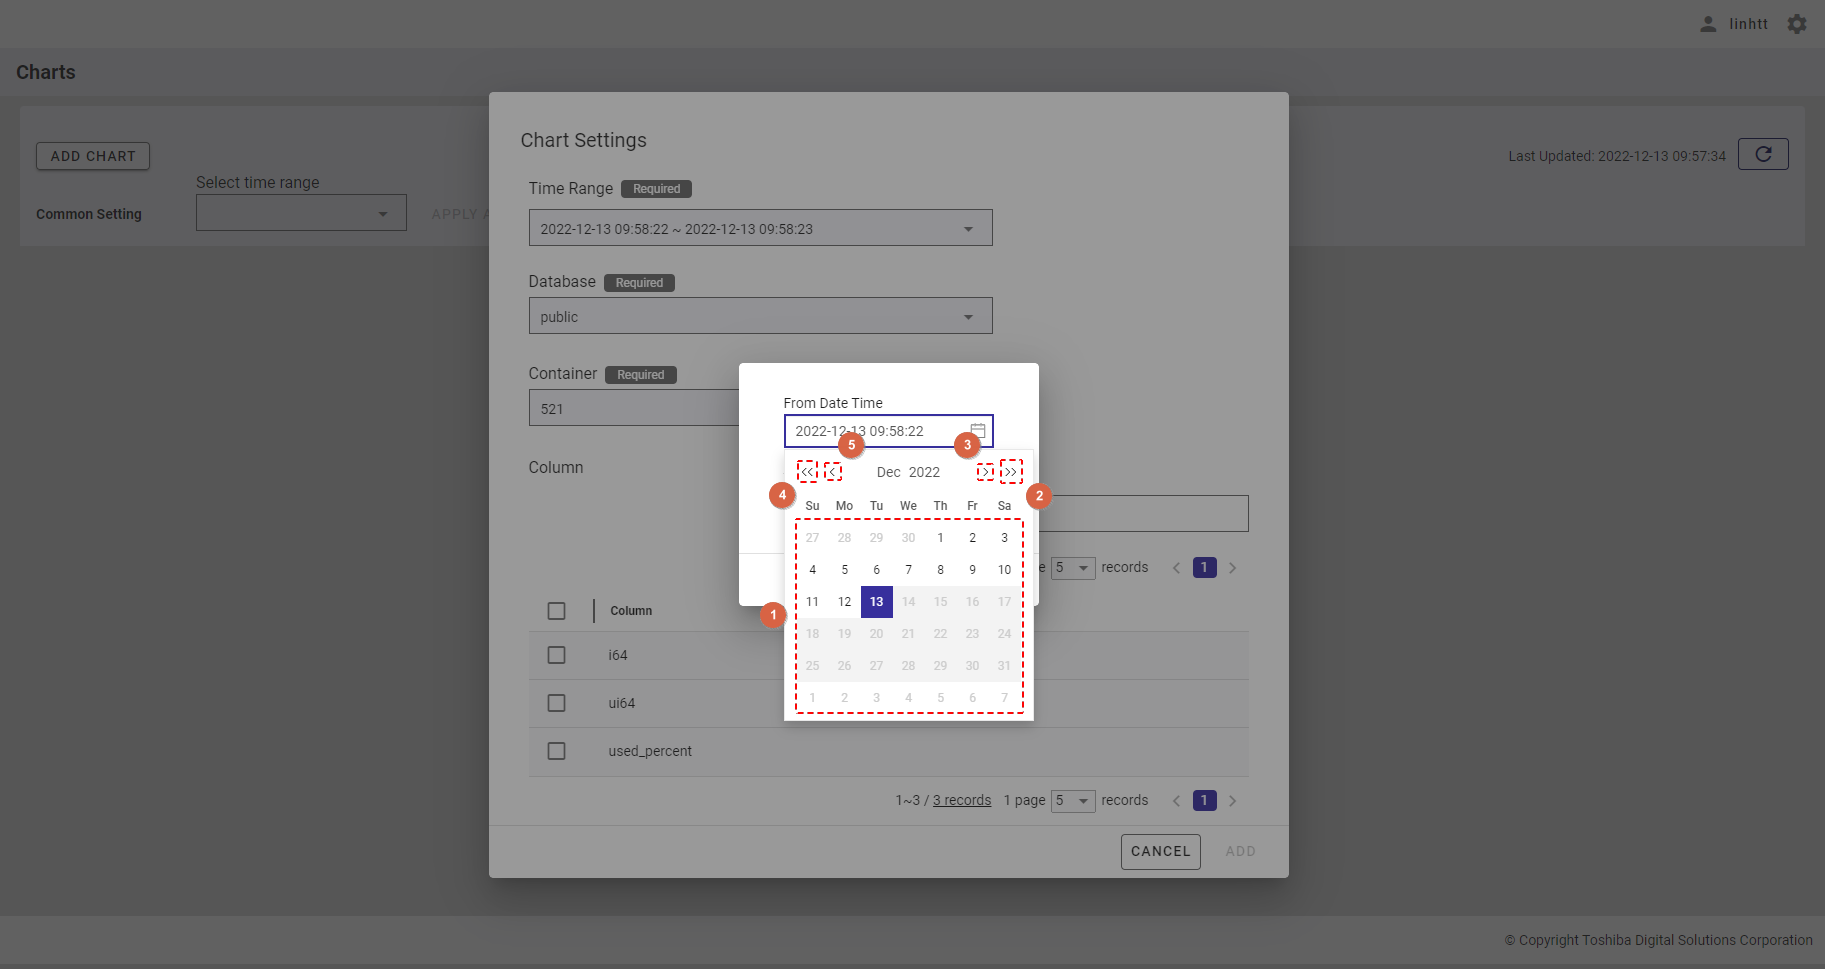
Step 2: The custom time range dialog will be displayed as the image below. Select the Beginning Date Time and the Ending Date Time in the [From Date Time] and [To Date Time] fields, respectively.
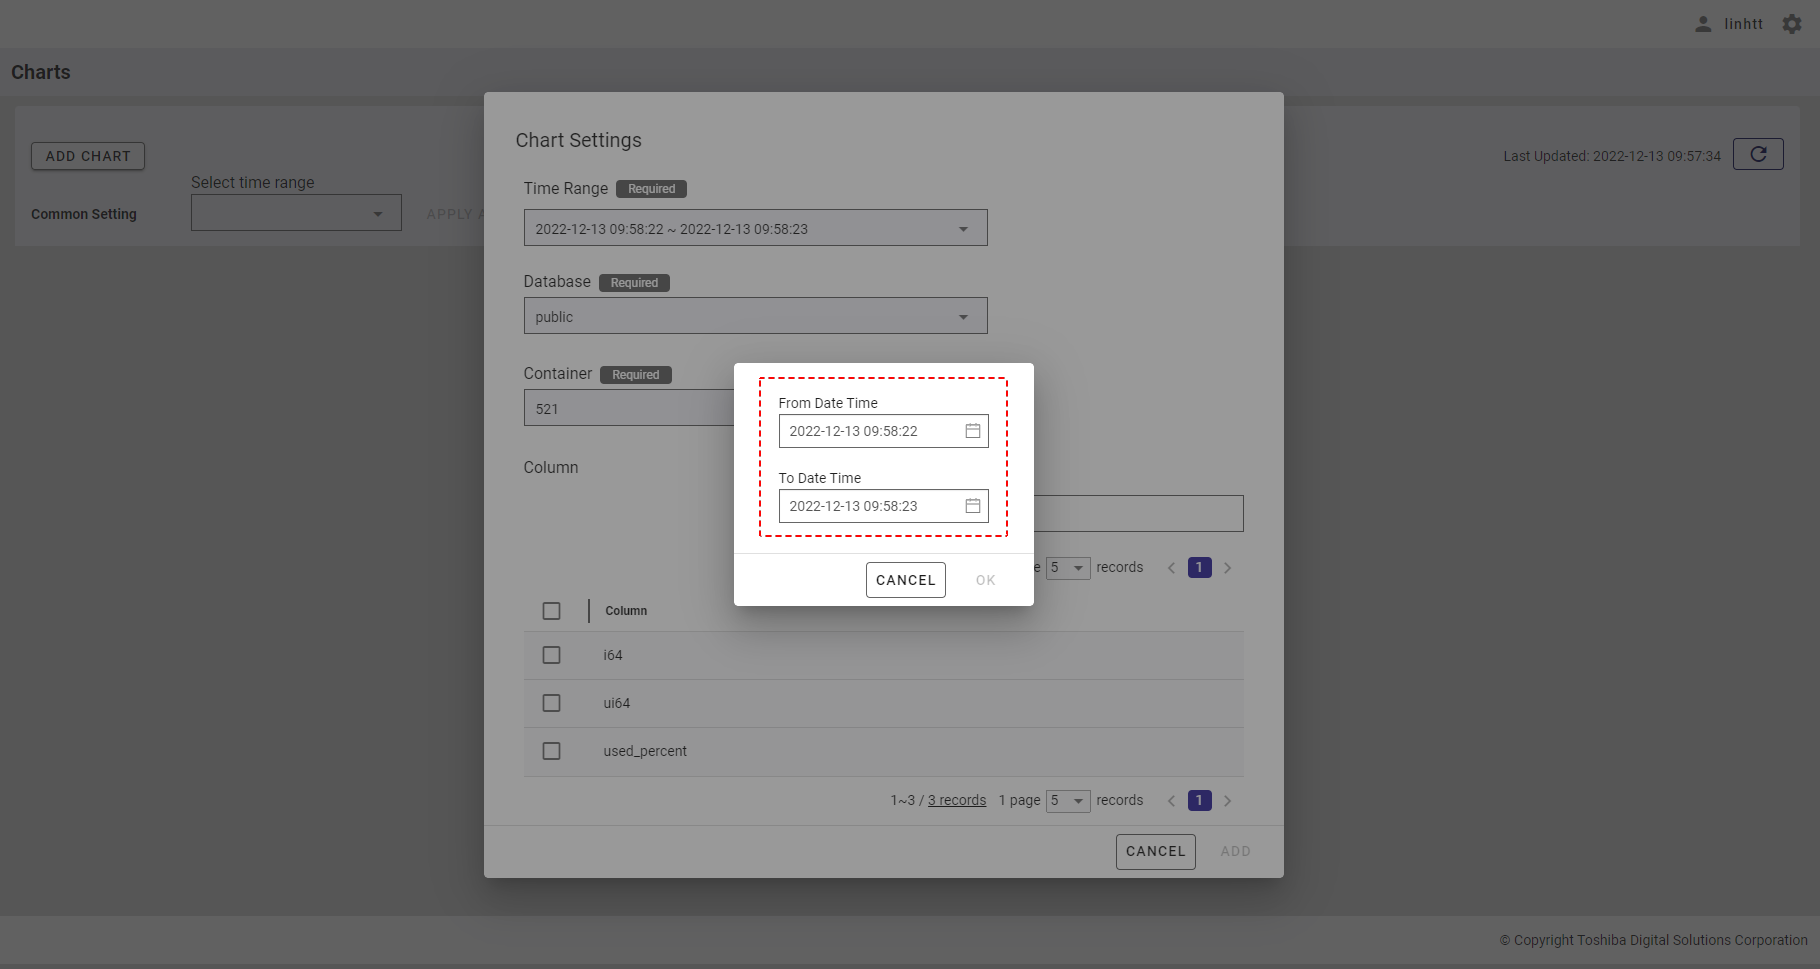
- To select the beginning time, click the calendar icon below the item [From Date Time] to display the calendar. Select the day for which you want to visualize the chart (①).
- To change the year, click the [NEXT YEAR] and [PREVIOUS YEAR] buttons (② and ④).
- To change the month, click the [NEXT MONTH] and [PREVIOUS MONTH] buttons (③ and ⑤).
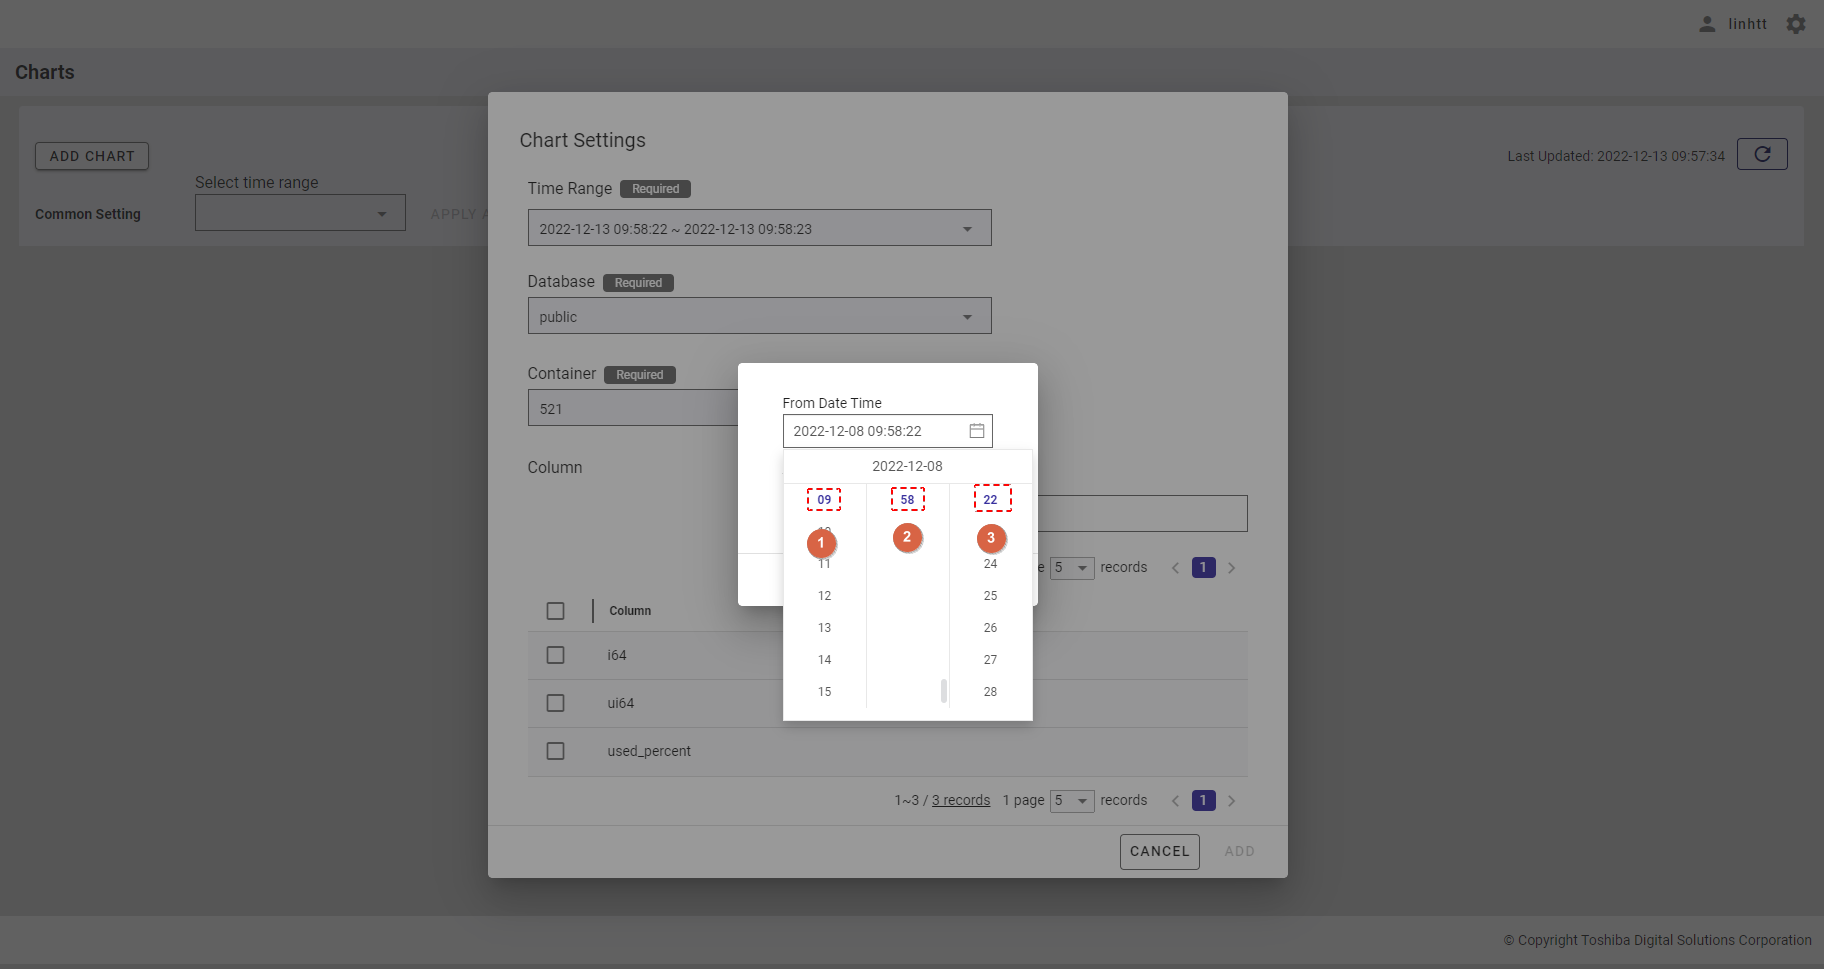
- After choosing the day, you can select the hour (①), minute (②), and second (③).
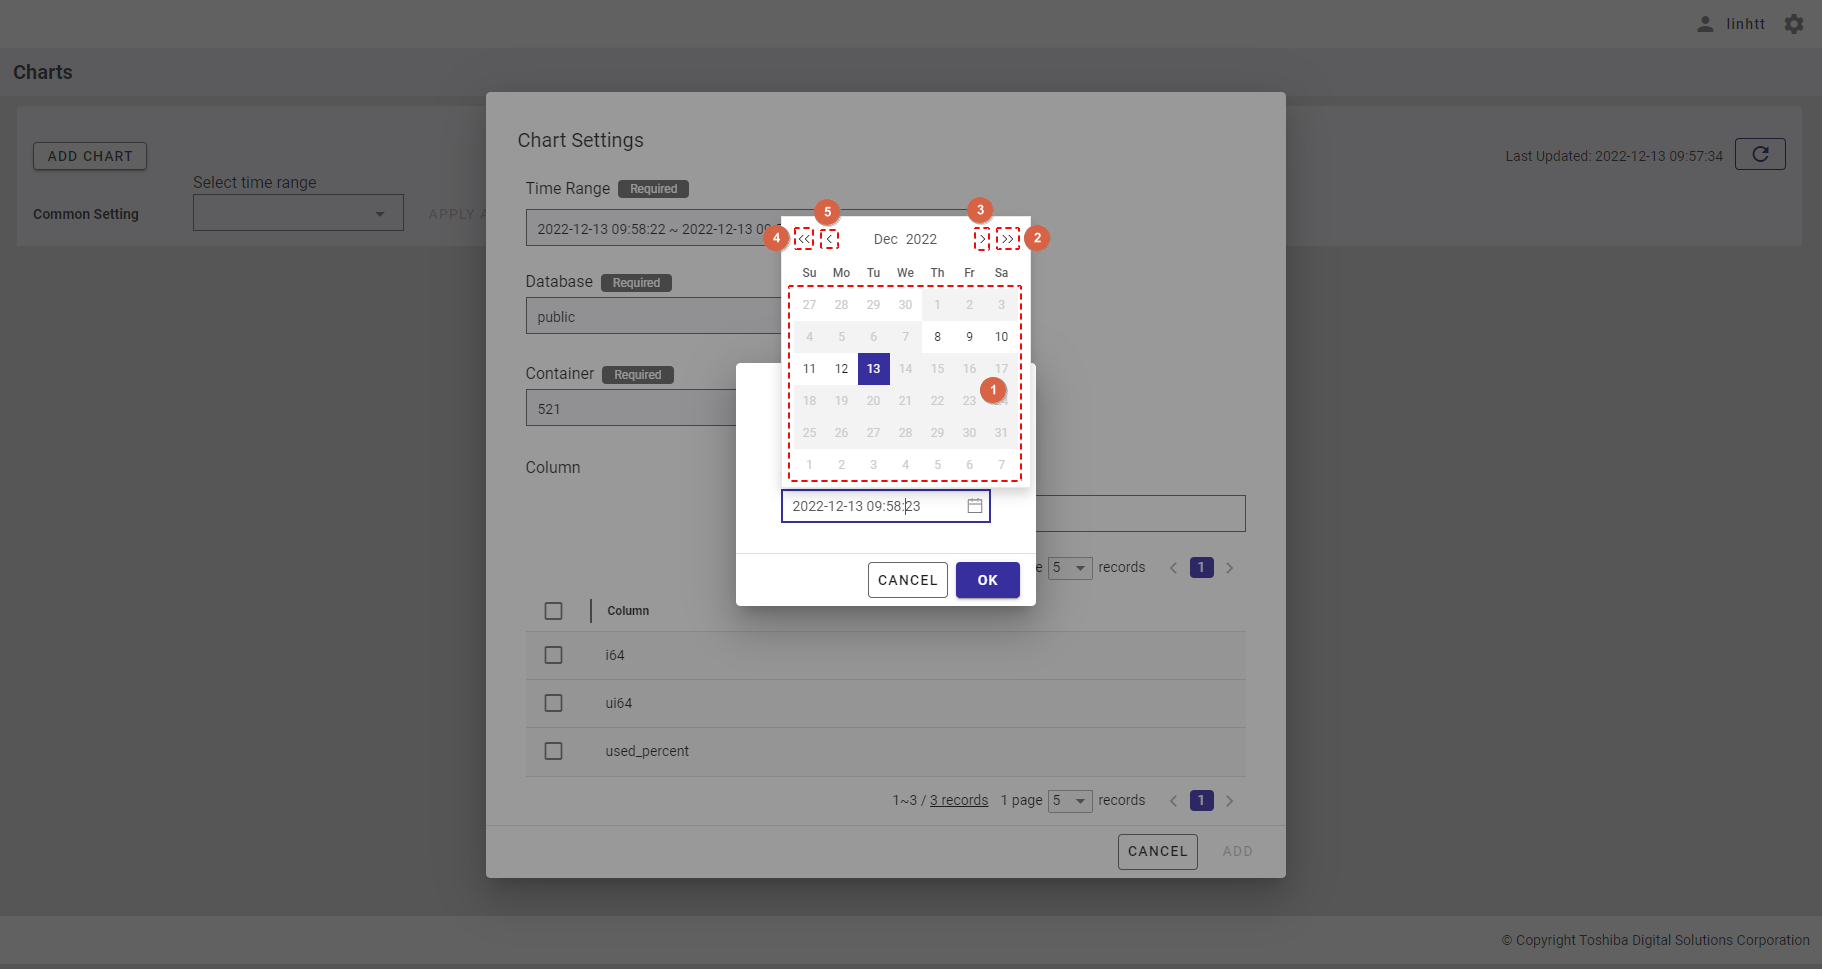
- To select the ending time, click the calendar icon below [To Date Time] to display the calendar. Select the day for which you want to visualize the chart (①).
- To change the year, click the [NEXT YEAR] and [PREVIOUS YEAR] buttons (② and ④).
- To change the month, click the [NEXT MONTH] and [PREVIOUS MONTH] buttons (③ and ⑤).
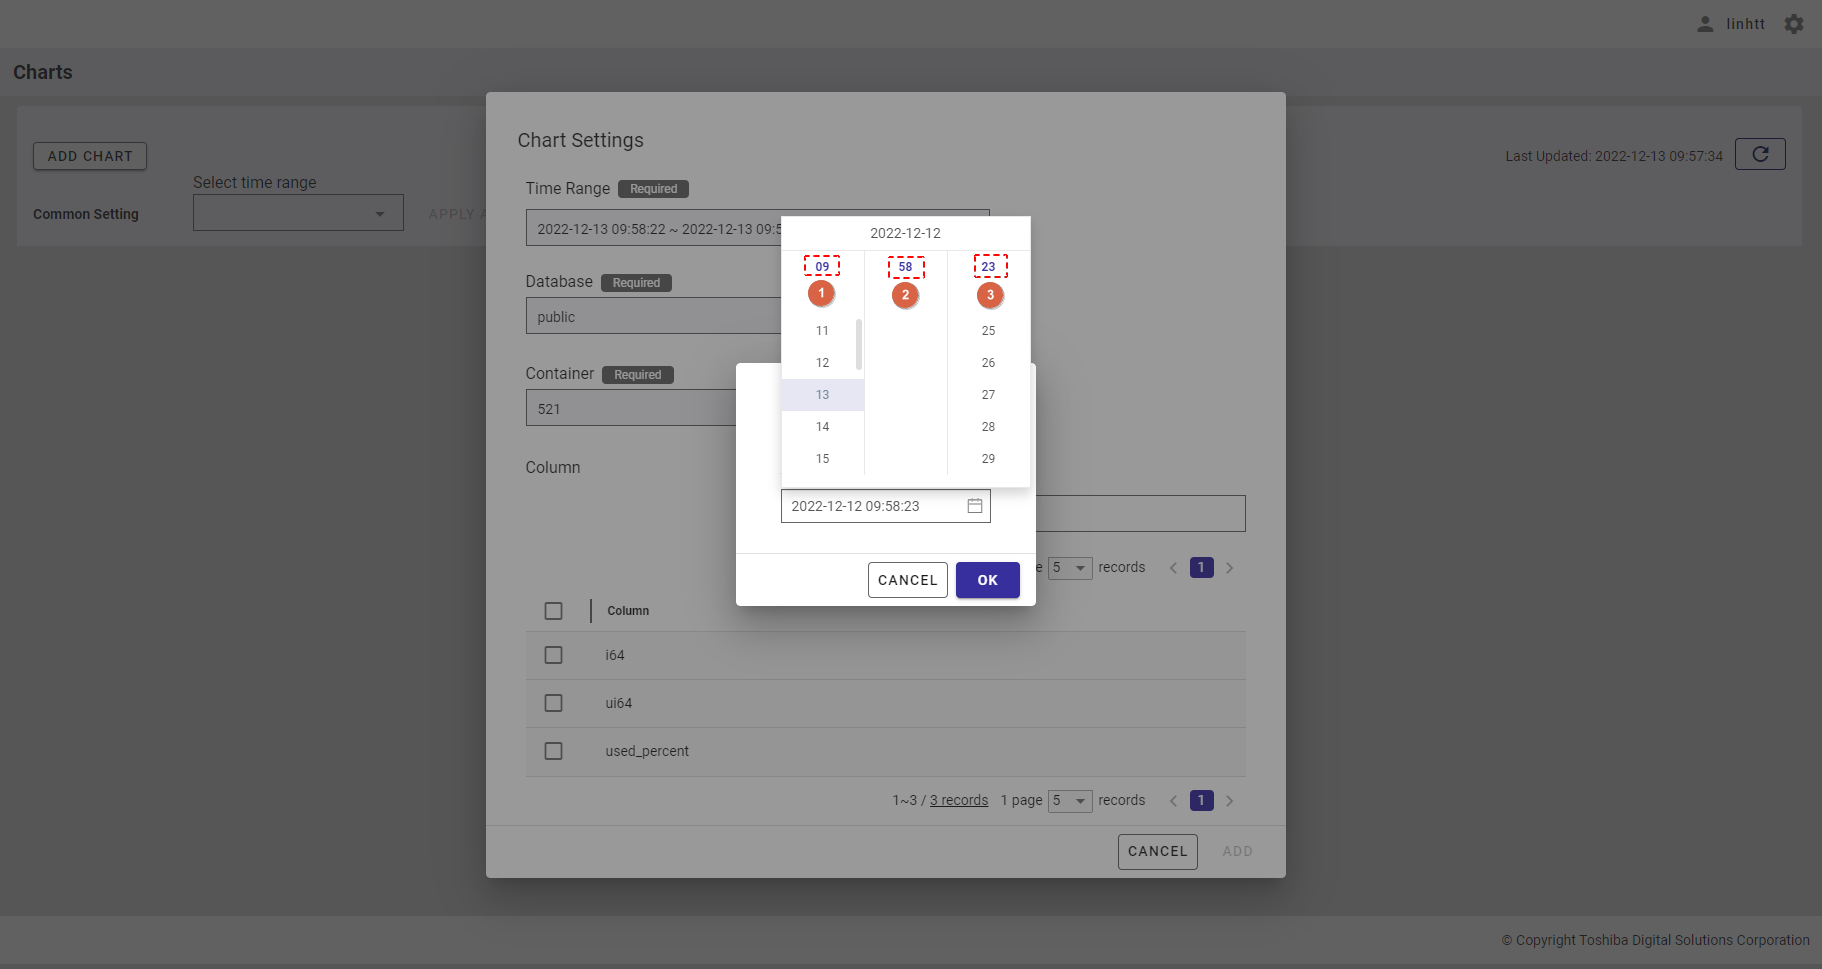
- After choosing the day, you can select the hour (①), minute (②), and second (③).
[Note]:
The maximum time range you can select is 5 years.
The minimum date and time that can be selected is 1970-01-01 00:00:00.
The maximum date and time that can be selected is 23:59:59 of the current day.
Step 3: After selecting the time range, click the [OK] button. If you do not want to set the time range, click the [CANCEL] button to close the dialog.
4.11.5 Changing the time range
After adding a chart to the chart list, you still can change the time range to visualize the container data for all charts or a single chart.
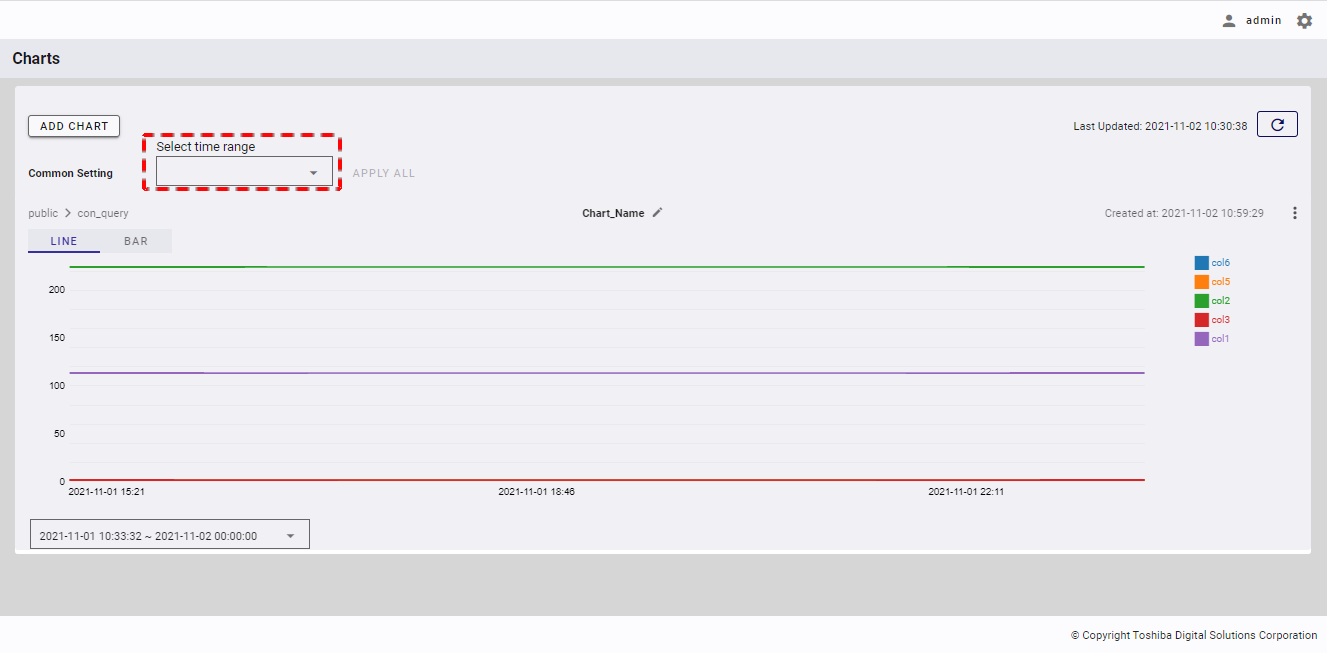
4.11.5.1 Changing the time range for all charts
Step 1: To change a time range for all charts, click the [Select time range] list in the [Common Setting] field.
Step 2: After selecting the time range, the time period will be displayed. Click the [APPLY ALL] button to change the time range for all charts.
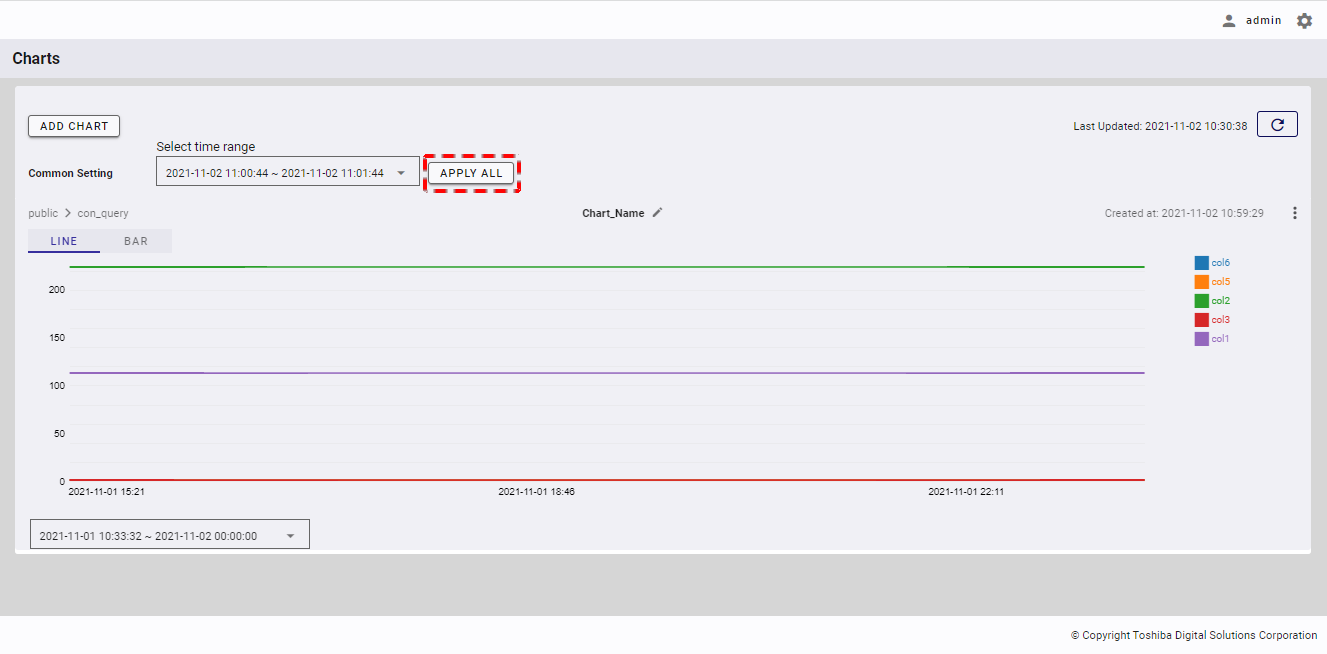
[Note]: The [APPLY ALL] button will be enabled only if there is at least one chart.
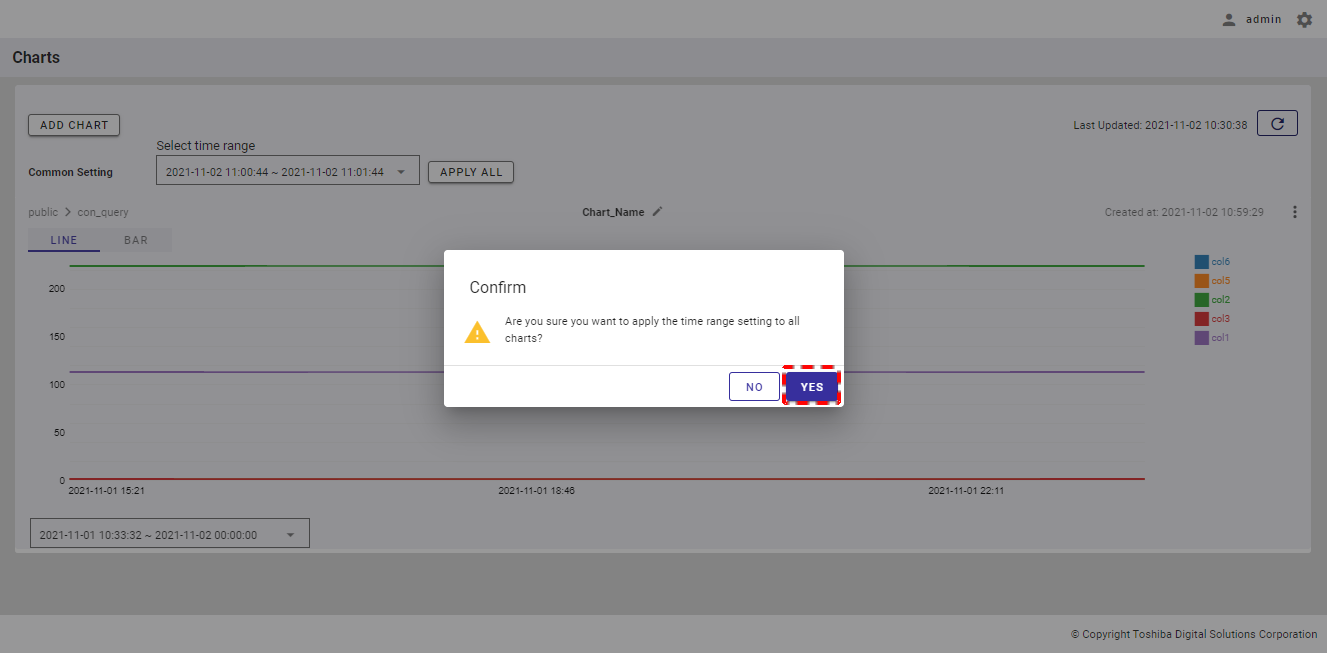
Step 3: When the confirmation dialog is displayed, click the [YES] button to confirm the time range change. If you do not want to change the time range, click the [NO] button to close the dialog.
[Note]: If you add a new chart (See Adding a chart for more details.) after changing the time range for all charts, you will see that the time range in the chart settings dialog is the same as the time range that you have set for all charts.
4.11.5.2 Changing the time range for a single chart
To change the time range for a single chart, click the time range below the chart, highlighted in a red box to display a drop-down list for selecting the time range.
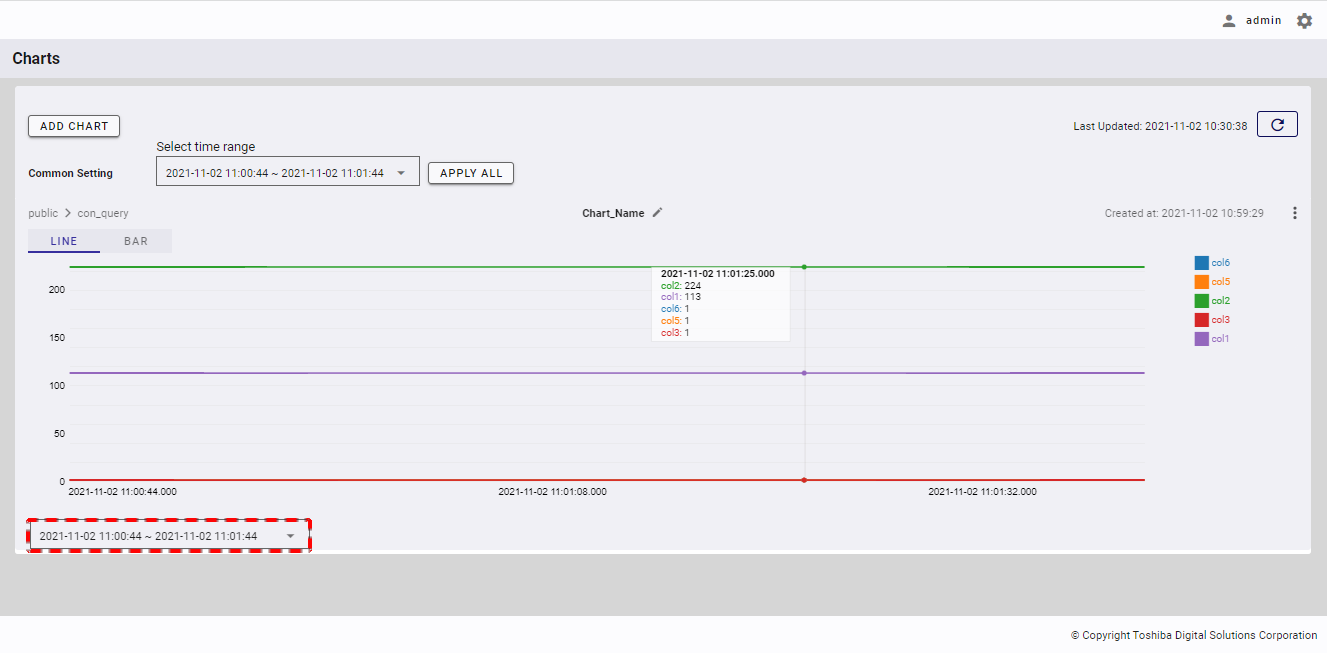
Once the time range is selected, the chart will be updated to apply the selected time range to the chart.
4.11.6 Changing a chart name
Step 1: To change the name of a chart, click the [Edit Chart Name] button.
Step 2: When the Edit Chart Name dialog is displayed, enter a new chart name in the [Chart Name] field (①) and then click the [UPDATE] button (②). If you do not want to change the chart name, click the [CANCEL] button to close the dialog without changing the name. You can click the [Chart name conditions] tab (③) to show/hide the conditions for the name of a chart.
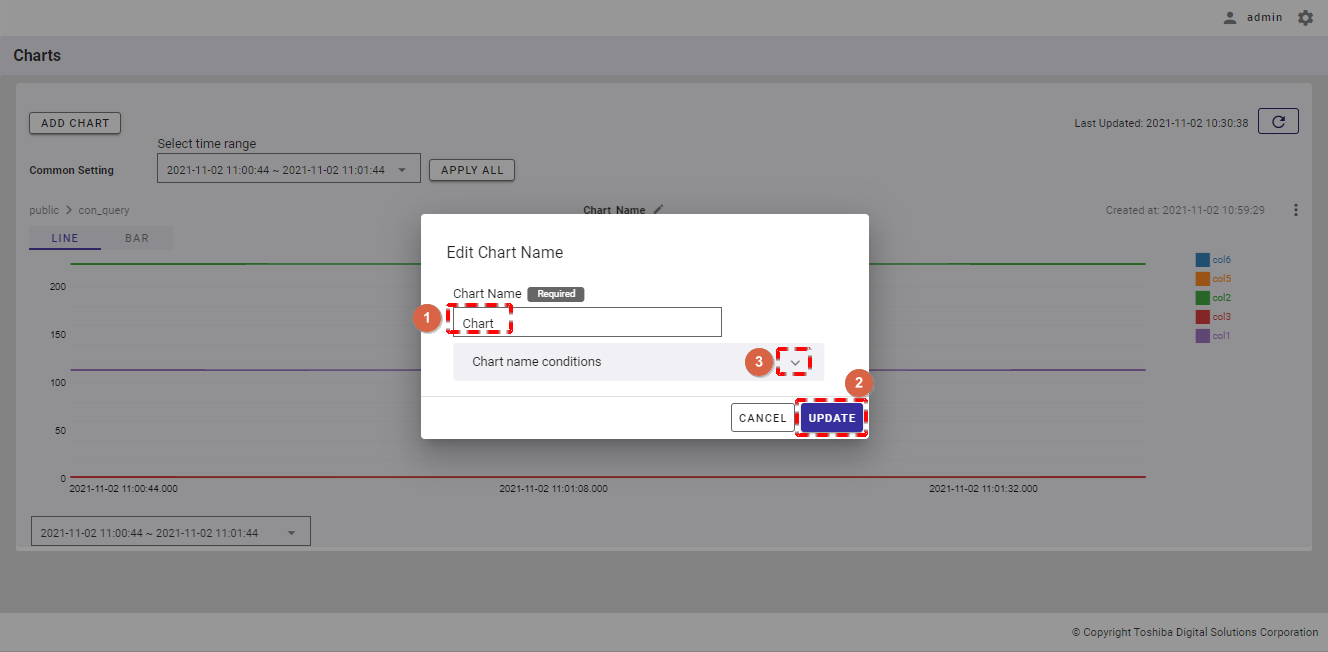
[Note]: The [UPDATE] button is enabled only when you enter the chart name other than the current chart name.
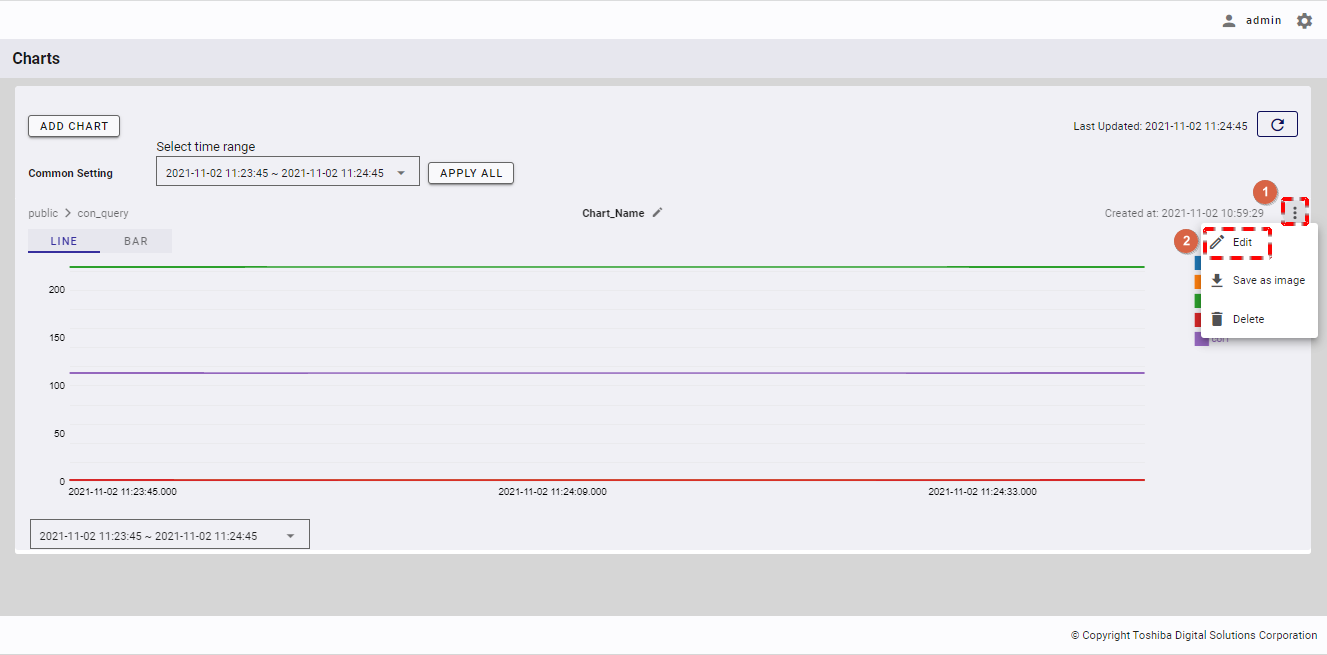
4.11.7 Editing a chart
Step 1: To change the database, container, or column that you want to display in the chart, click the [Chart Menu] button (①). In the drop-down list, select the [Edit] item (②).
Step 2:
In the Chart Settings panel, select the database from the [Database] list or type the name of the database in the [Database] field (①).
Select the container from the [Container] list or type the name of the container in the [Container] field and press the enter key (②).
To search for the specific column, type the column name in the [Search column] search bar (③).
You can choose the number of columns displayed on one page by selecting the number from [5, 10, 15, All] (⑤) at the top or bottom of the page. Click the [Next] button (⑦) or the [Back] button (⑥), or click the page number (⑧) to view another page.
To add a column to the chart, check the checkbox on the left of the column name (④). You can select one or multiple columns to add to the chart.
You can adjust the column size by dragging and dropping the vertical bar "|" on the header.
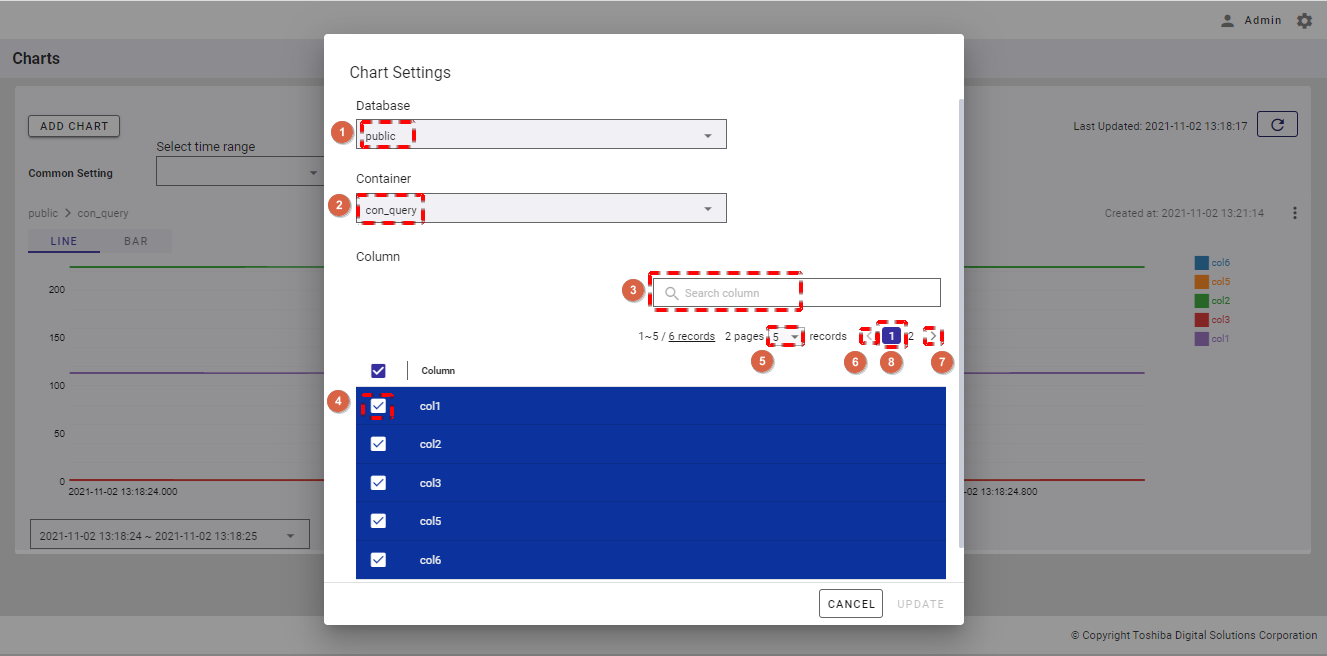
Step 3: After selecting the column, click the [UPDATE] button to update the chart in the chart list. If you do not want to update the chart, click the [CANCEL] button to close the panel and return to the chart list screen.
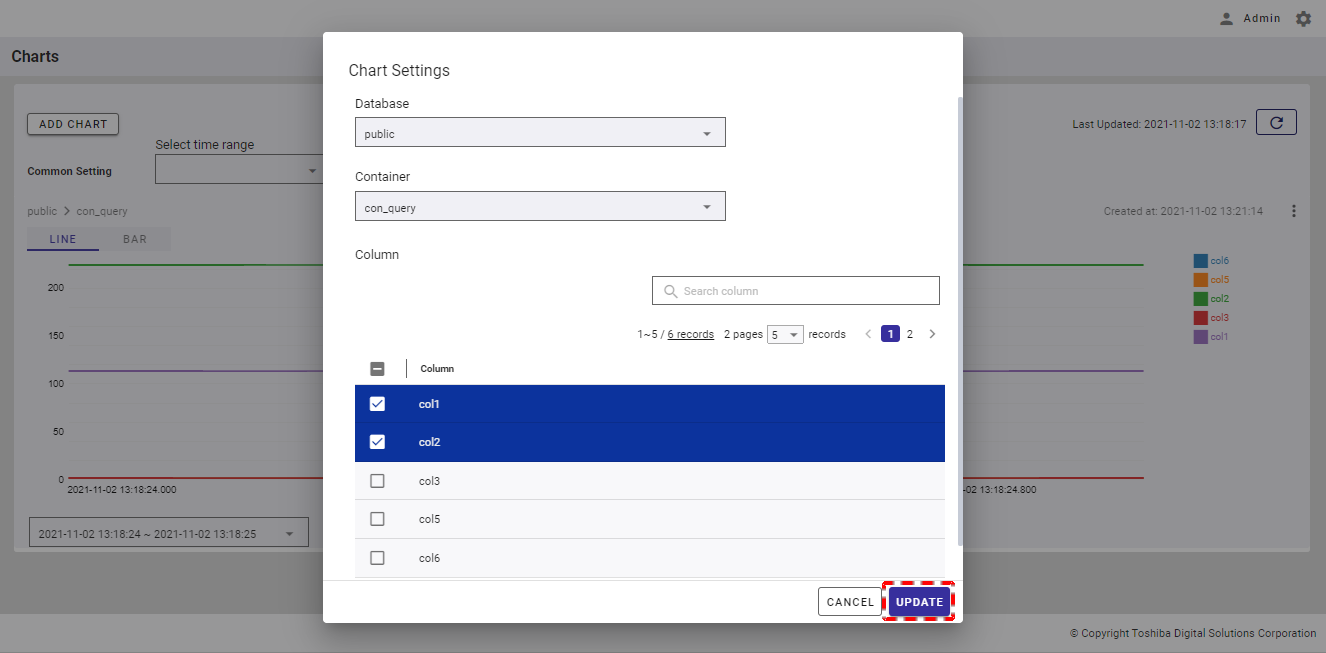
[Note]: The [UPDATE] button is enabled only when the edited chart settings differ from the current chart settings.
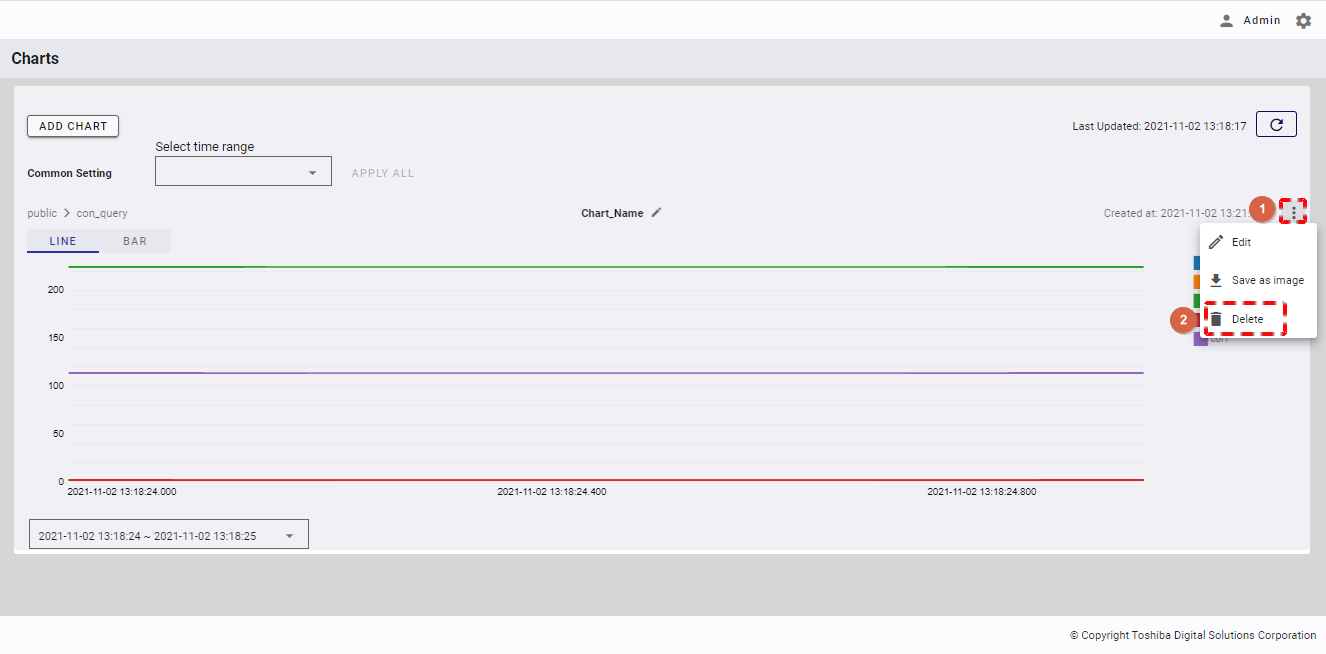
4.11.8 Deleting a chart
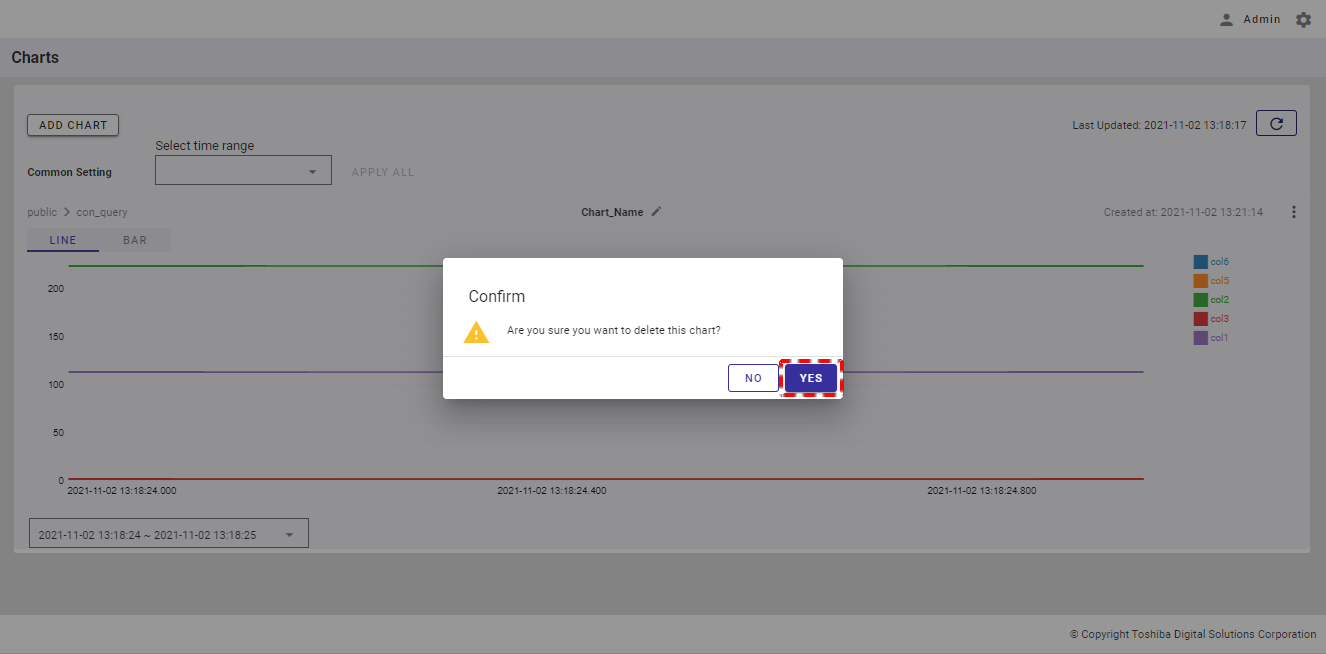
Step 1: To delete a chart, click the [Chart Menu] button (①). In the drop-down list, select the [Delete] item (②).
Step 2: When the confirmation dialog is displayed, click the [YES] button to delete the chart. If you do not want to delete the chart, click the [NO] button to close the dialog.
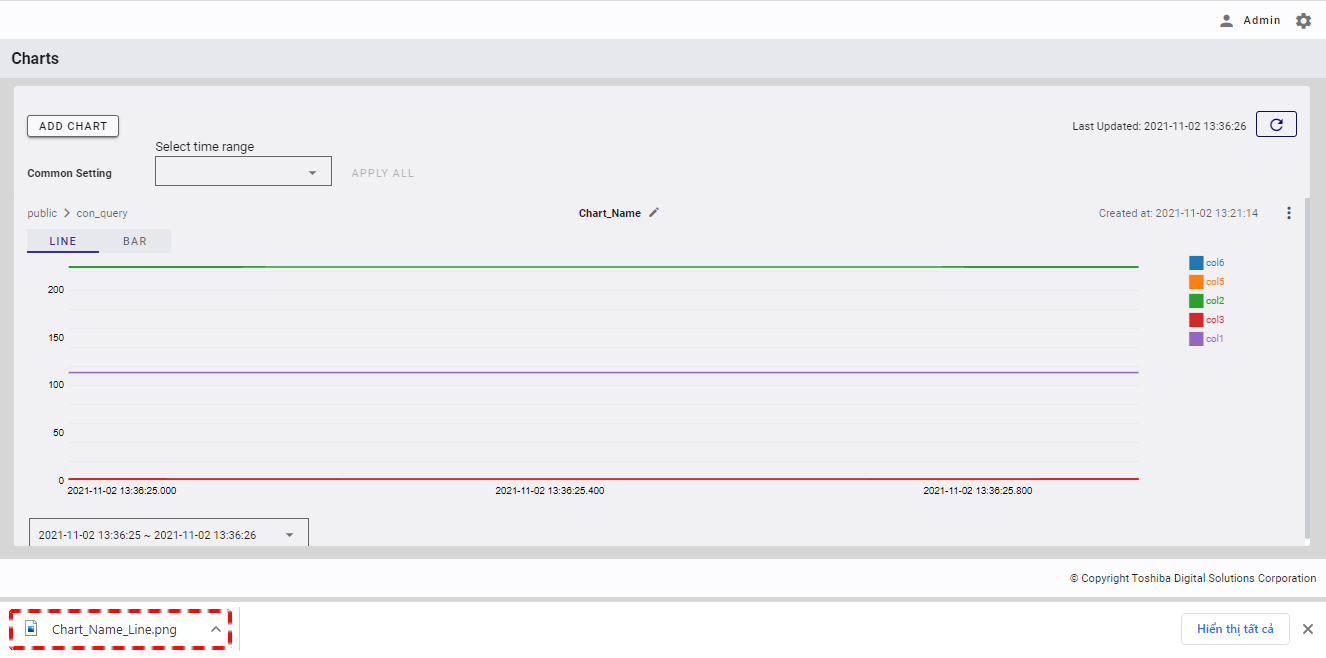
4.11.9 Saving a chart as an image
To save a chart as an image, click the [Chart Menu] button (①). In the drop-down list, select the [Save as image] item (②).
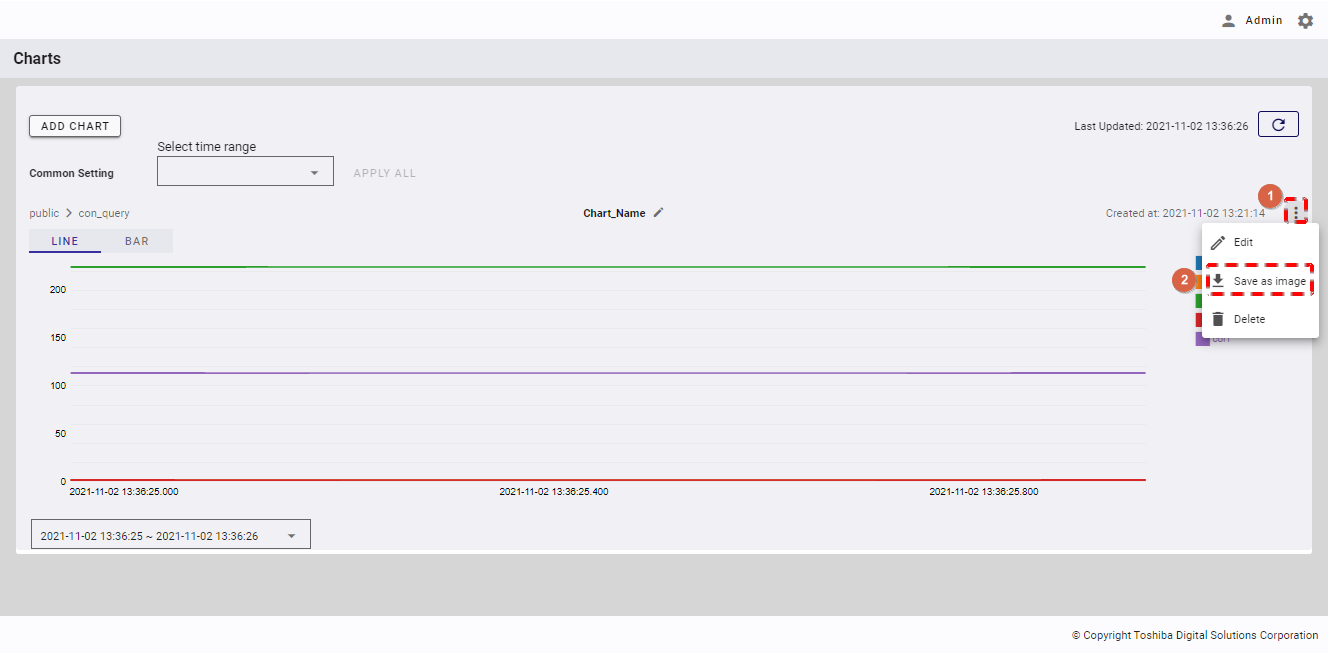
[Note]: You cannot save a chart as an image if this chart has no data.
You can see that the image is already downloaded to your device locally.
4.12 Query function
This function is used for querying container data.
4.12.1 Available roles
The role marked with a plus sign (+) in the table below can use the function.
| Function | General user | Administrator user |
|---|---|---|
| Change SQL/TQL mode | + | + |
| Select a query database | + | + |
| Select a TQL query container | + | + |
| Execute a query | + | + |
| Stop an SQL query | + | + |
| Clear a query | + | + |
| Undo a query | + | + |
| Redo a query | + | + |
| Copy a query | + | + |
| Set the count (for SQL) | + | + |
| Set the timeout (for TQL) | + | + |
| Set the limit | + | + |
| Display message logs | + | + |
| Display data output | + | + |
| Re-execute a query | + | + |
| Delete a query history | + | + |
| Insert a script using a query template | + | + |
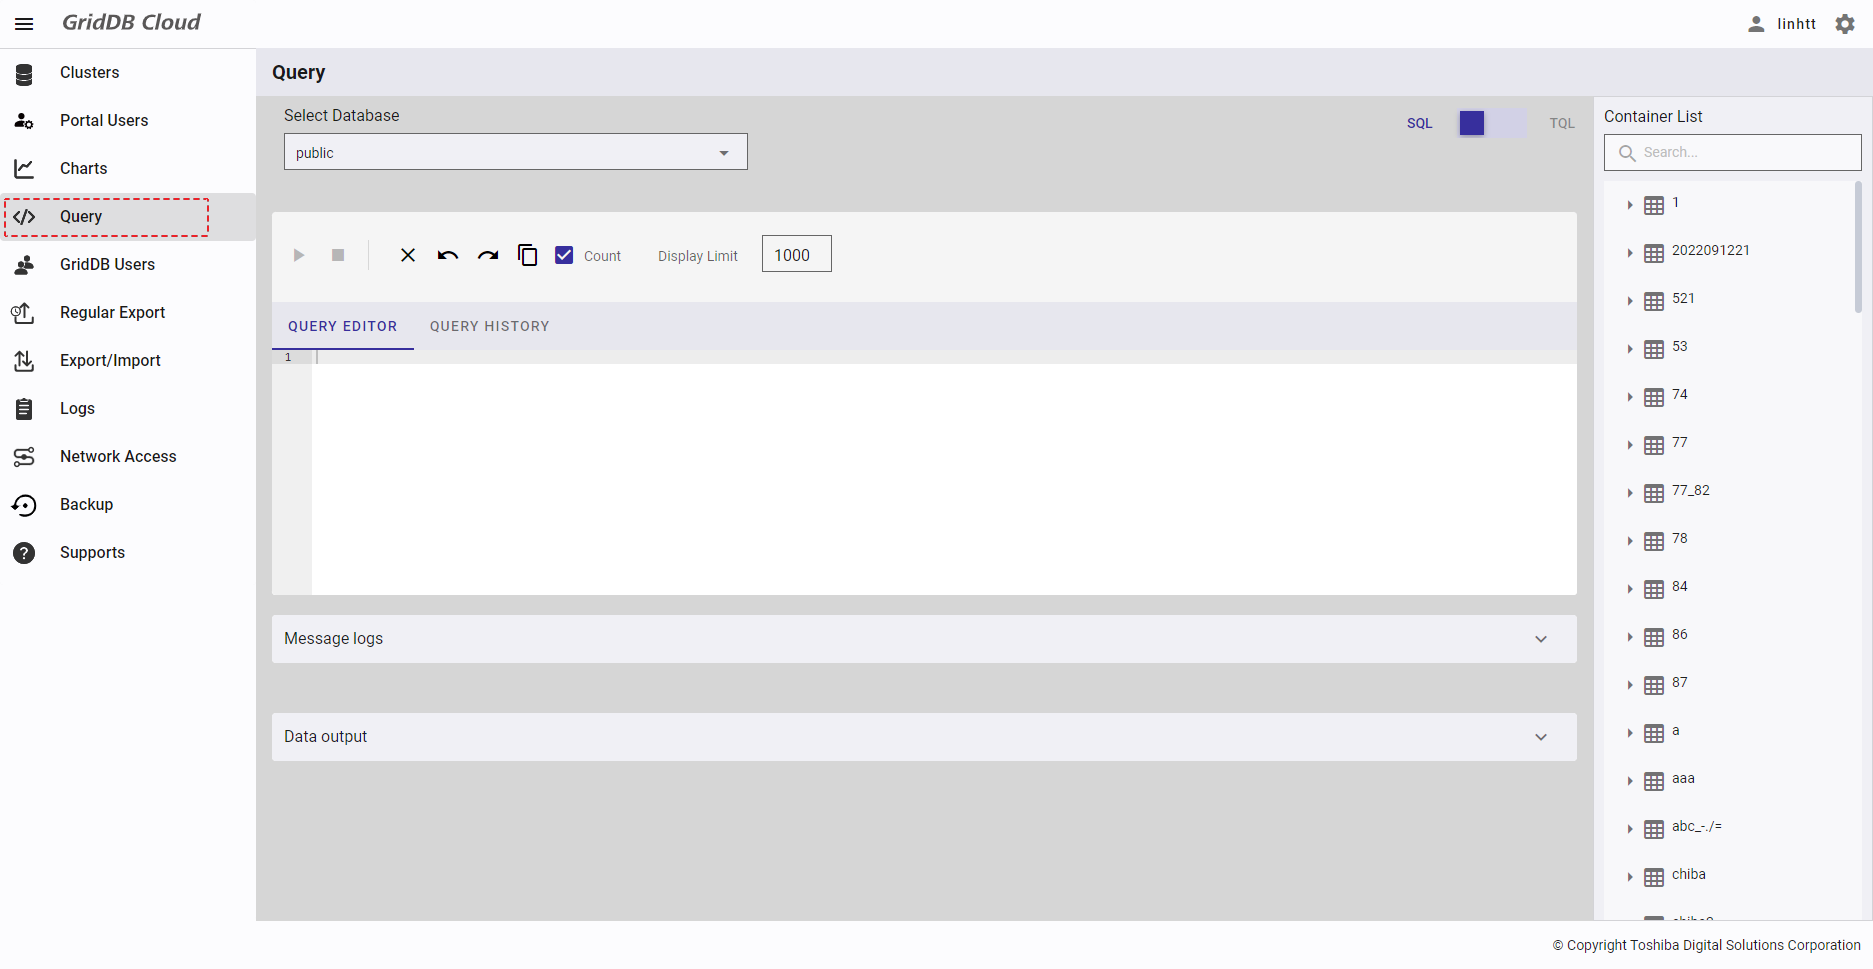
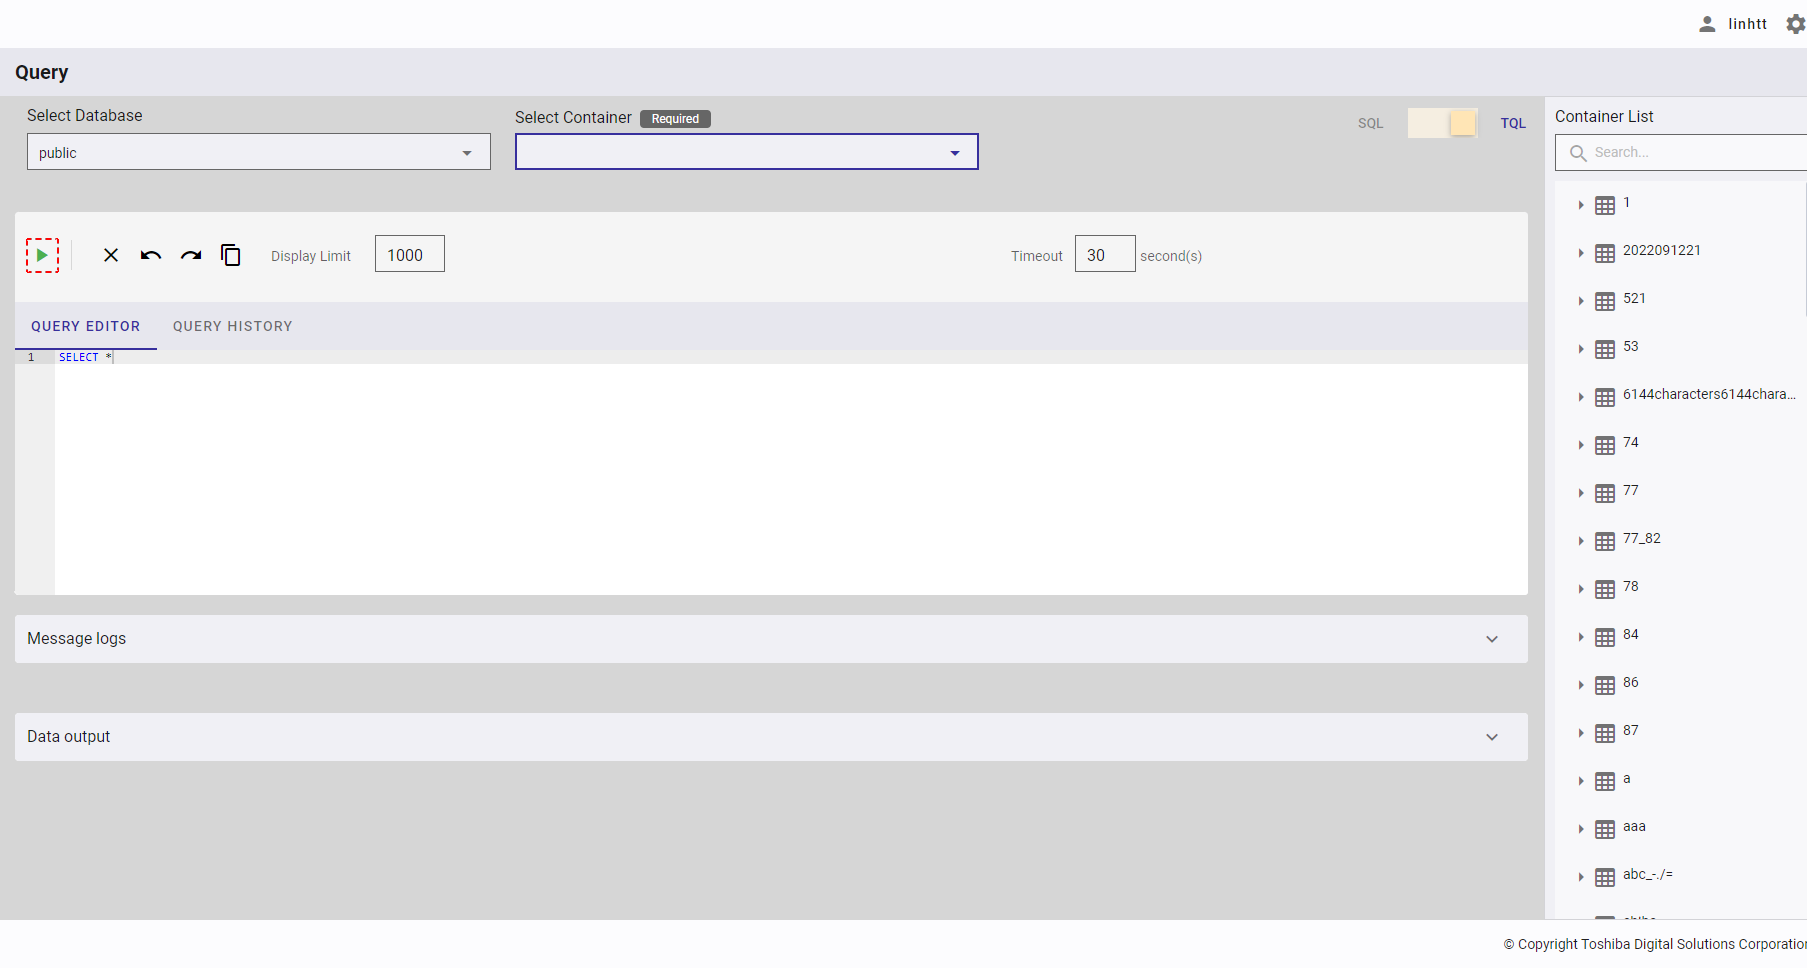
4.12.2 Query action
To access the screen shown below, first you must log in to the system and then click the item [Query] in the left menu.
4.12.2.1 Changing SQL/TQL mode
The default query mode is SQL. To change the mode, click the switch button (①) on the right of the screen.
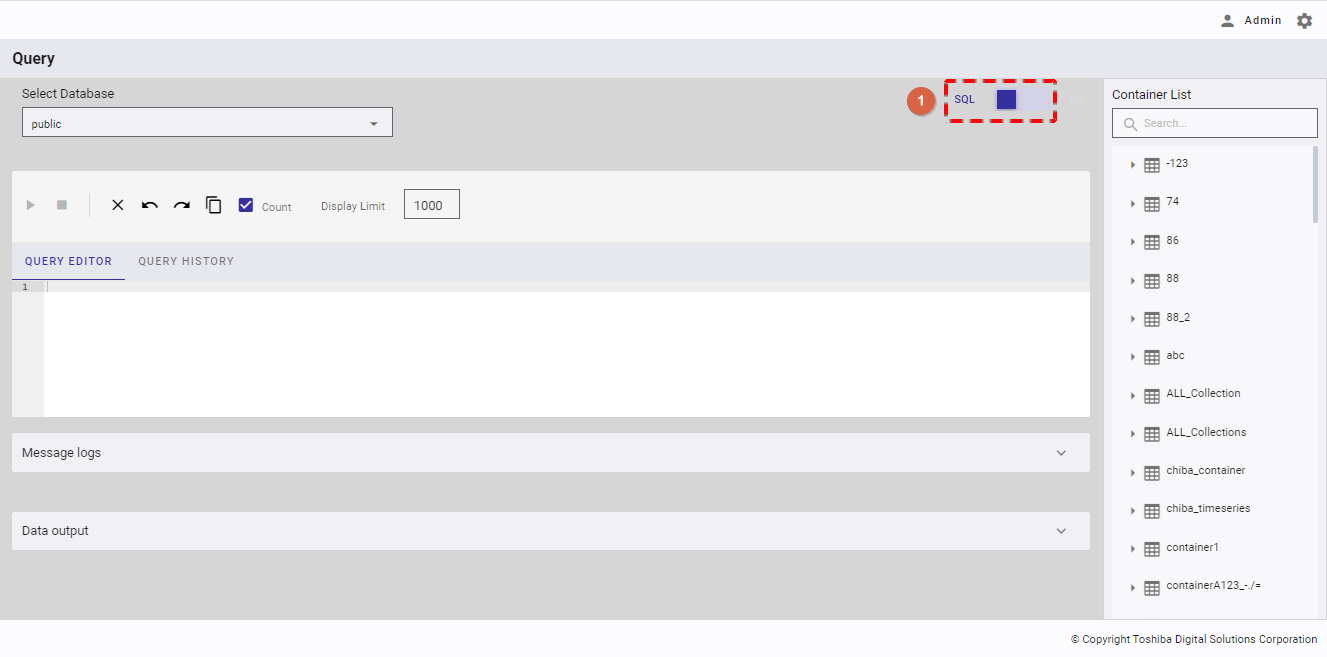
The mode is now changed to TQL. To change the mode back to SQL, click the switch button (①) again.
4.12.2.2 Selecting a query database
This function is available in both SQL and TQL modes.
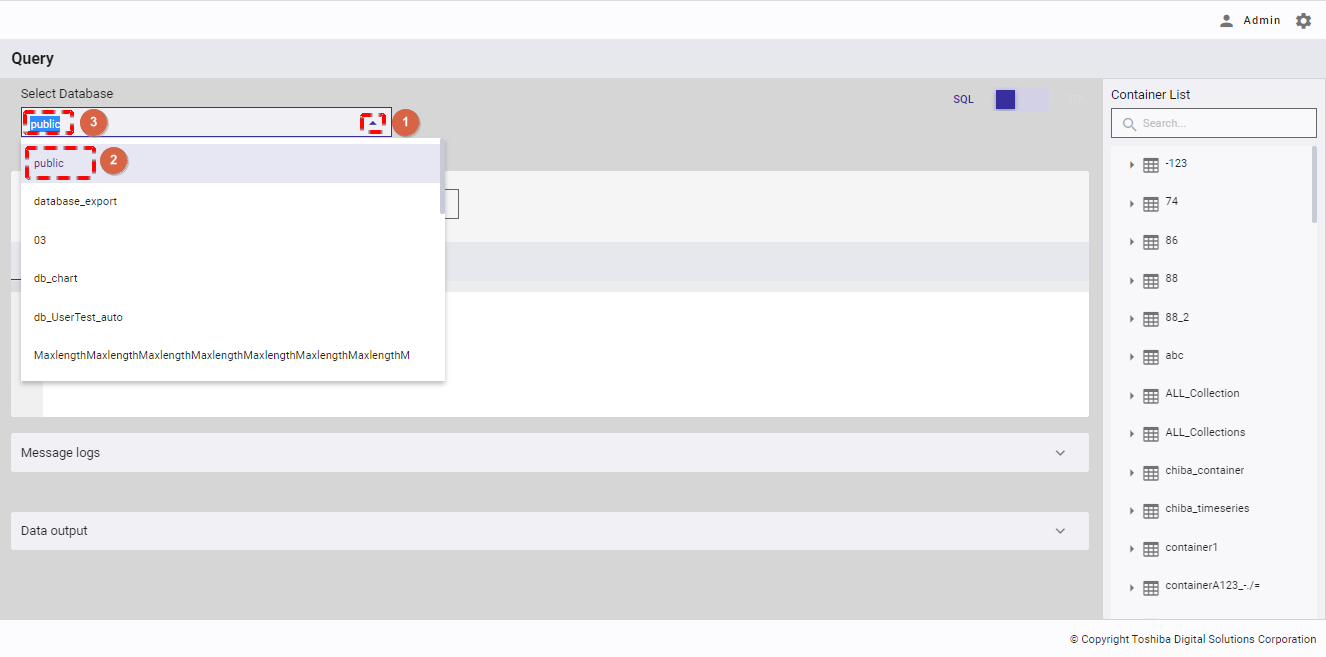
Step 1: Select a database in [Select Database] and click the drop-down button (①). In the drop-down list, select the database name (②) or enter the database name you want to search for (③).
Step 2 (Optional):
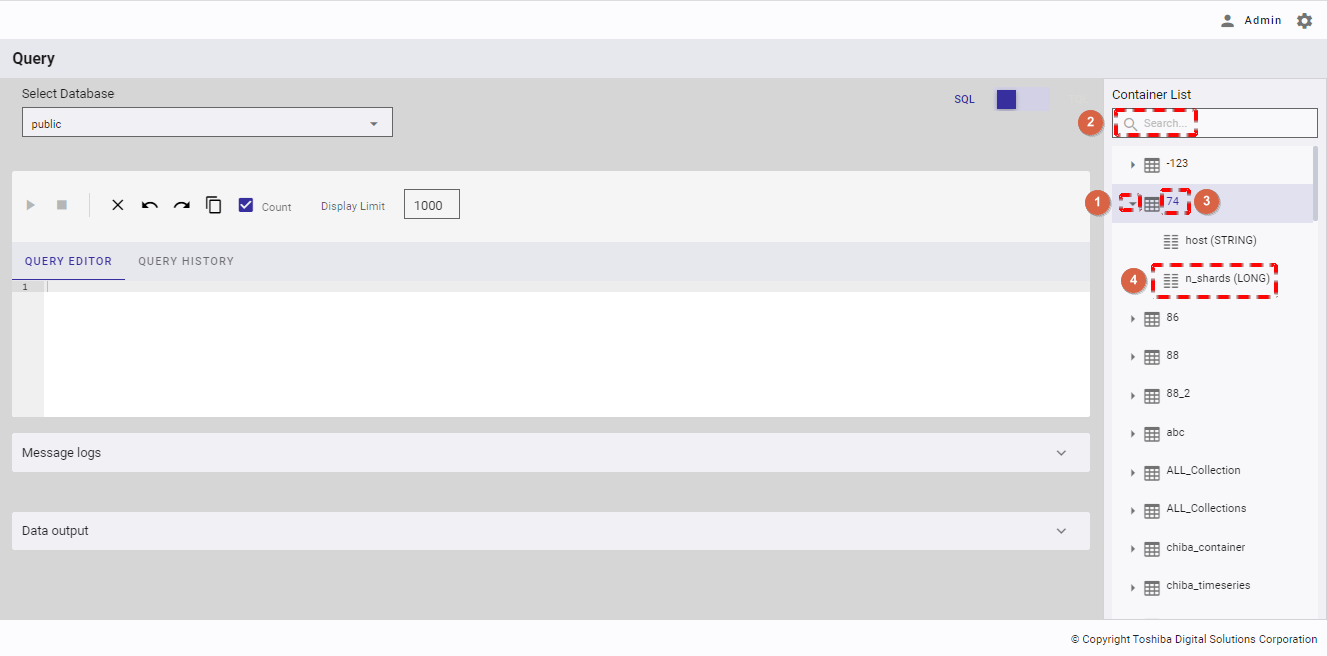
- After selecting a database, you can check the container list and column list in the right navigation panel as described below.
- Click the drop-down button (①) on the left of the container name (③).
- The column list of that container will be displayed with the column name and column type (④).
- You can enter a container name in the search box and then press the enter key to search for that container name (②).
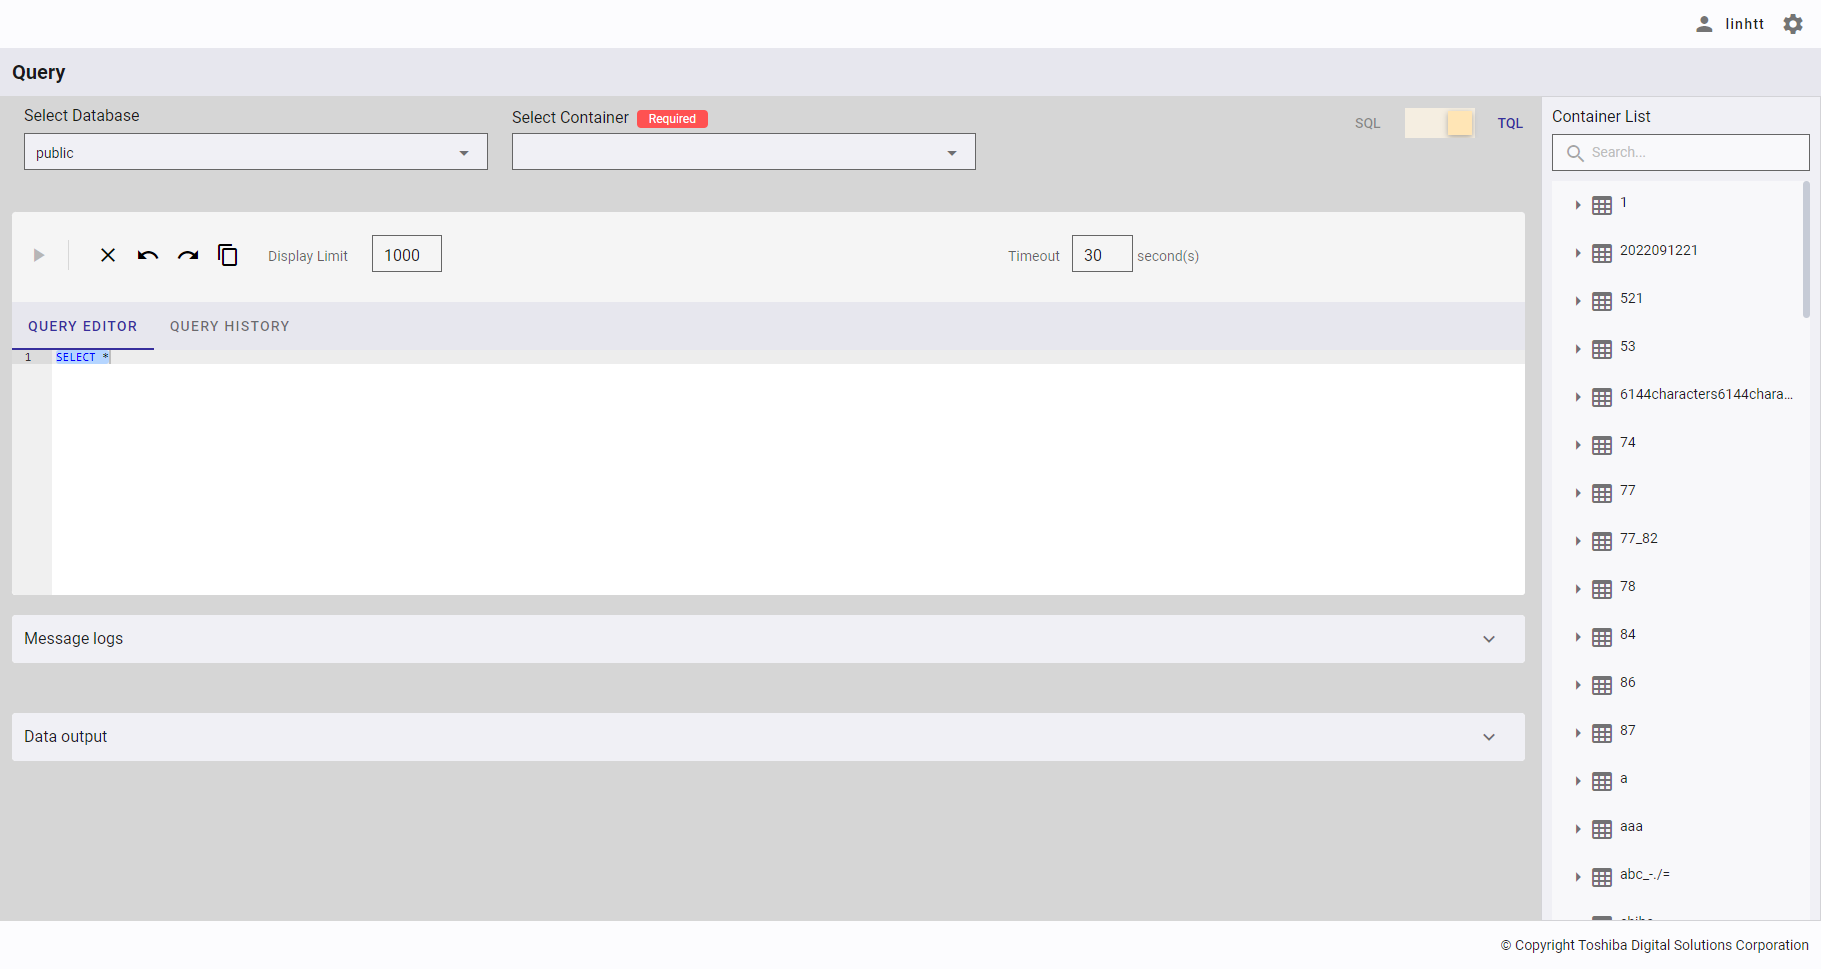
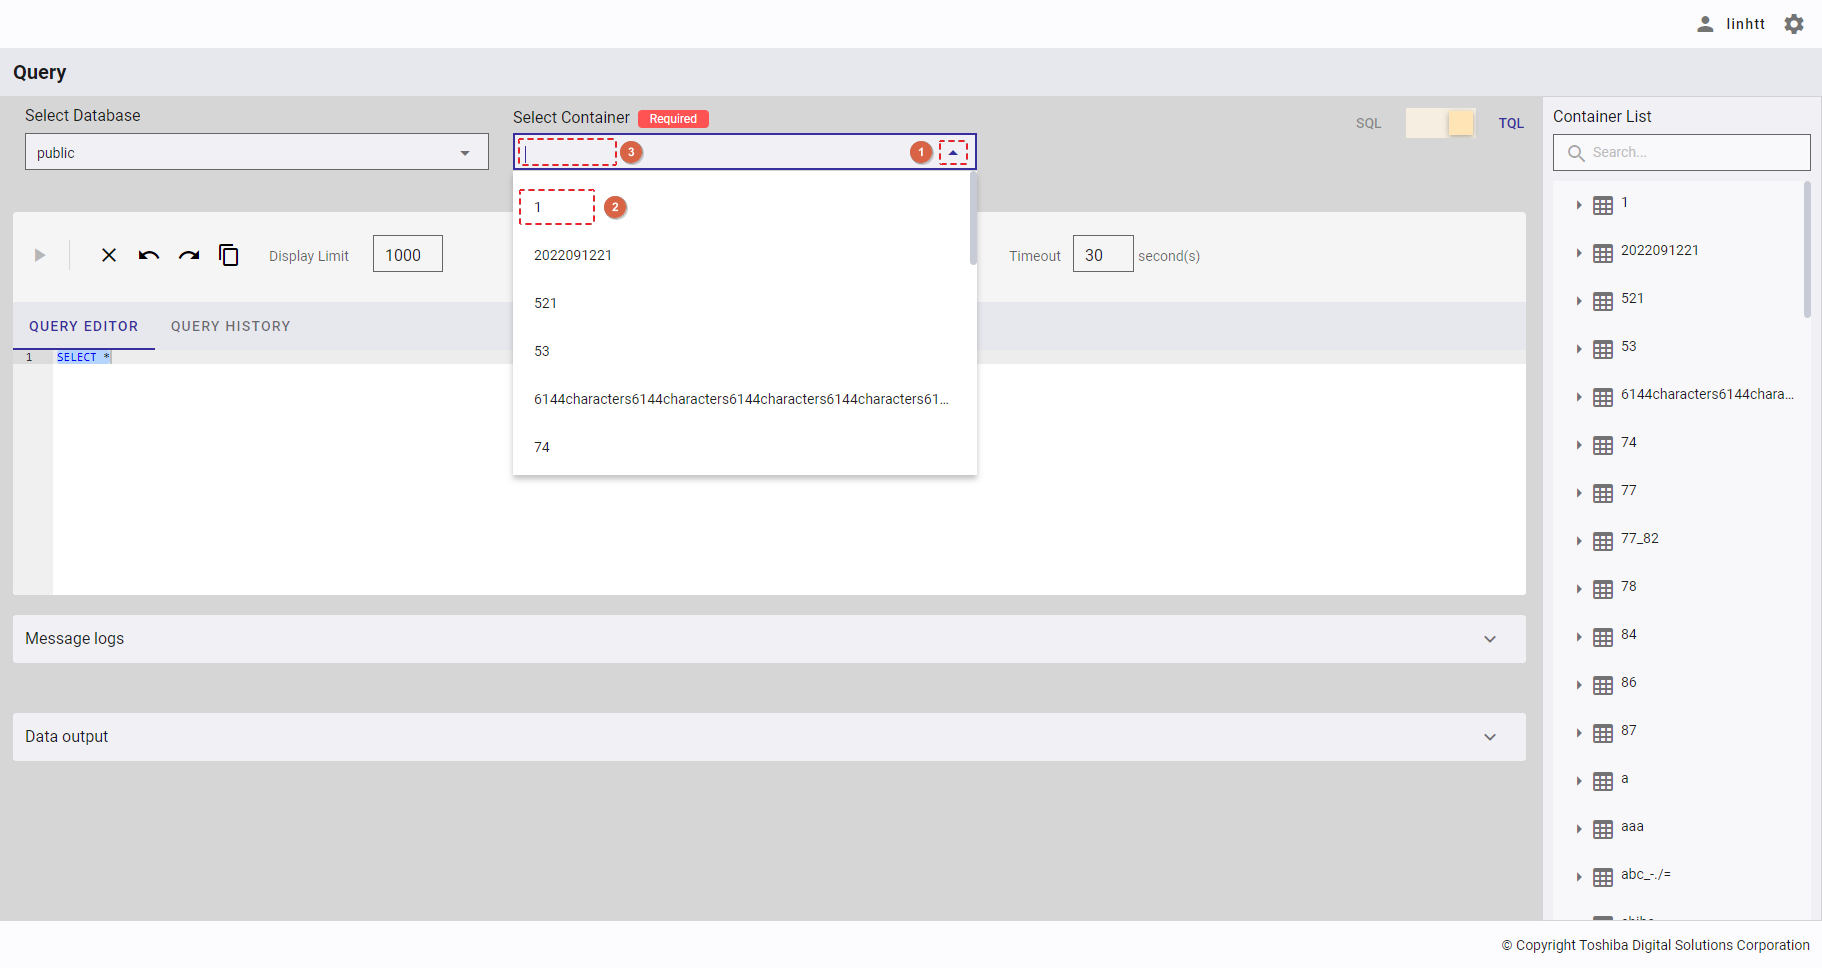
4.12.2.3 Selecting a TQL query container
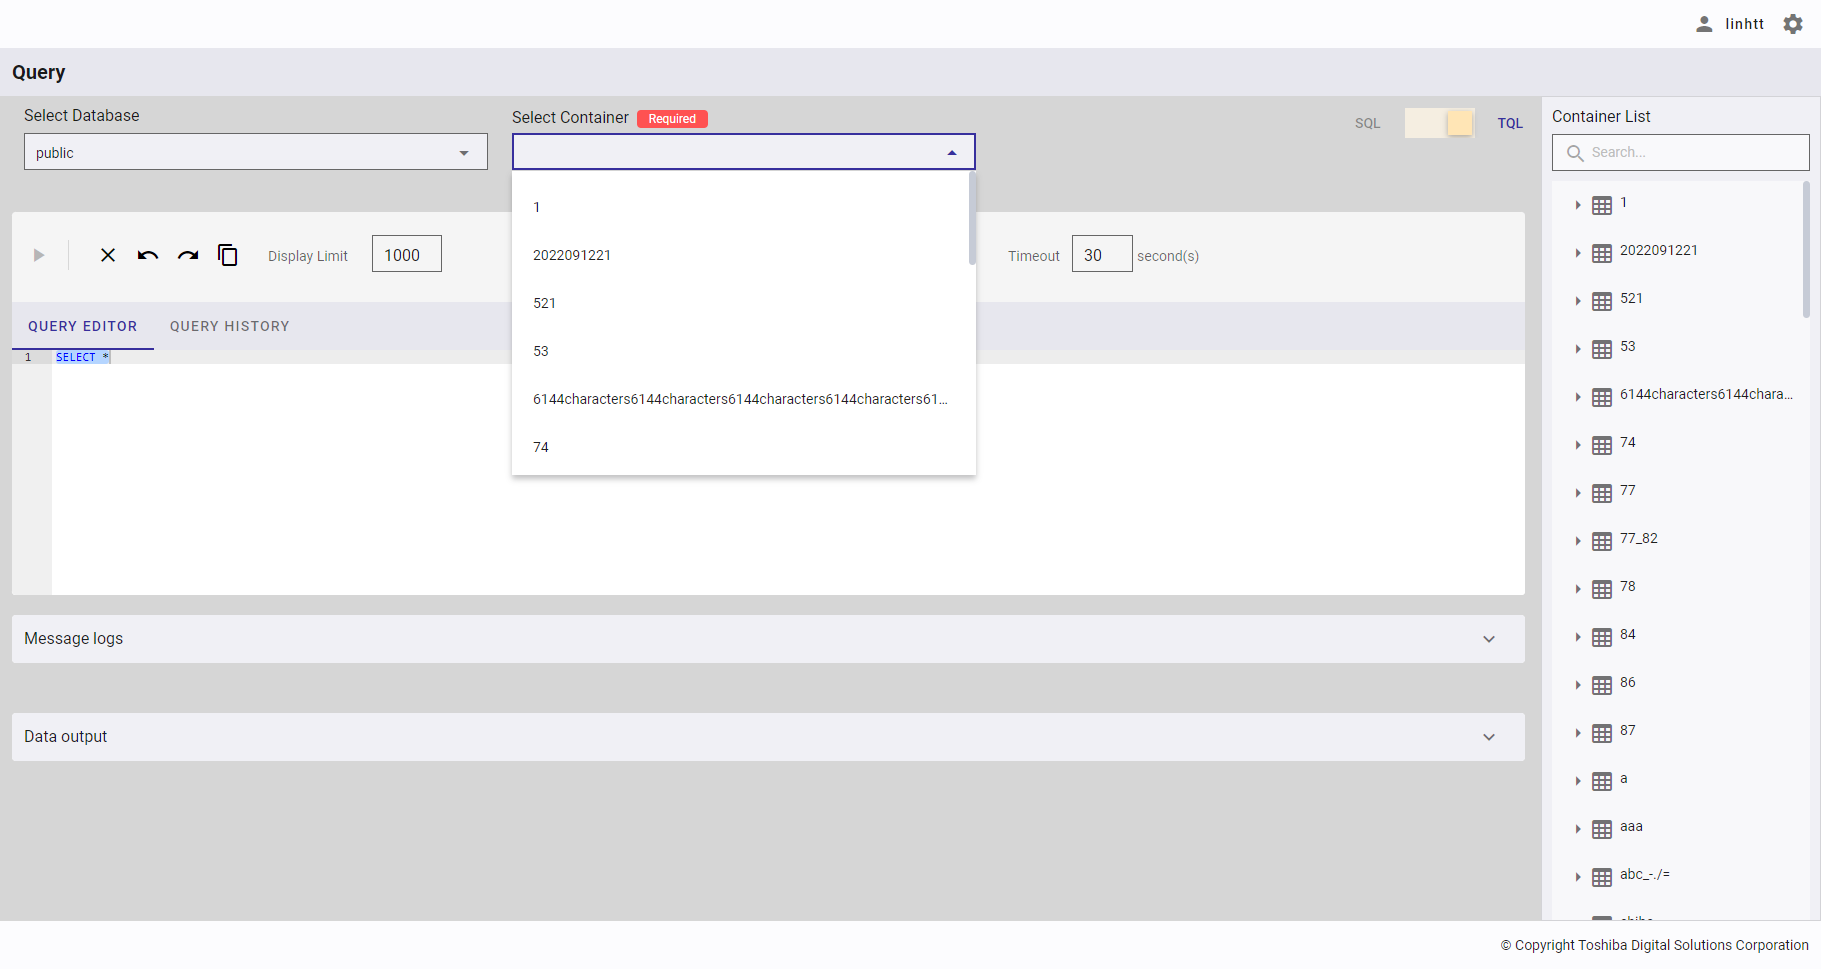
This function is only available in TQL mode.
Click the drop-down button (①) in [Select Container]. In the drop-down list, select the container name (②) or enter the container name you want to search for (③).
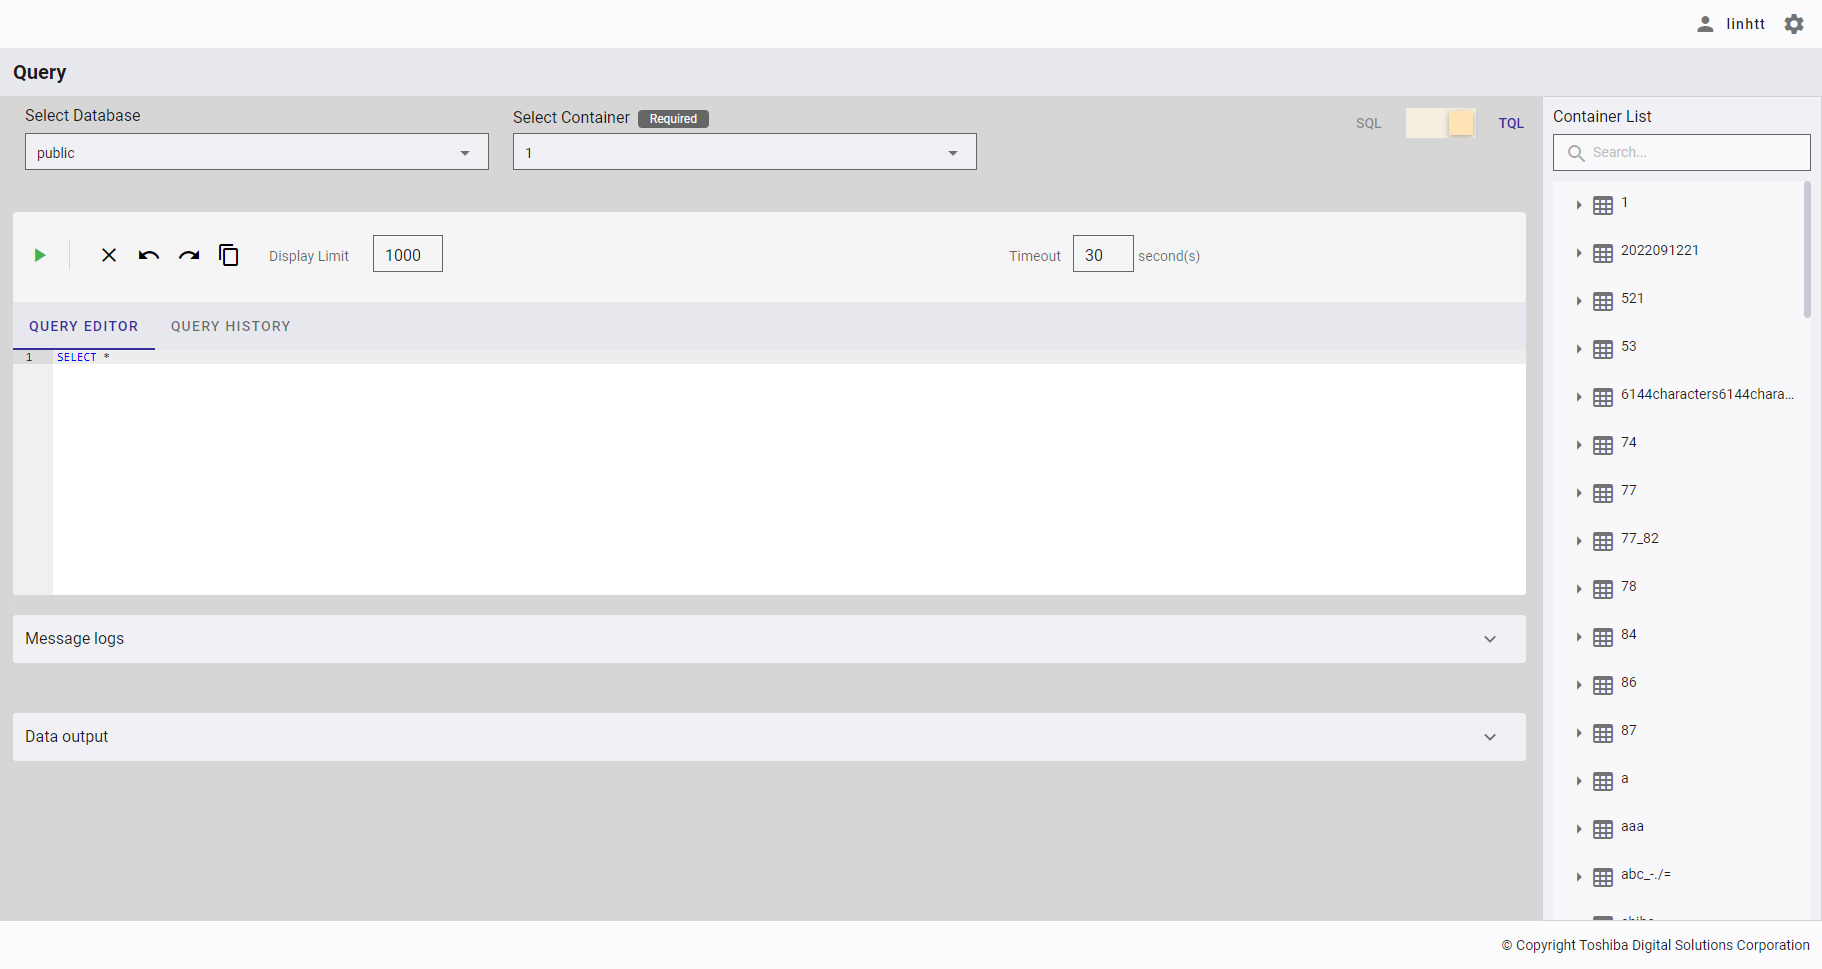
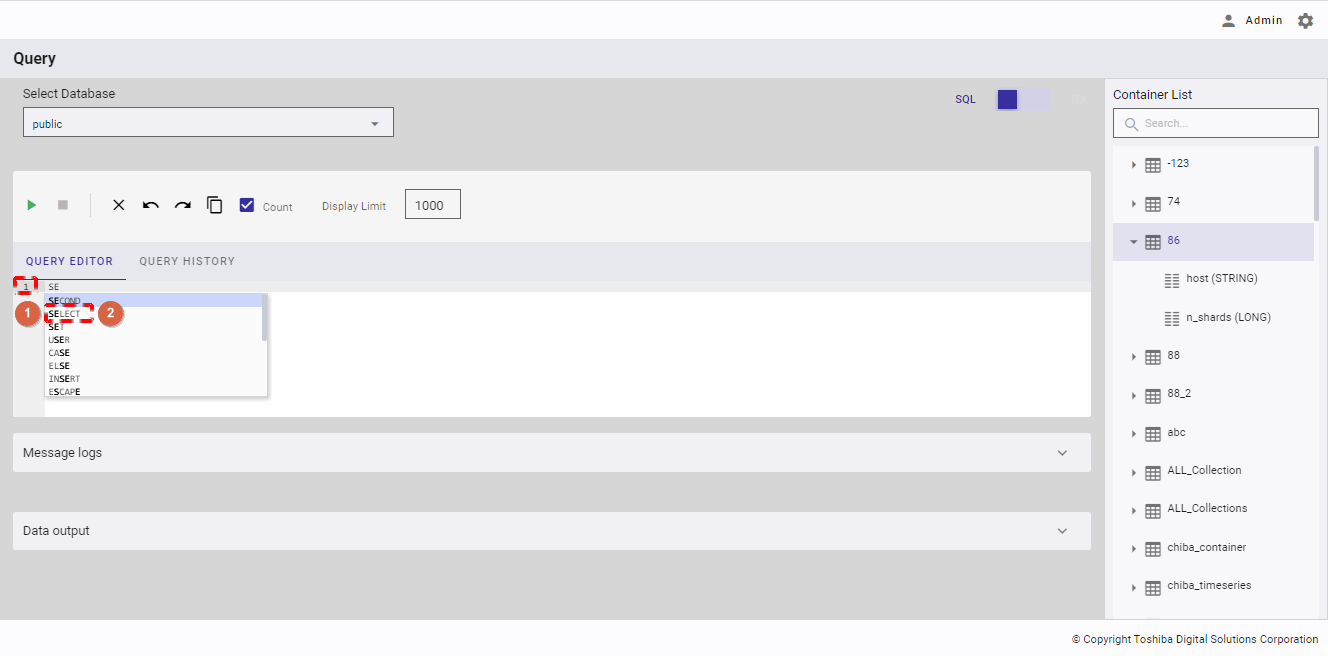
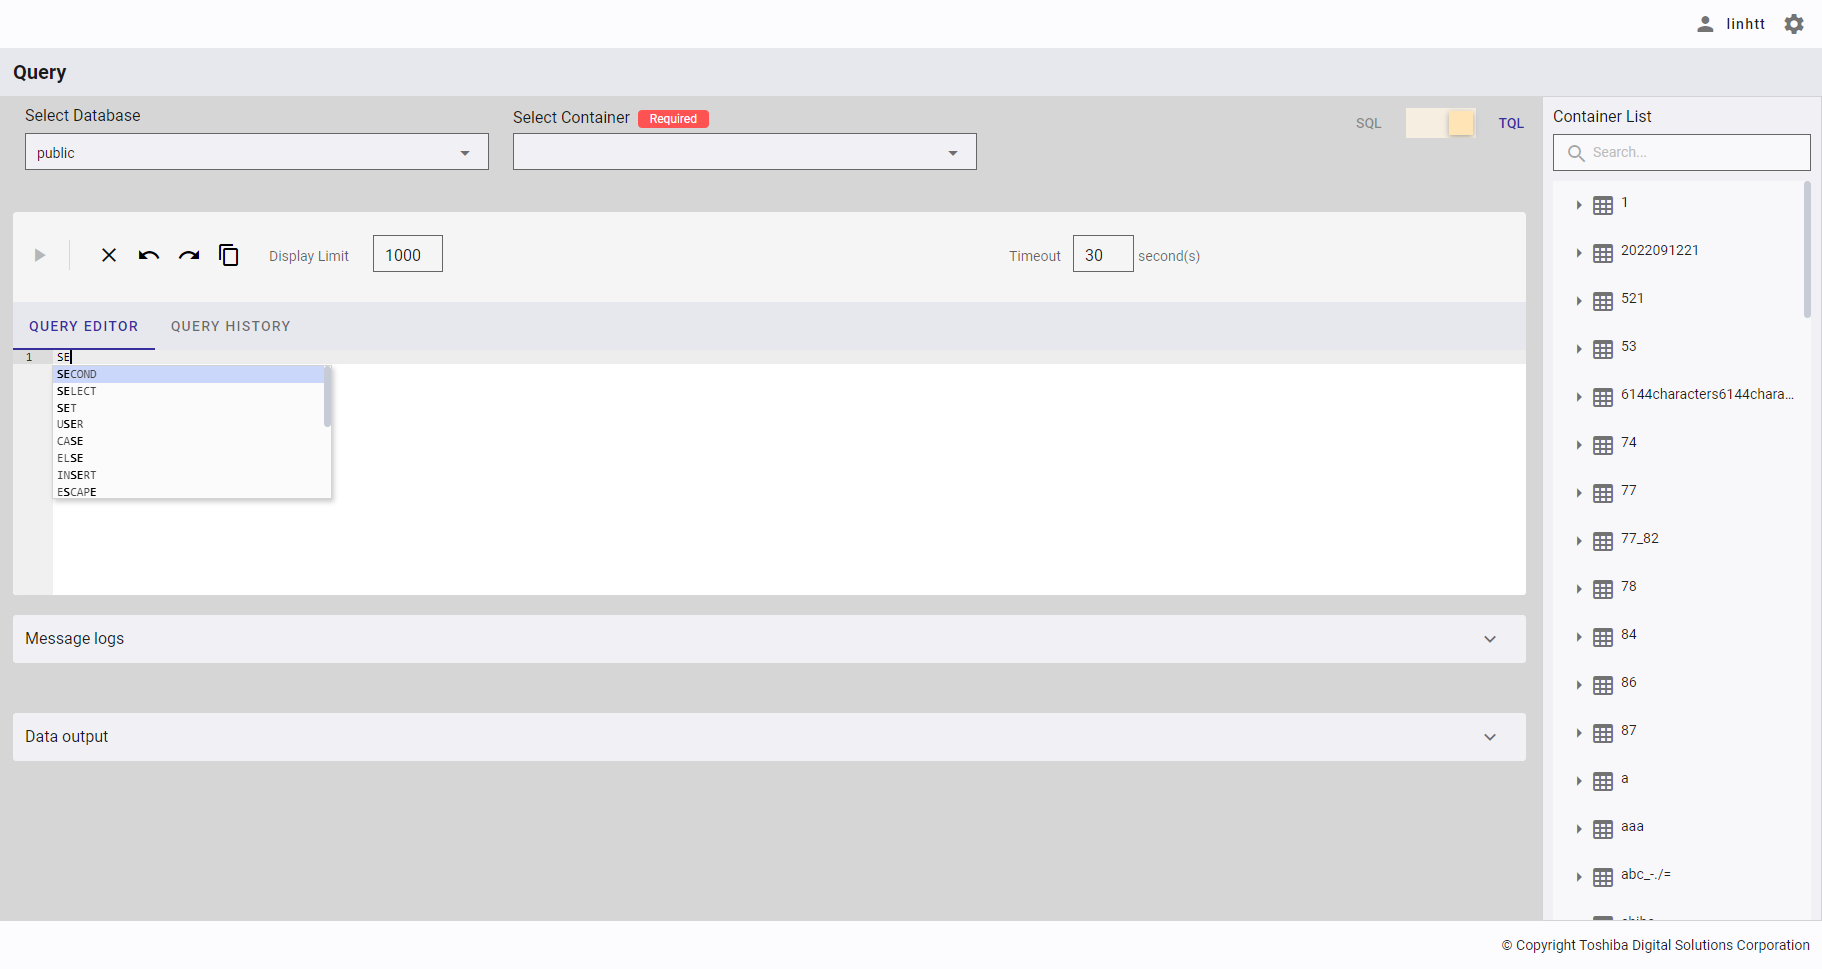
4.12.2.4 Executing a query
This function is available in both SQL and TQL modes.
Step 1: After choosing a database and a container (only in TQL mode), enter a query in [QUERY EDITOR]. You can select whether to quickly insert an SQL statement using auto completion (②) or manually insert an SQL statement. This query editor shows the row number (①).
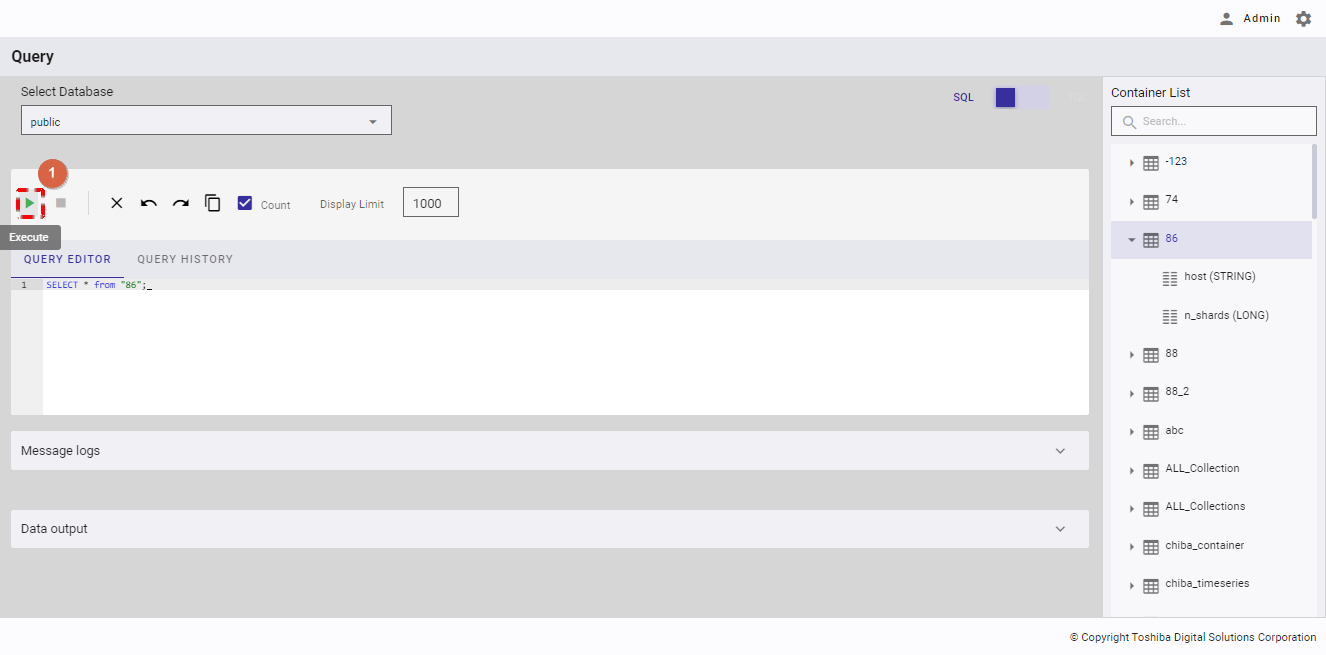
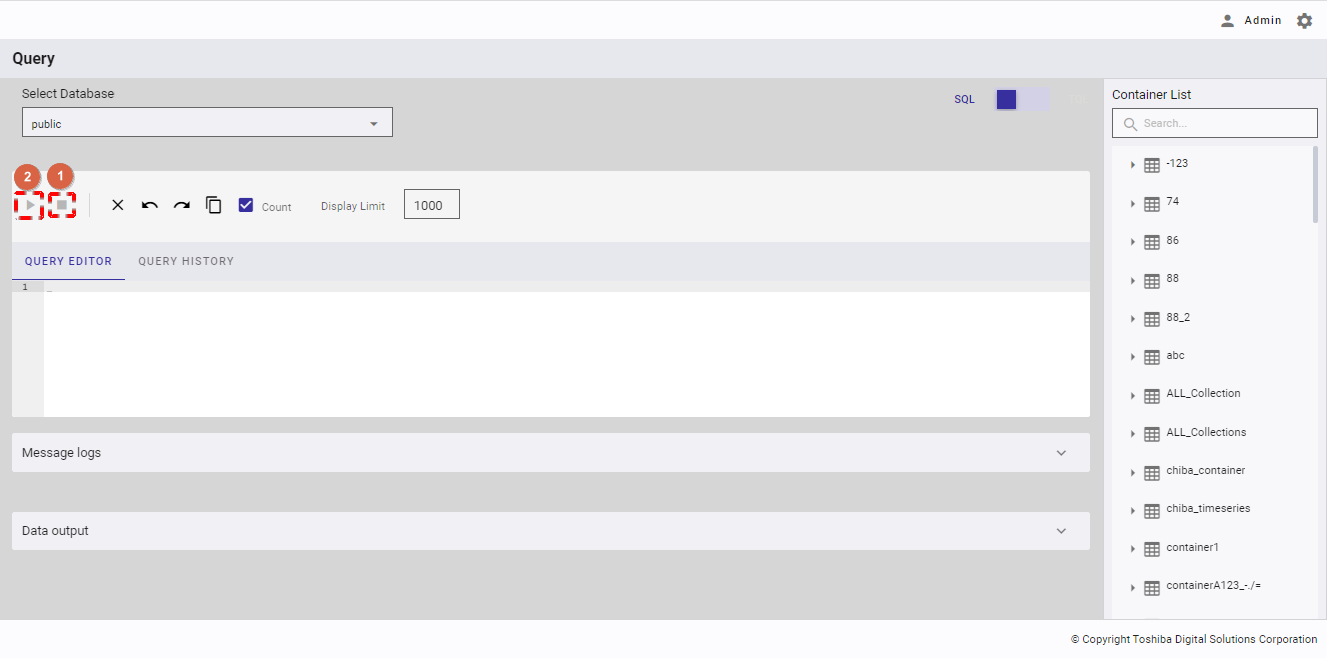
Step 2: When the [Execute] button (①) is enabled, click it to execute the query.
4.12.2.5 Stopping an SQL query
This function is only available in SQL mode.
The [Stop] button (①) is enabled after you click the [Execute] button (②). If a query takes a long time to respond, you can click the [Stop] button (①) to stop executing the query.
4.12.2.6 Clearing a query
This function is available in both SQL and TQL modes.
You can click the [Clear All] button (①) to clear all text in the query editor.
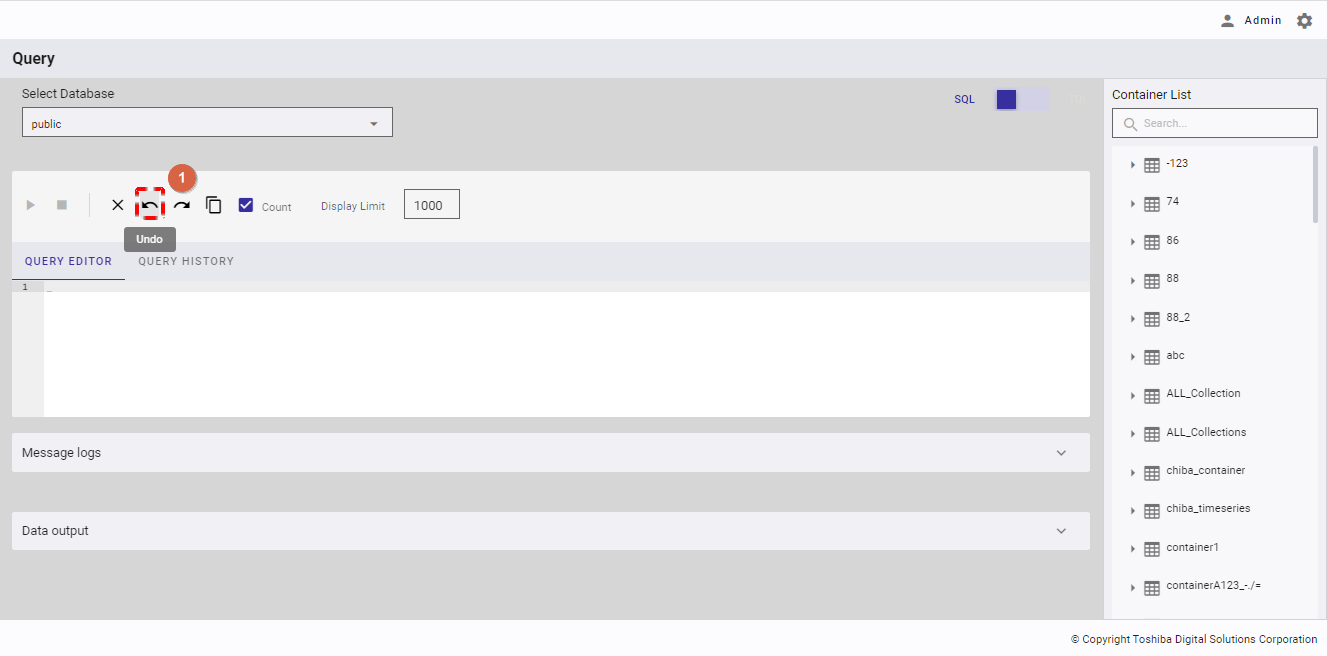
4.12.2.7 Undoing a query
This function is available in both SQL and TQL modes.
You can click the [Undo] button (①) to recover the previous query in the query editor.
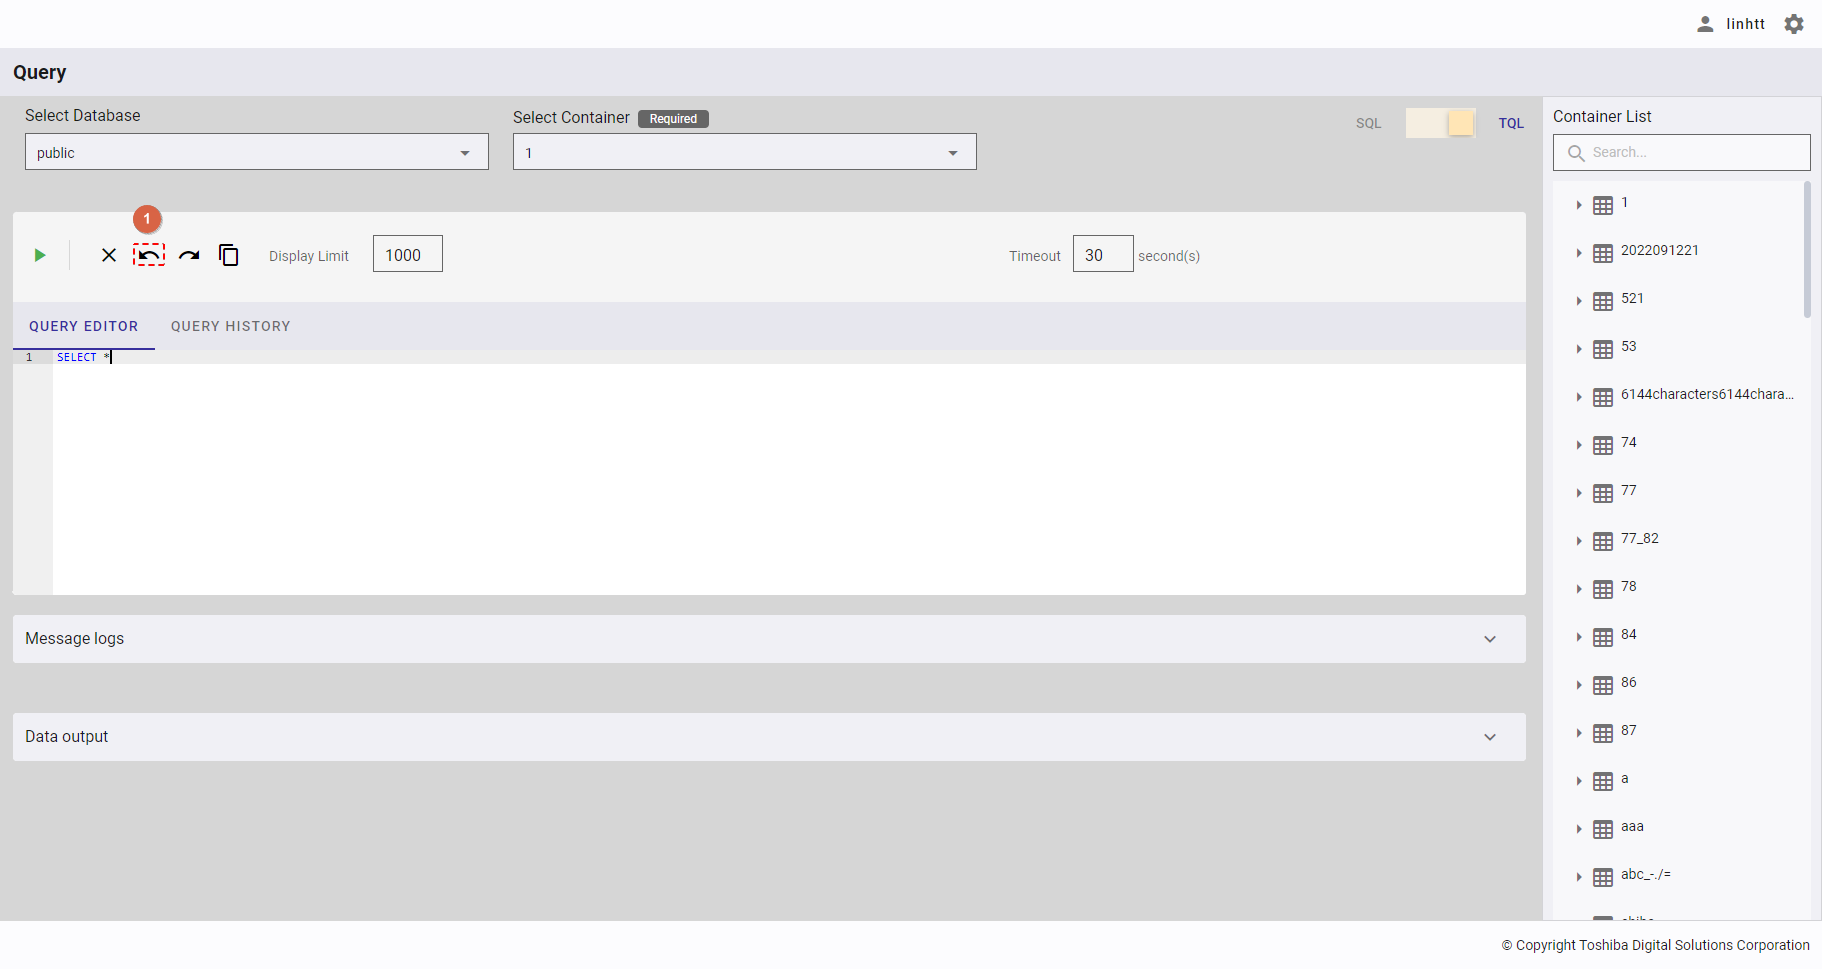
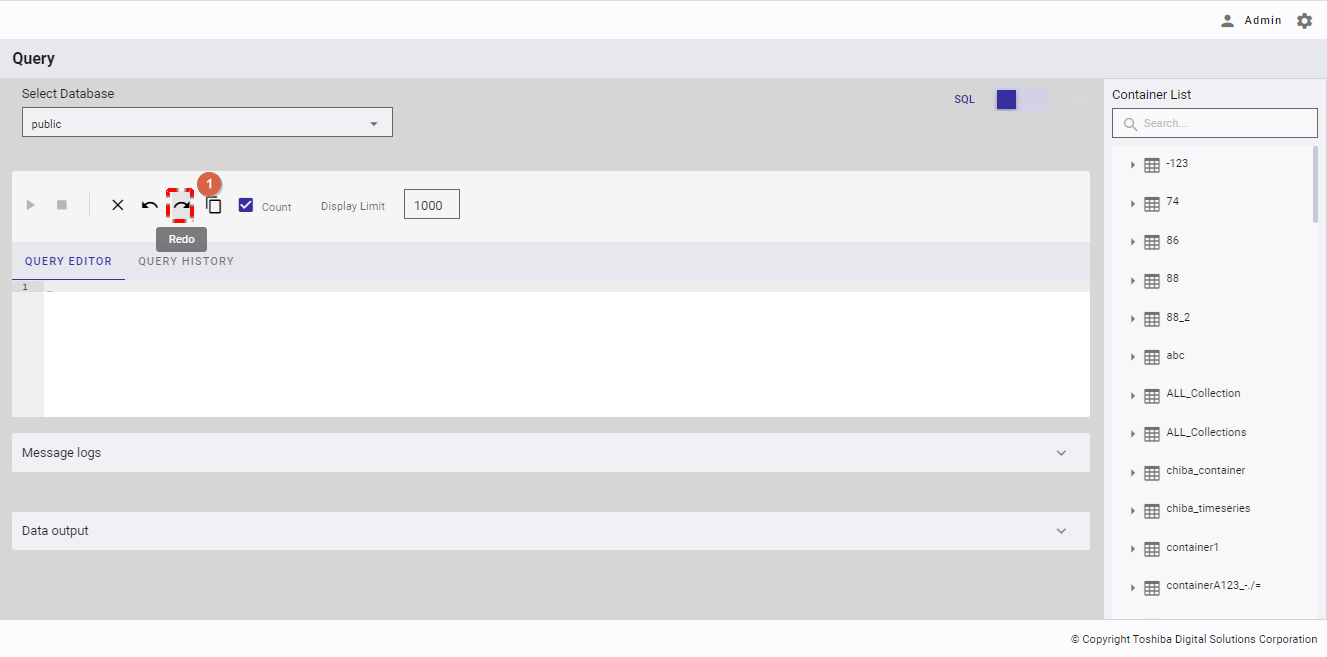
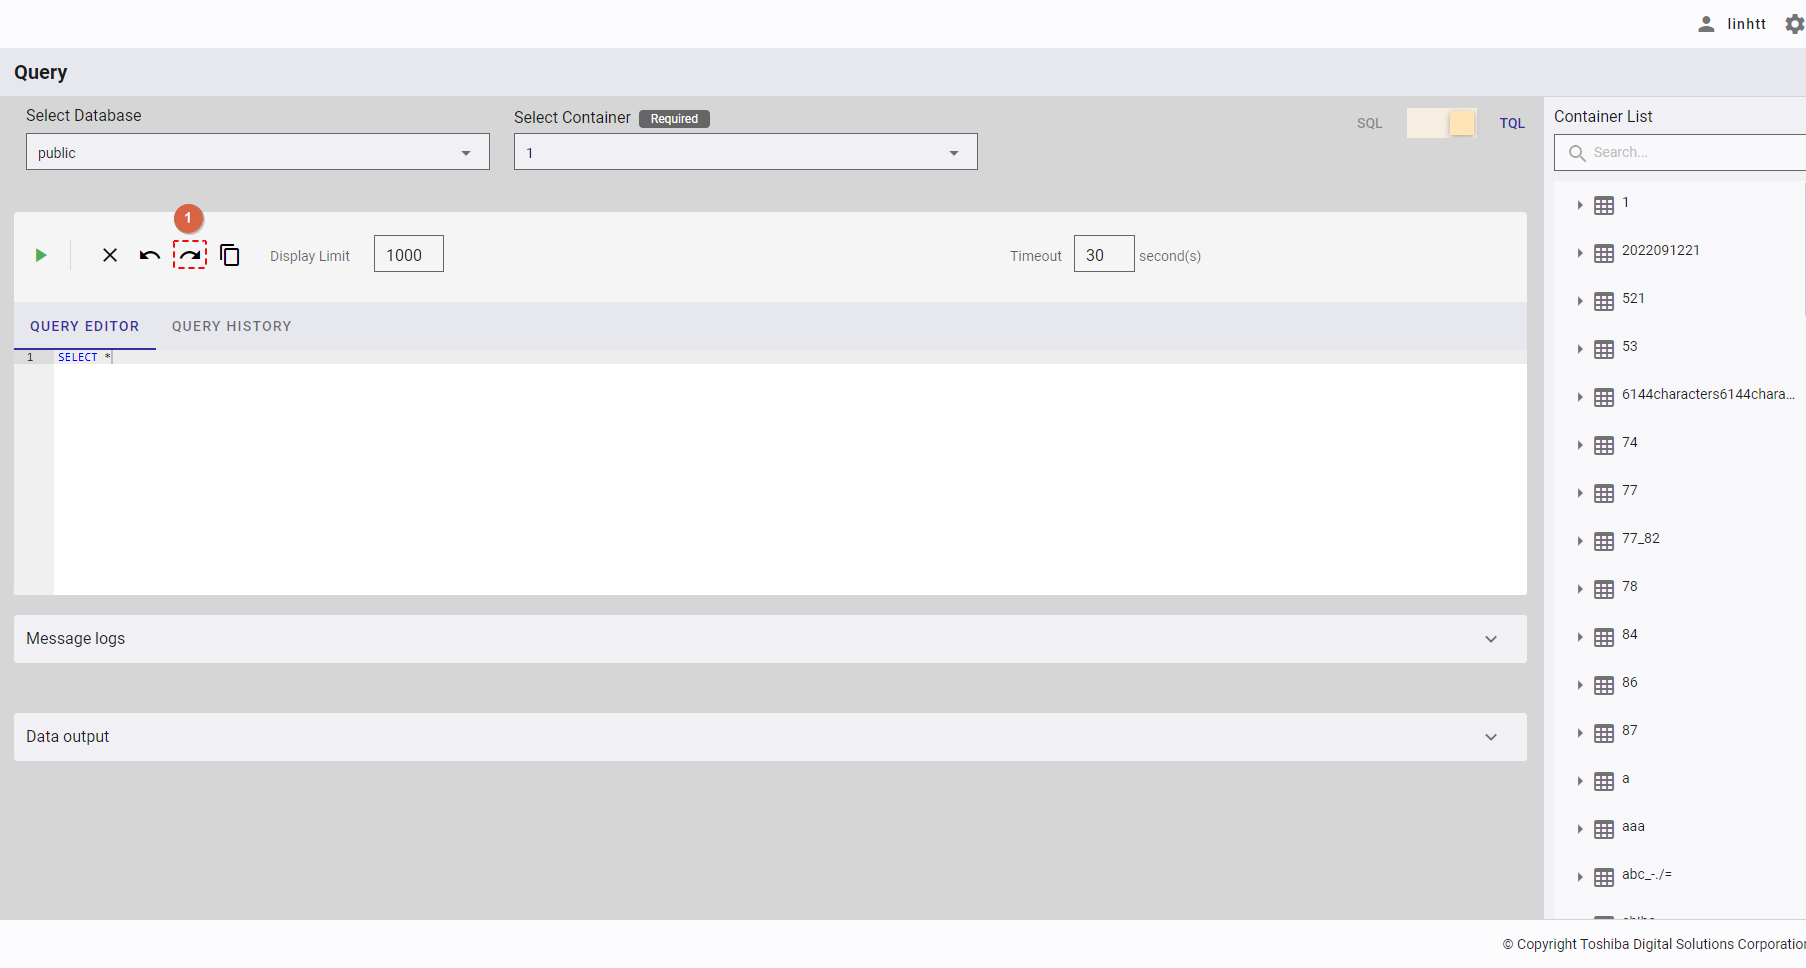
4.12.2.8 Redoing a query
This function is available in both SQL and TQL modes.
You can click the [Redo] button (①) after clicking the [Undo] button to return to the edited query that has been undone in the query editor.
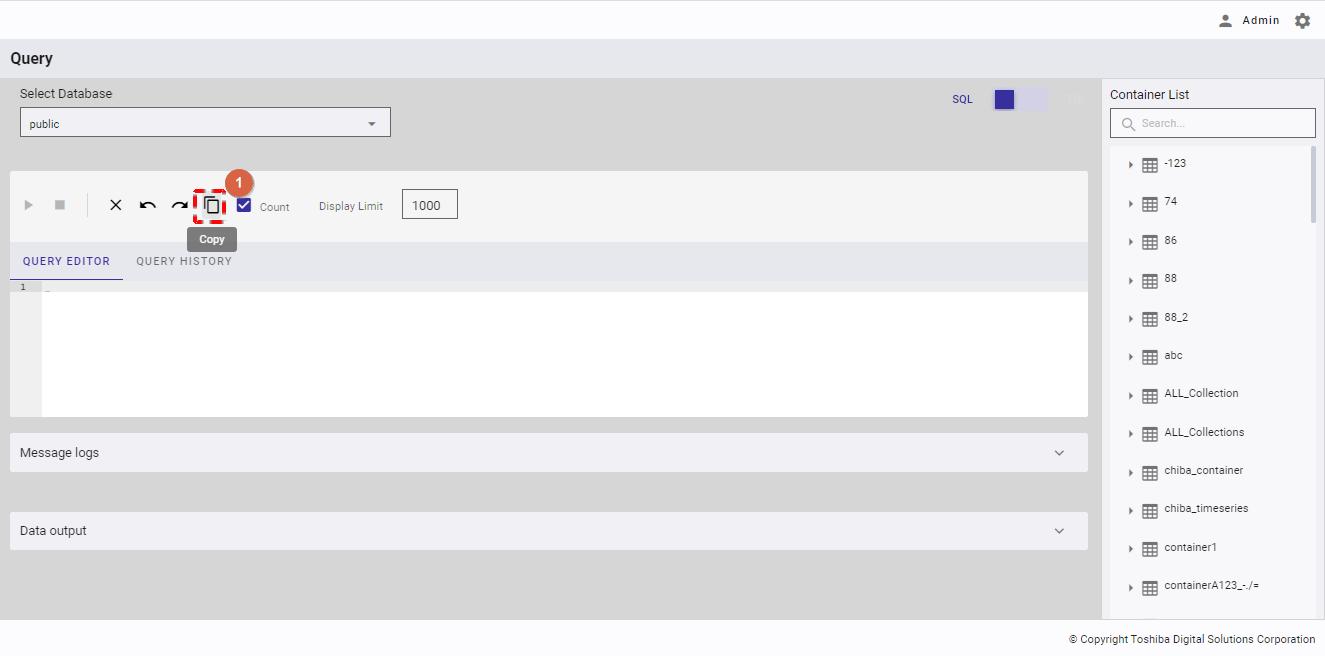
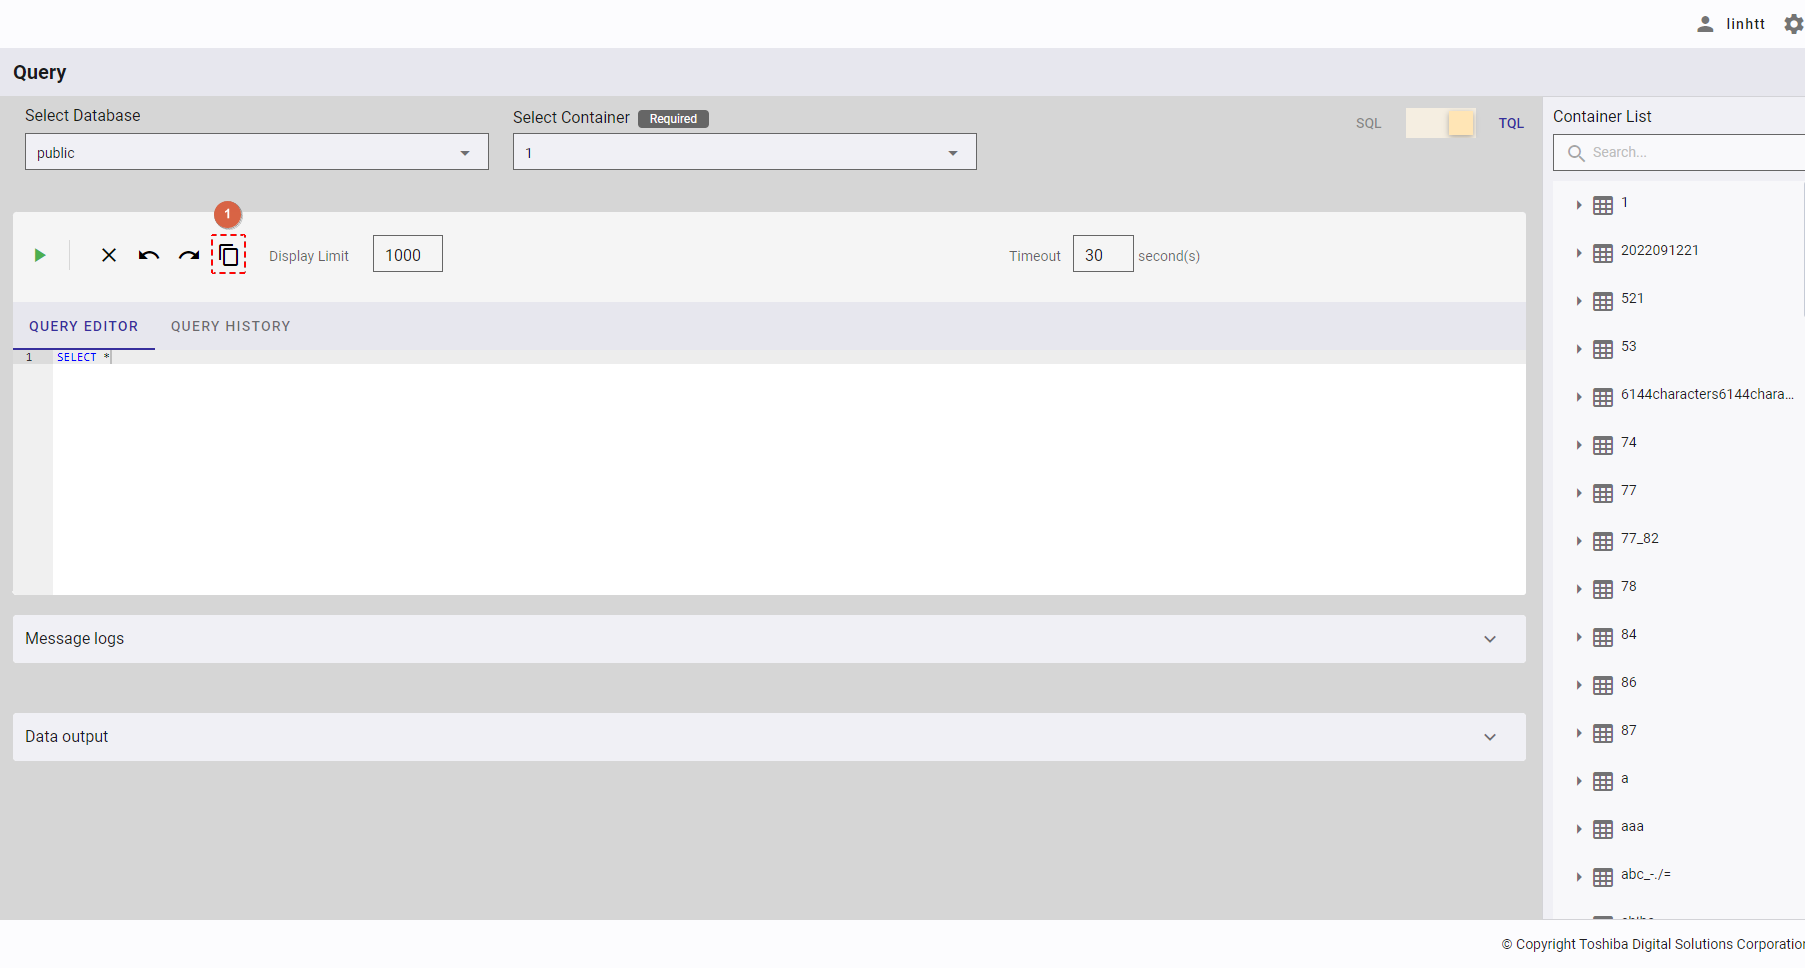
4.12.2.9 Copying a query
This function is available in both SQL and TQL modes.
You can click the [Copy] button (①) to copy all text in the query editor to the clipboard.
4.12.2.10 Setting the count
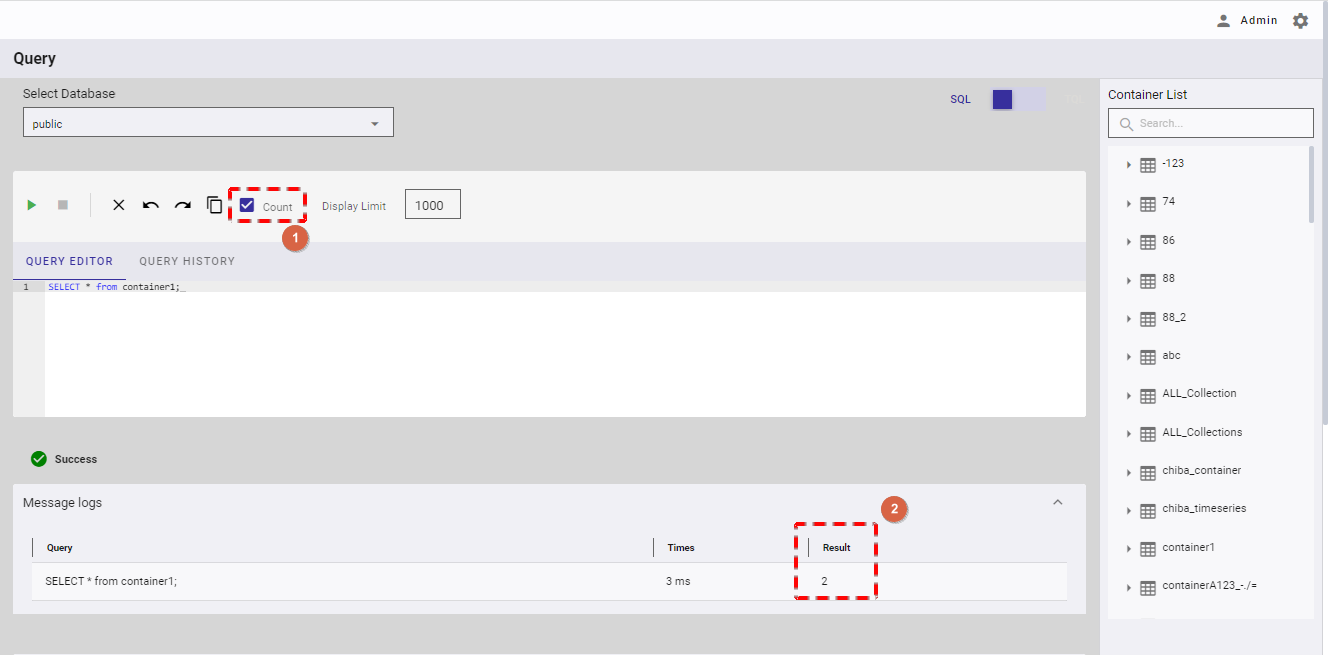
This function is only available in SQL mode.
You can check the [Count] checkbox (①) to count the number of results (②) after executing a query.
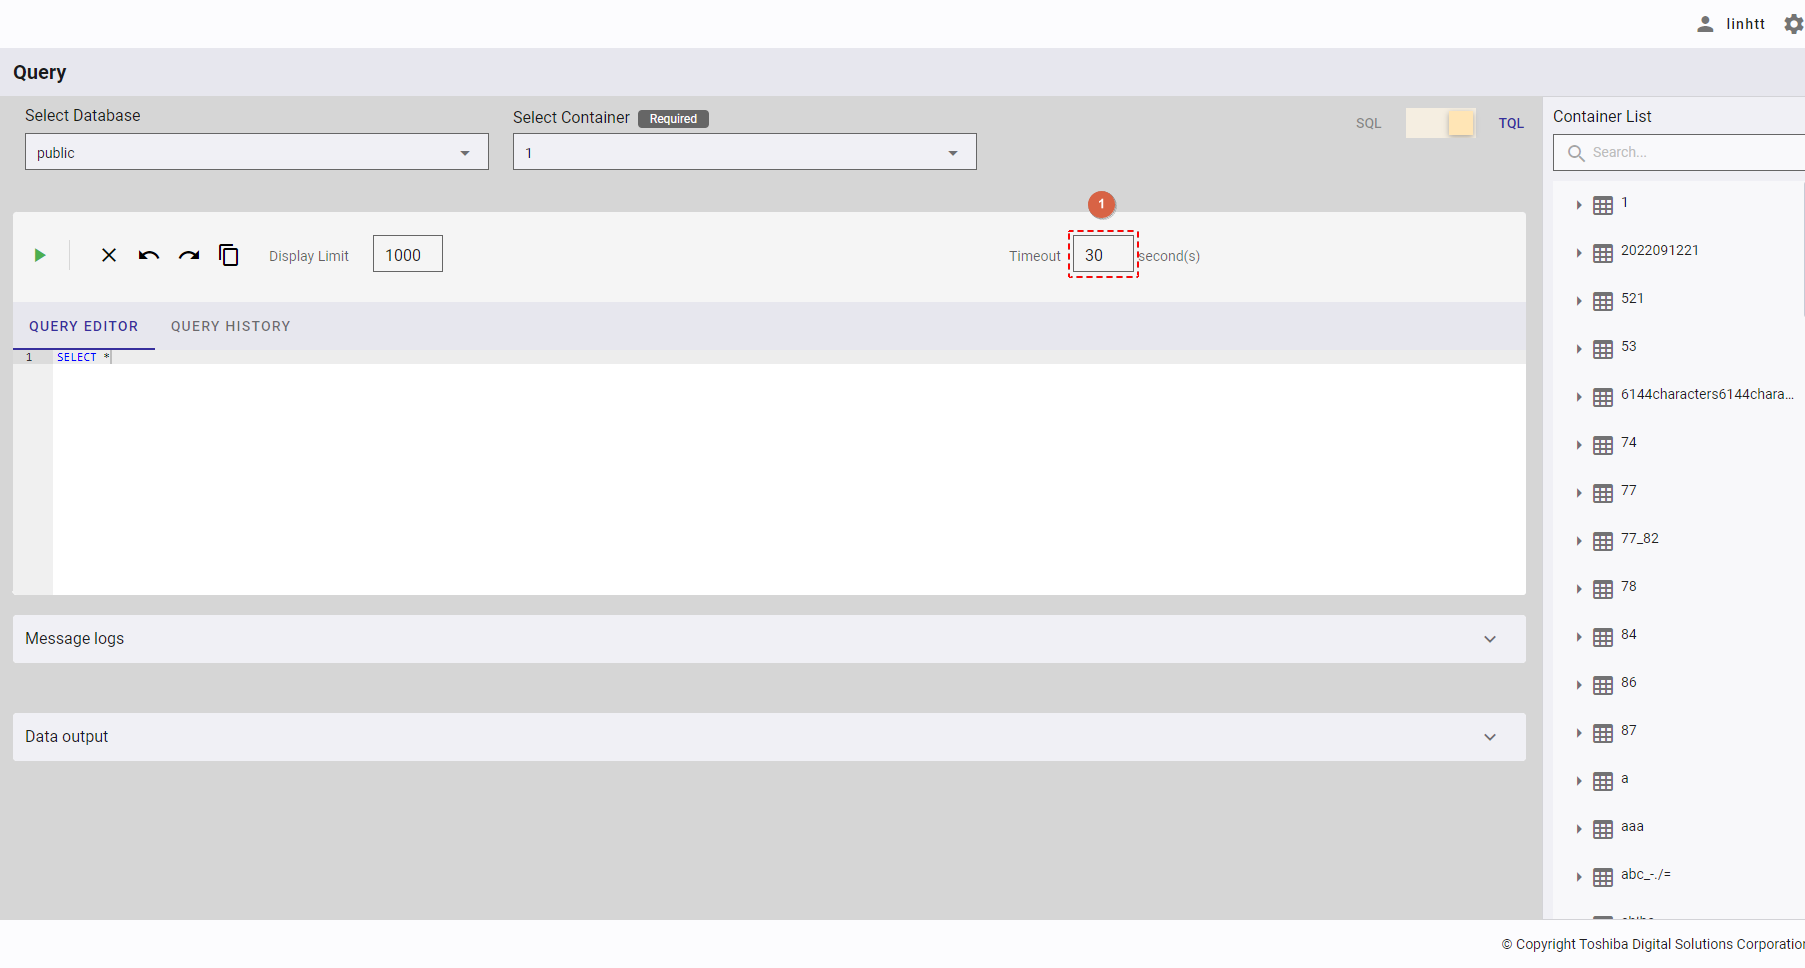
4.12.2.11 Setting the timeout
This function is only available in TQL mode.
You can enter an integer number between 1 and 600 in the [Timeout] box (①) to set the upper limit of timeout when executing a TQL query.
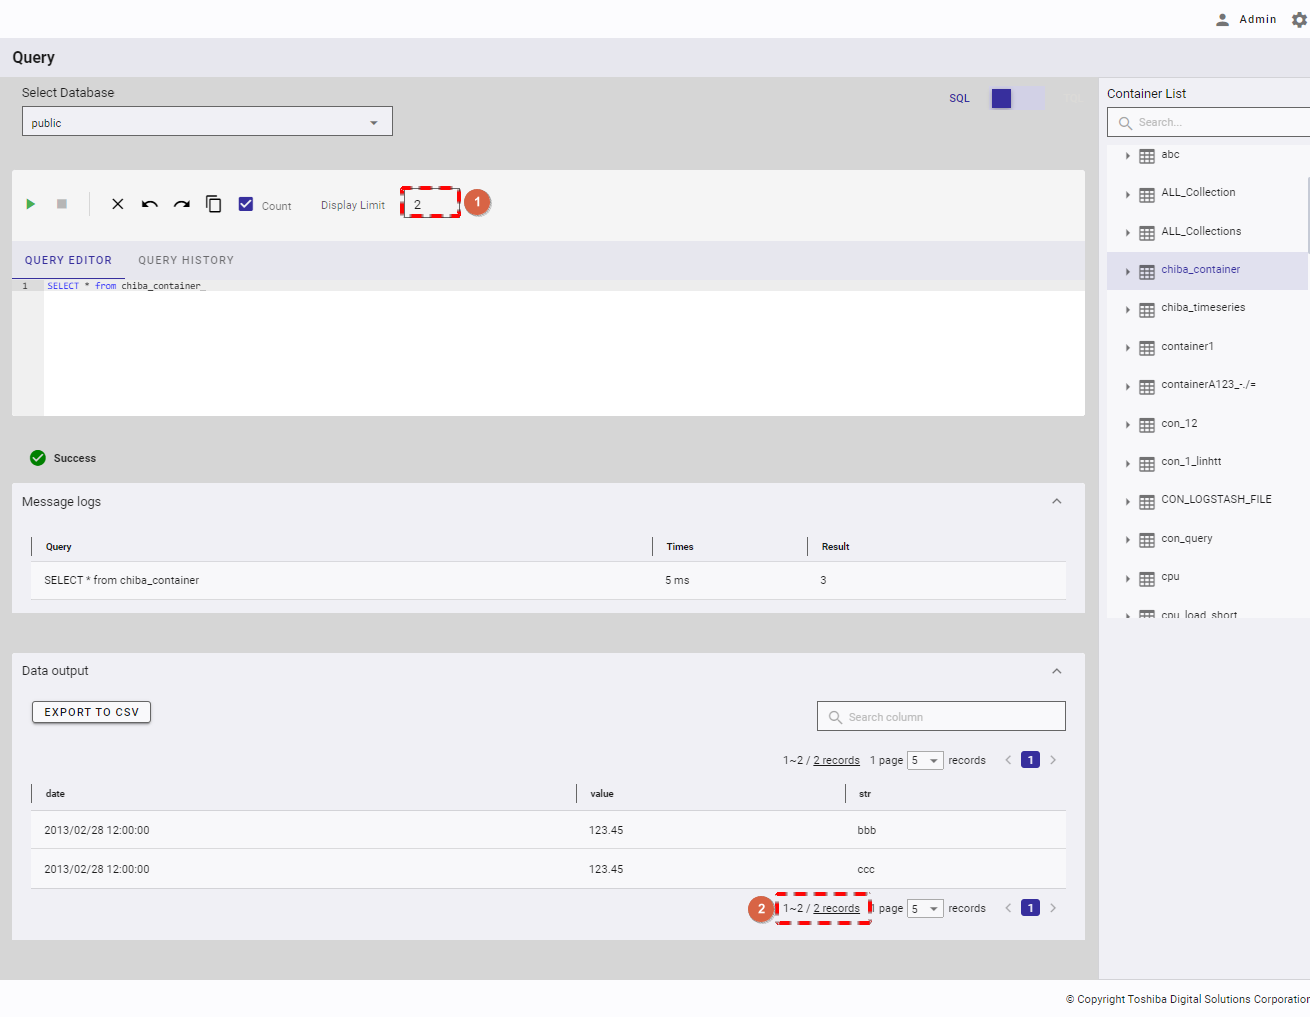
4.12.2.12 Setting the limit
This function is available in both SQL and TQL modes.
You can enter an integer number between 1 and 10,000 in the [Display Limit] box (①) to set the upper limit of display results (②) after executing a query.
4.12.3 Displaying query results
This function is available in both SQL and TQL modes.
4.12.3.1 Displaying message logs
You can click the [MESSAGE LOGS] tab (①) to show/hide message logs after executing a query successfully. Click the tab. The table below the tab then displays the [Query] (②), the [Times] (③) taken to execute that query, and the number of [Result] (④) if the [Count] (⑤) checkbox is checked. If not, the minus sign (-) is displayed. Also, the minus sign (-) is always displayed in TQL mode because Count is not supported in TQL.
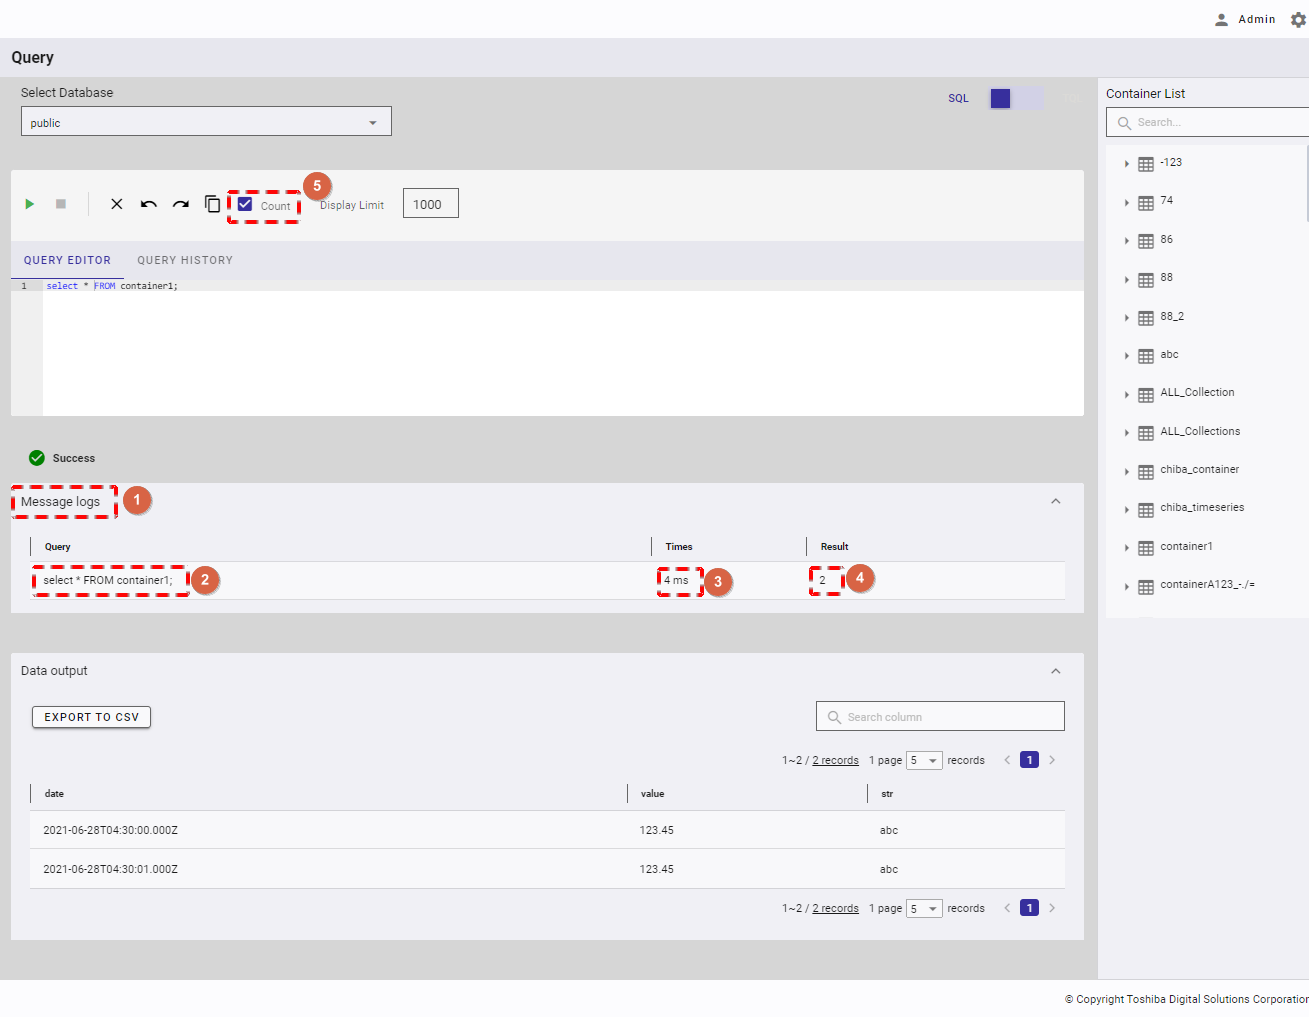

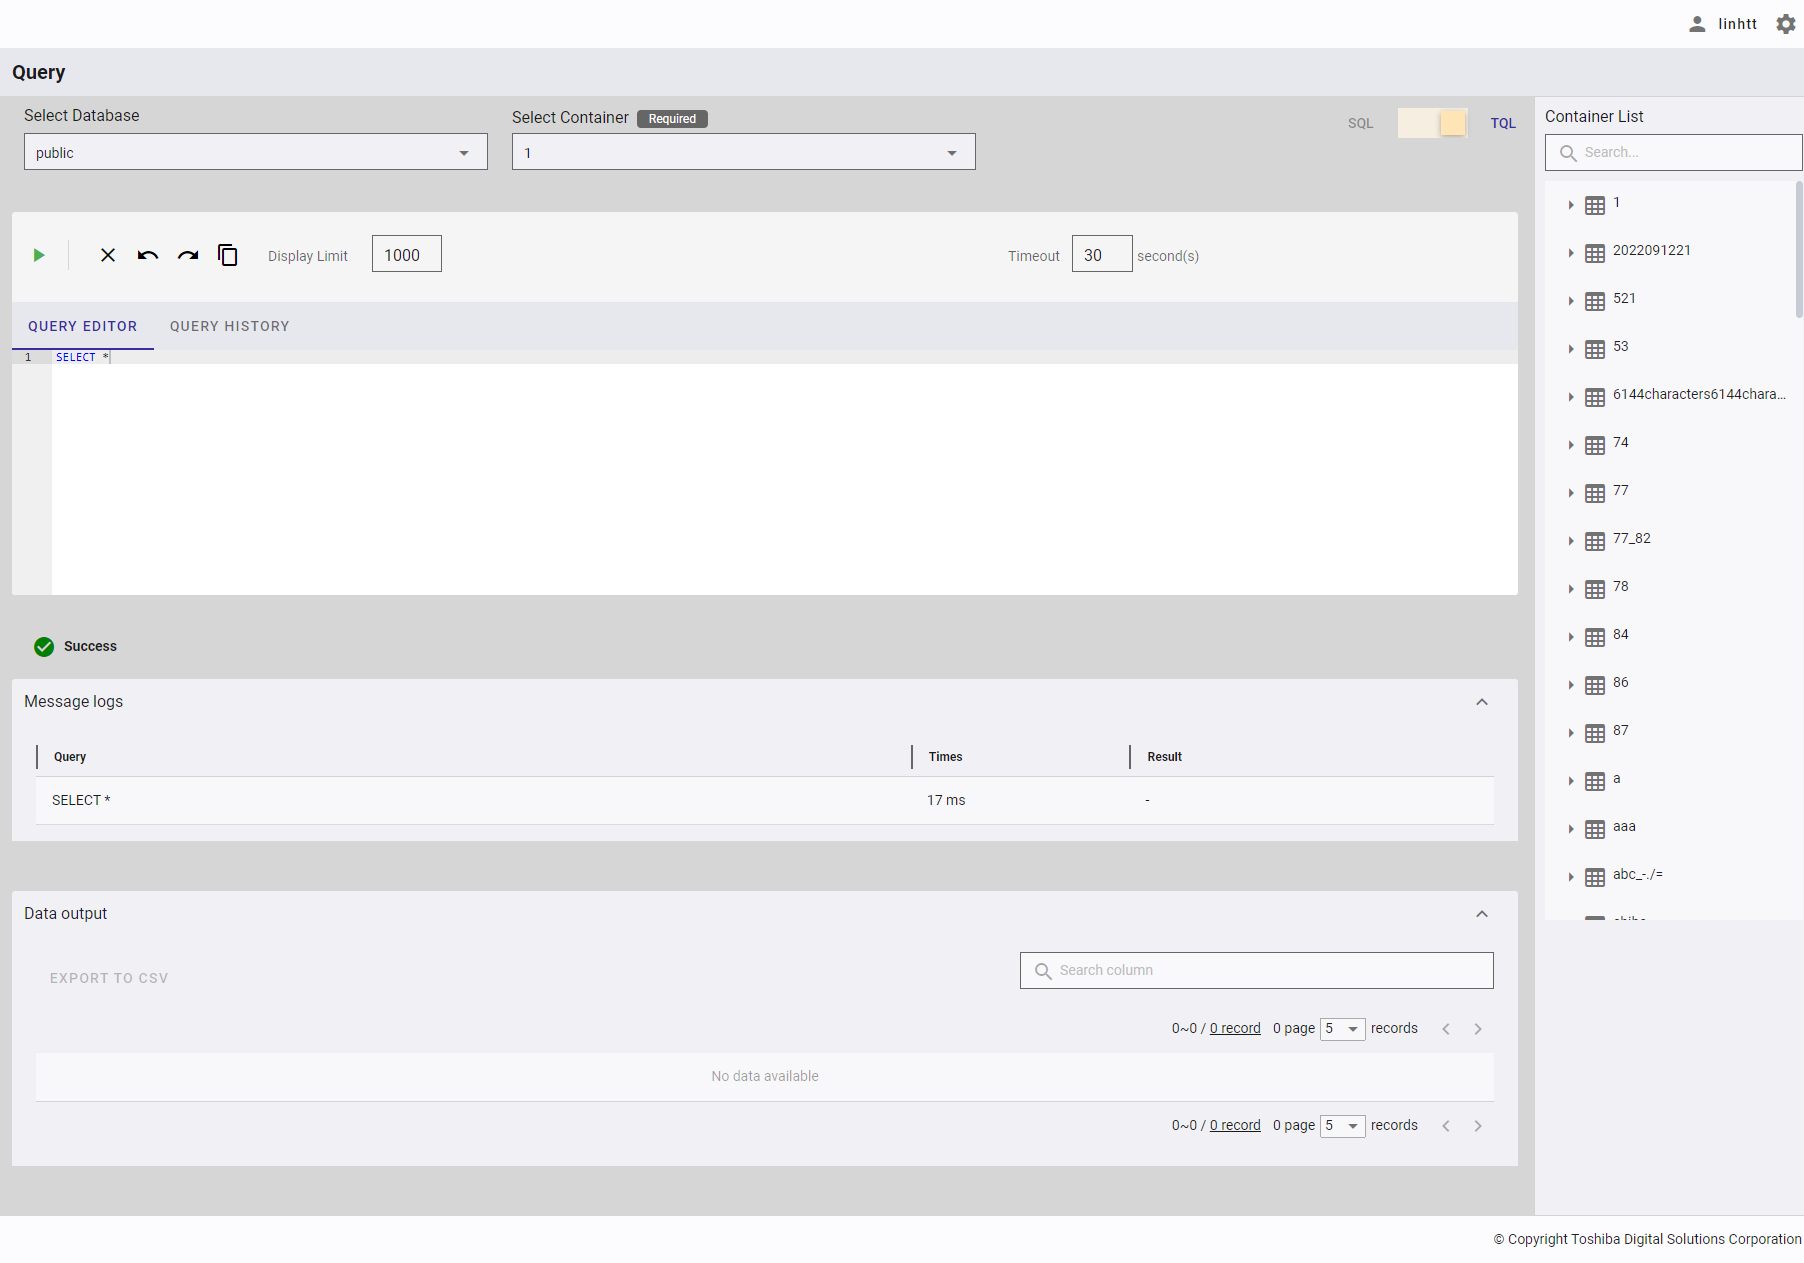
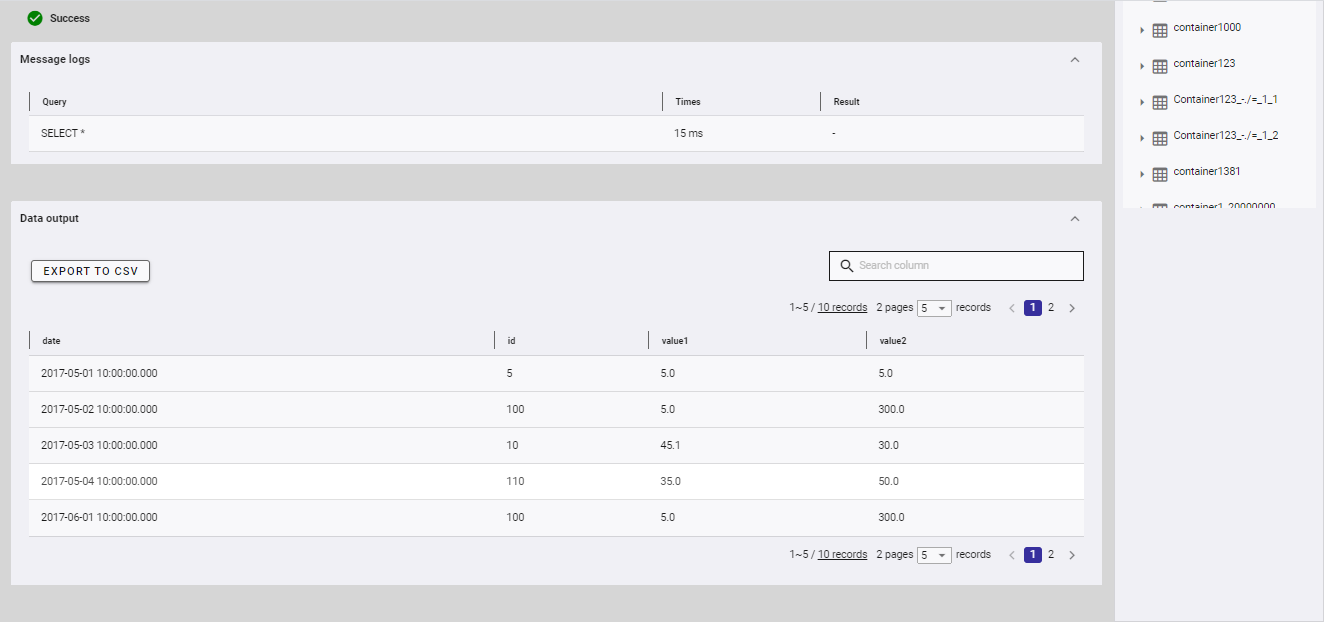
4.12.3.2 Displaying data output
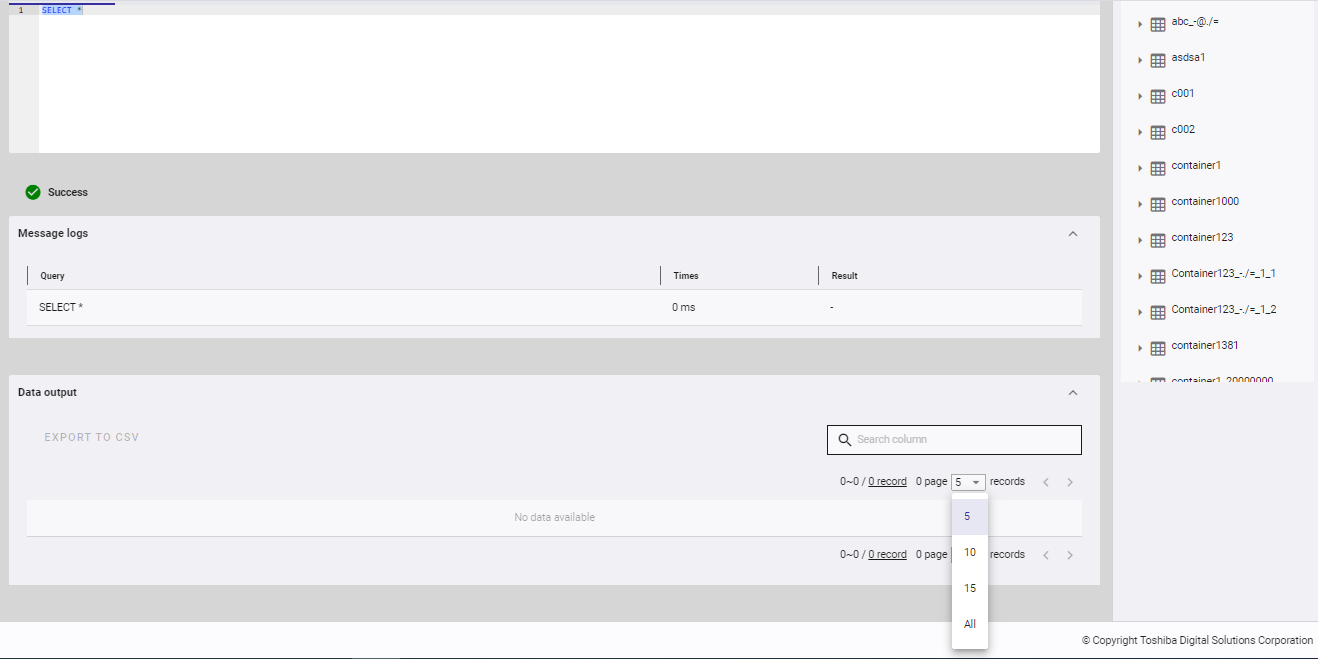
Step 1: You can click the [DATA OUTPUT] tab (①) to show/hide data output after executing a query successfully. Click the tab. The table below the tab then displays the column names (②) and the result.
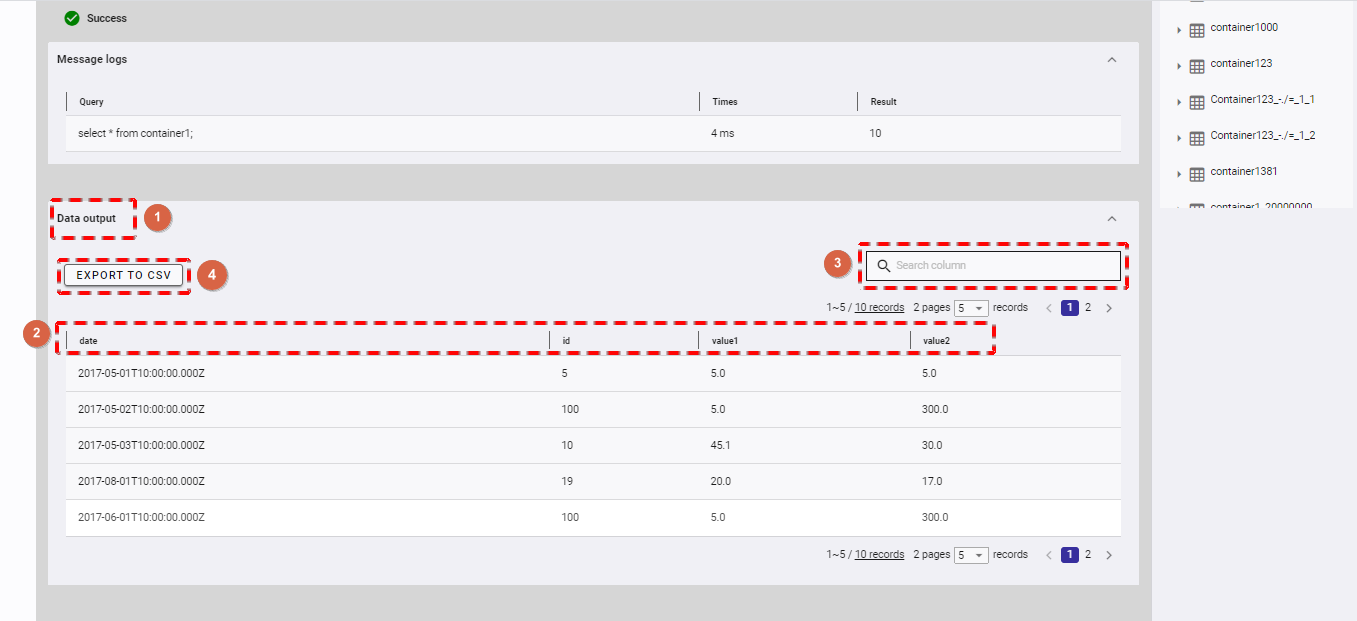
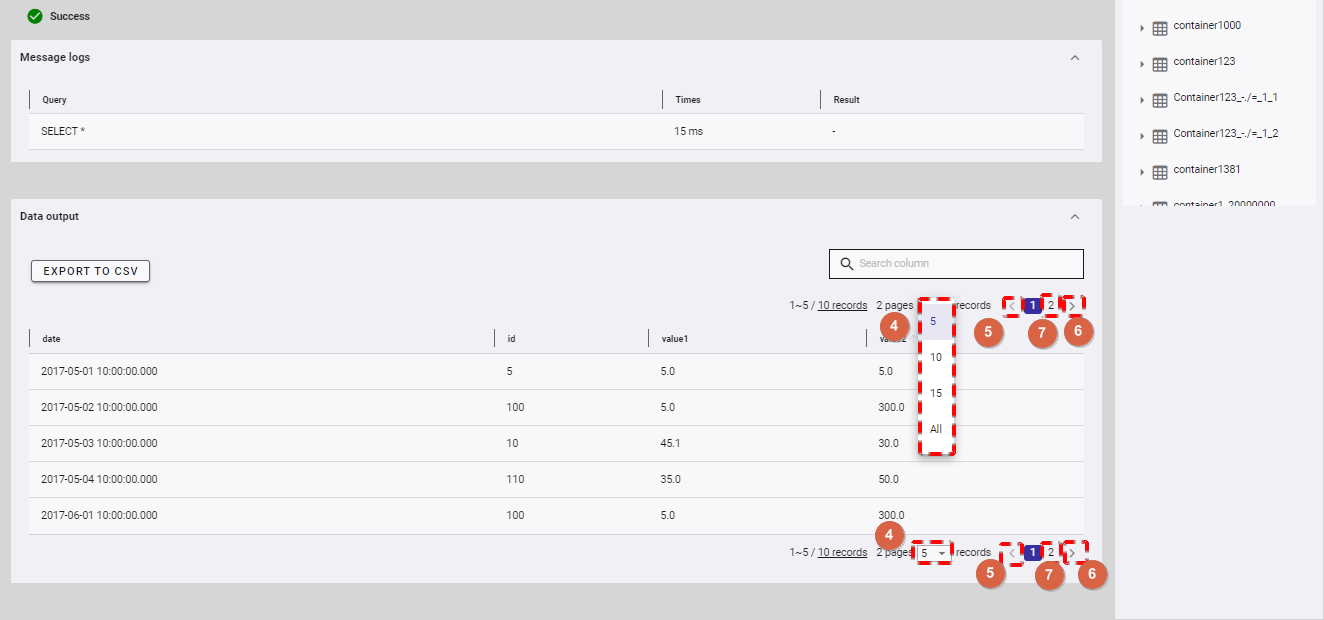
Step 2 (Optional):
You can enter a column name in the search box to search data in the result table (③).
You can choose the number of results displayed on one page by selecting the number from [5, 10, 15, All] (④) at the top or bottom of the page. Click the [Next] button (⑥) or the [Back] button (⑤), or click the page number (⑦) to view another page.
You can sort the result by column, by clicking any column name (②).
You can adjust the column size by dragging and dropping the vertical bar "|" on the header.
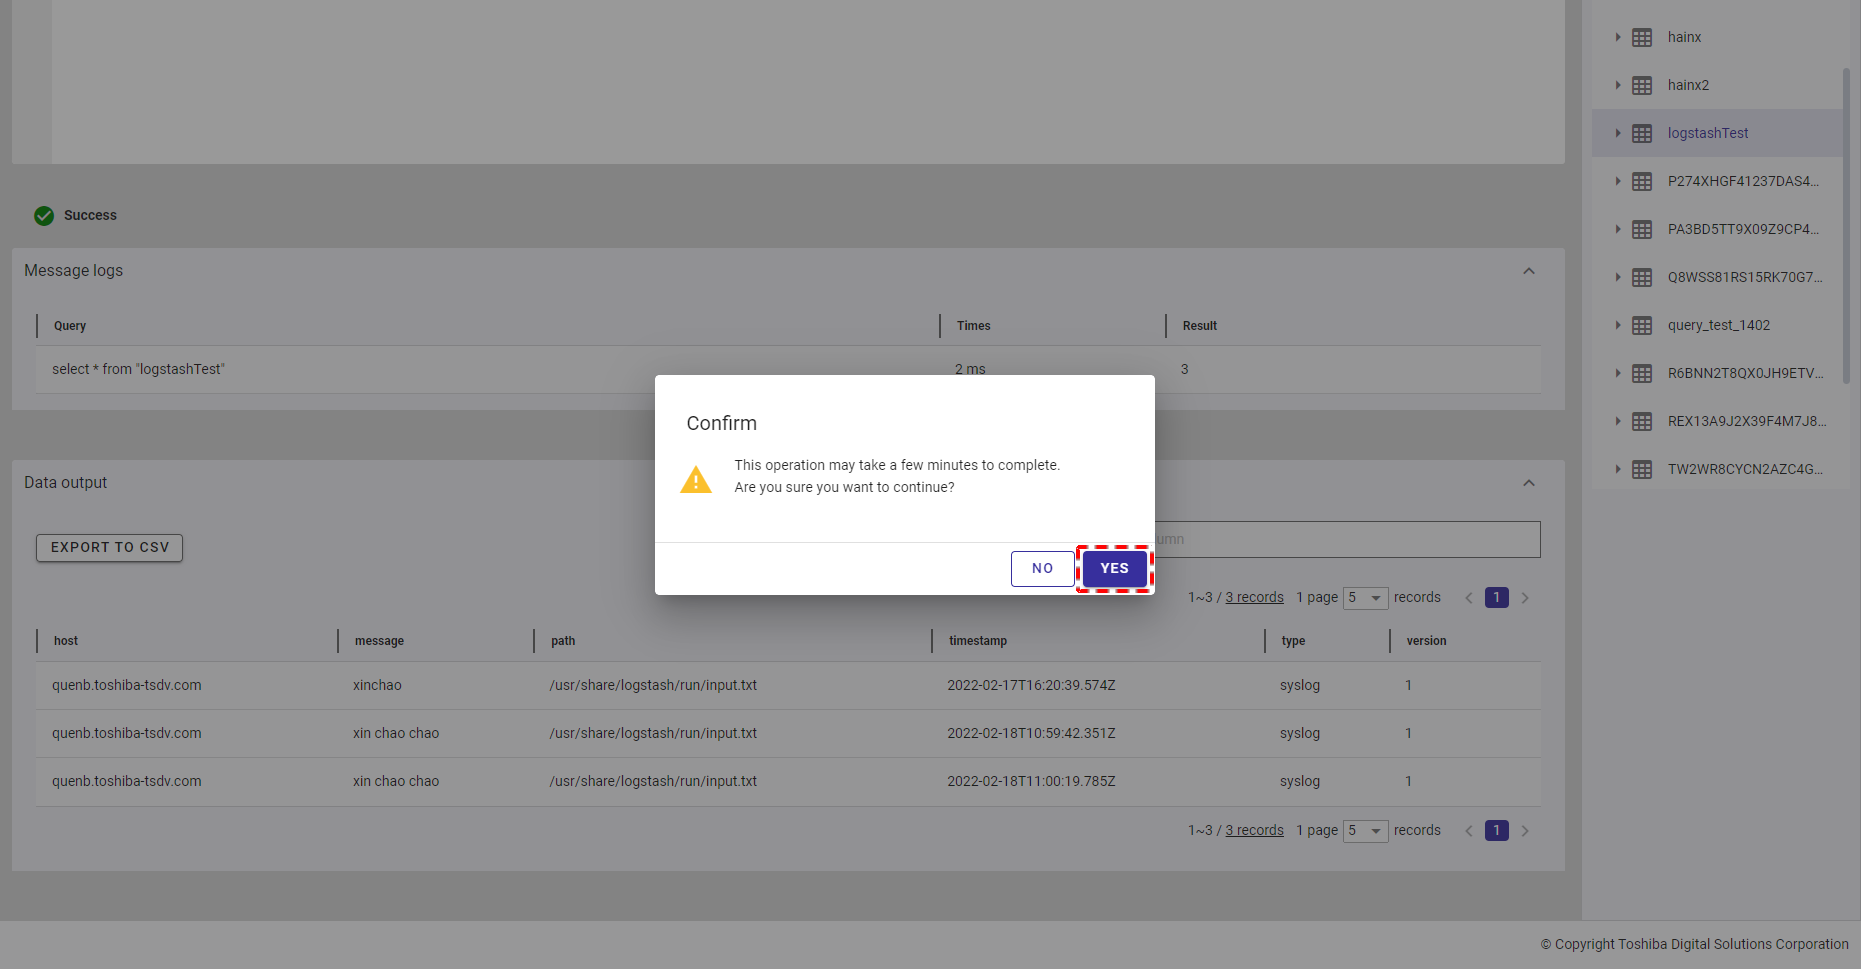
Step 3 (Optional): To export data to a CSV file, click the [EXPORT TO CSV] button (④).
[Note]: The [EXPORT TO CSV] button is deactivated when the table above has no data.
Once the [EXPORT TO CSV] button is clicked, a confirmation dialog will be displayed. Click the [YES] button to export data to a CSV file. If you do not want to export data to a CSV file, you can click the [NO] button to close the confirmation dialog and return to the Query screen without exporting data to a CSV file.
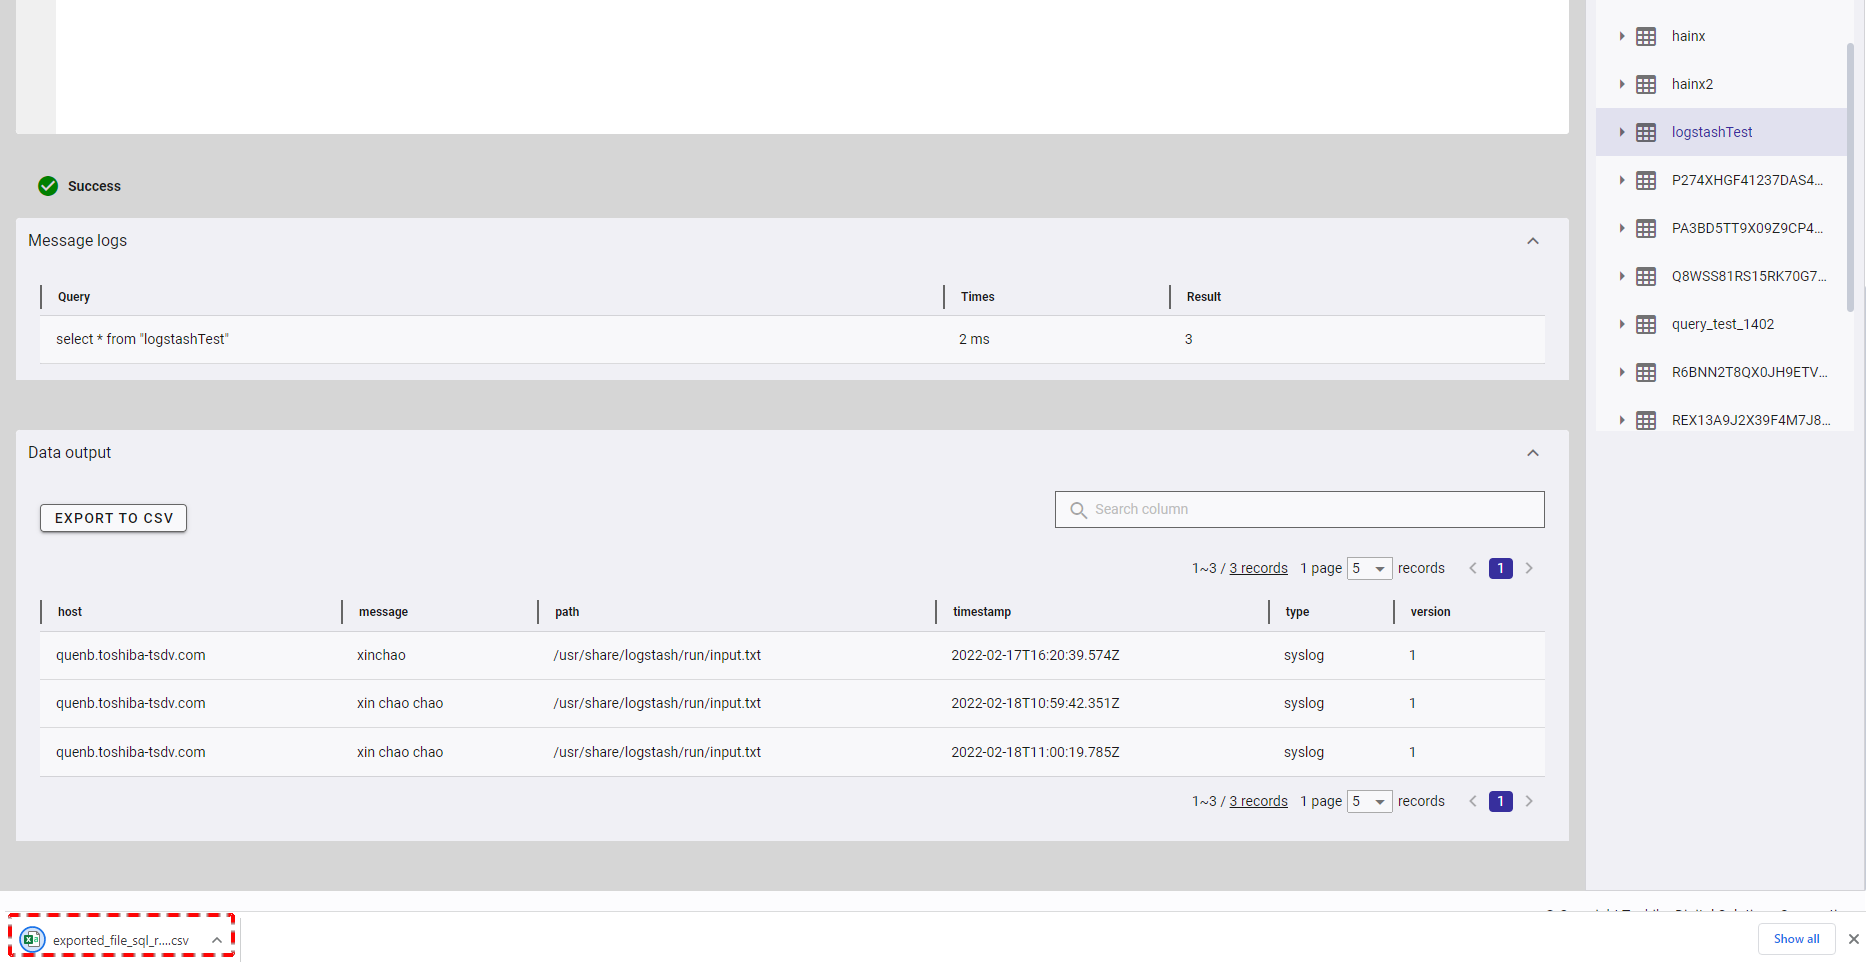
The exported data will be downloaded directly by your browser as a CSV file.
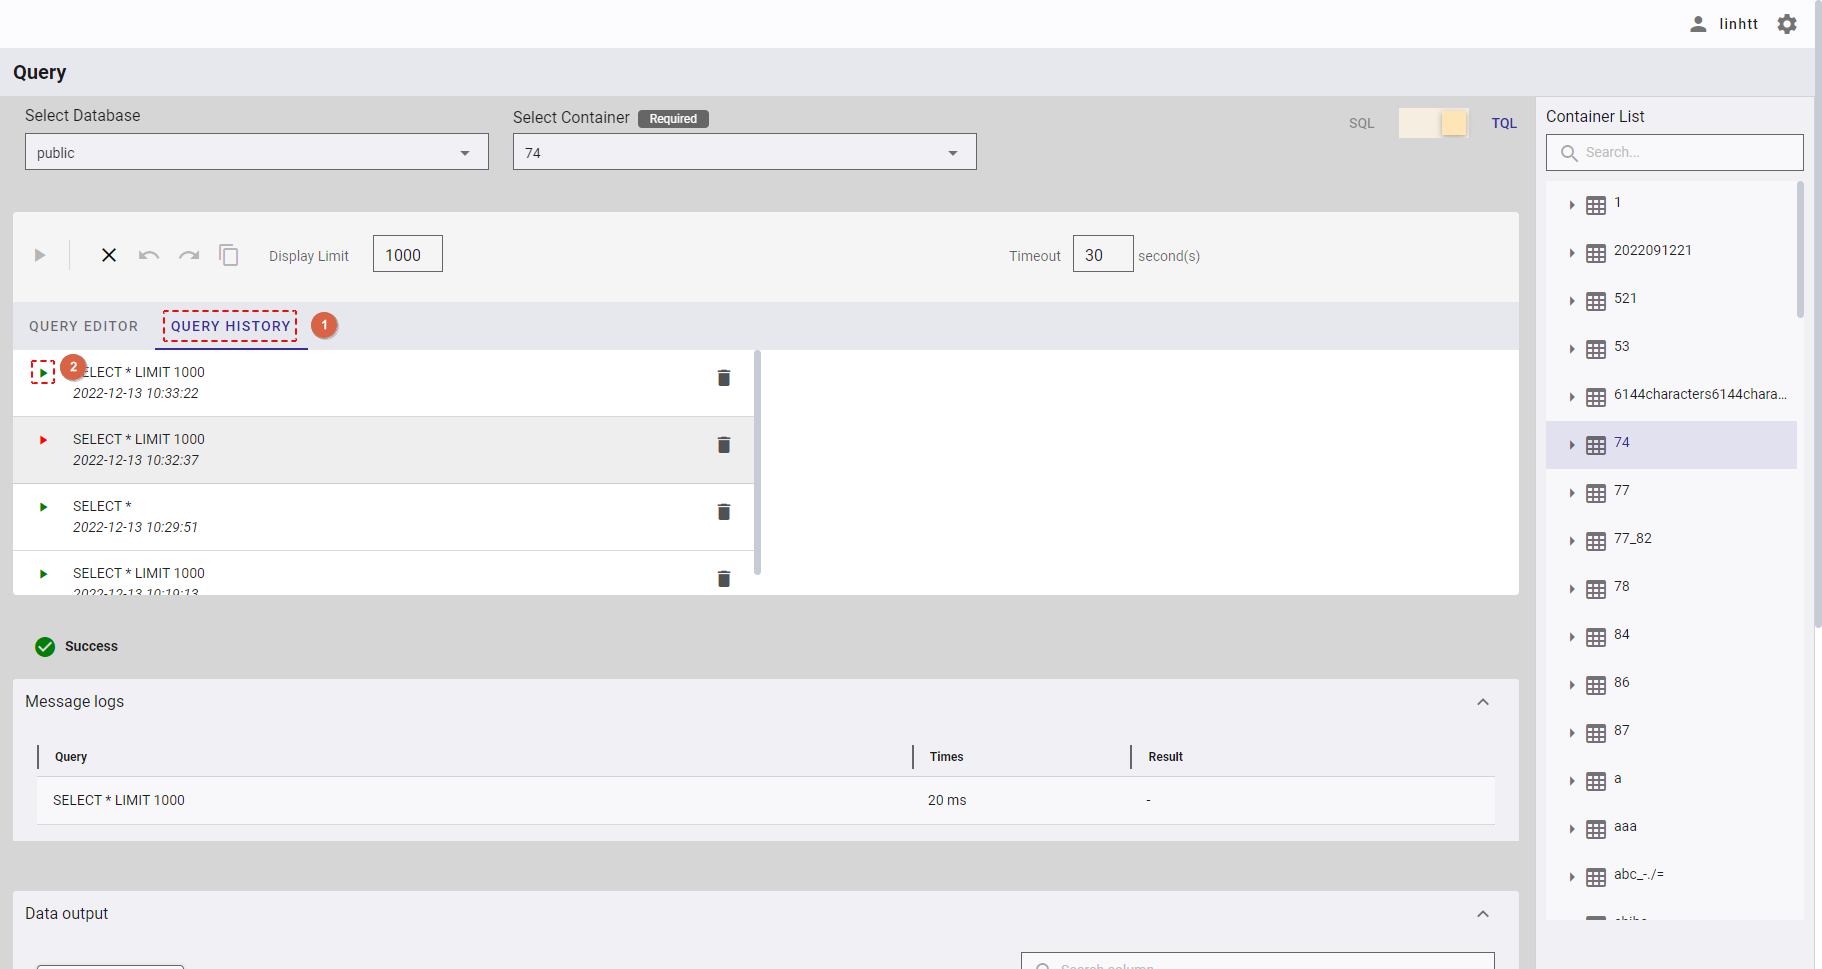
4.12.4 Displaying a query history
This function is available in both SQL and TQL modes. However, the query history is saved separately for each mode and as a result displayed for each mode.
4.12.4.1 Re-executing a query
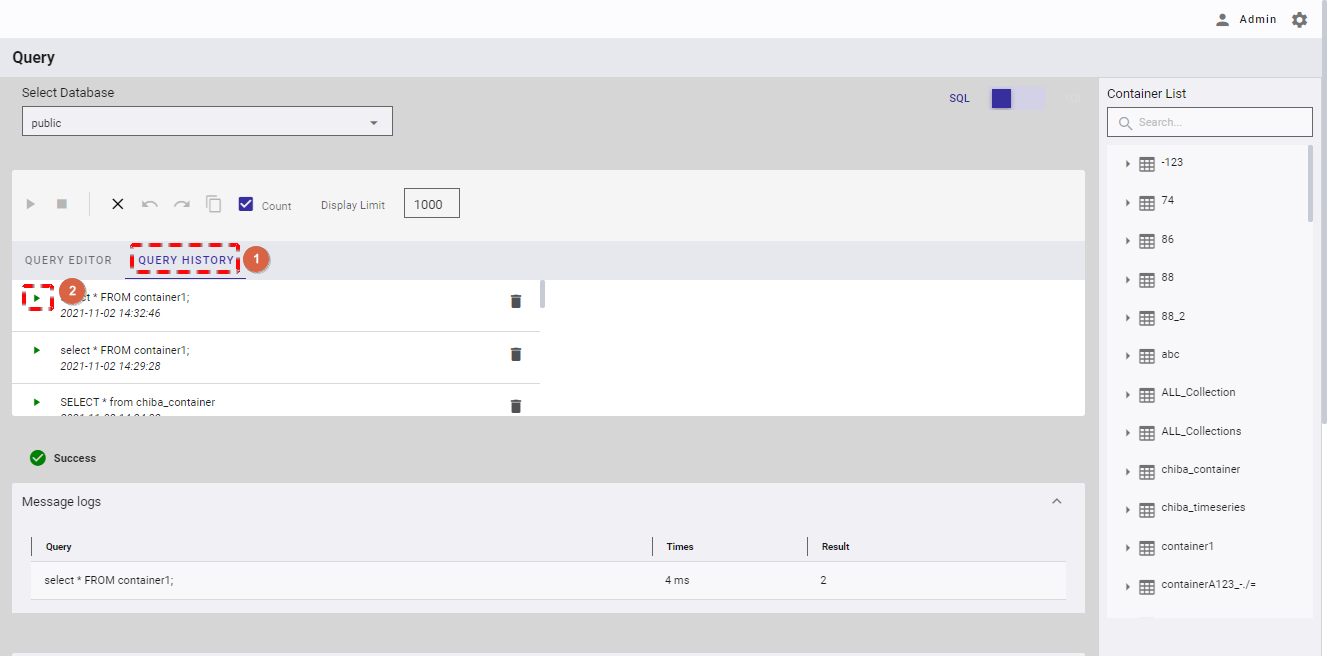
- You can click the [QUERY HISTORY] tab (①) to check the list of executed queries.
- You can click the [Re-execute] button (②) on the left of a query history to re-execute that query.
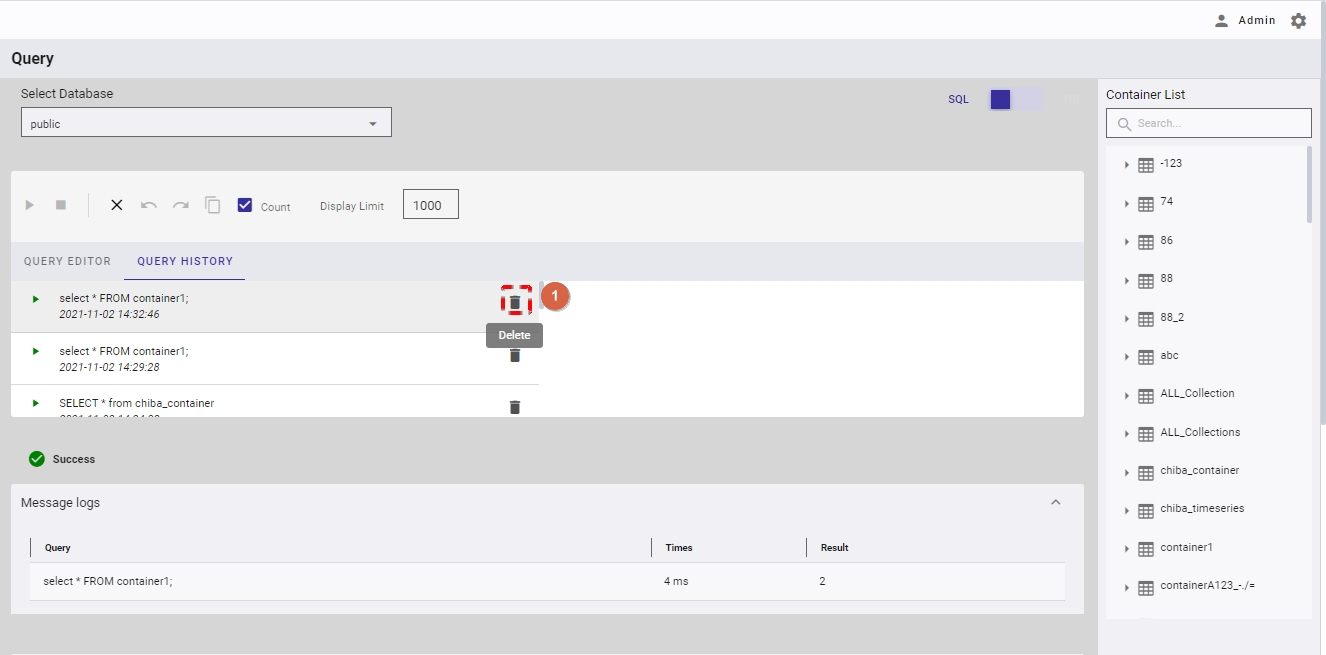
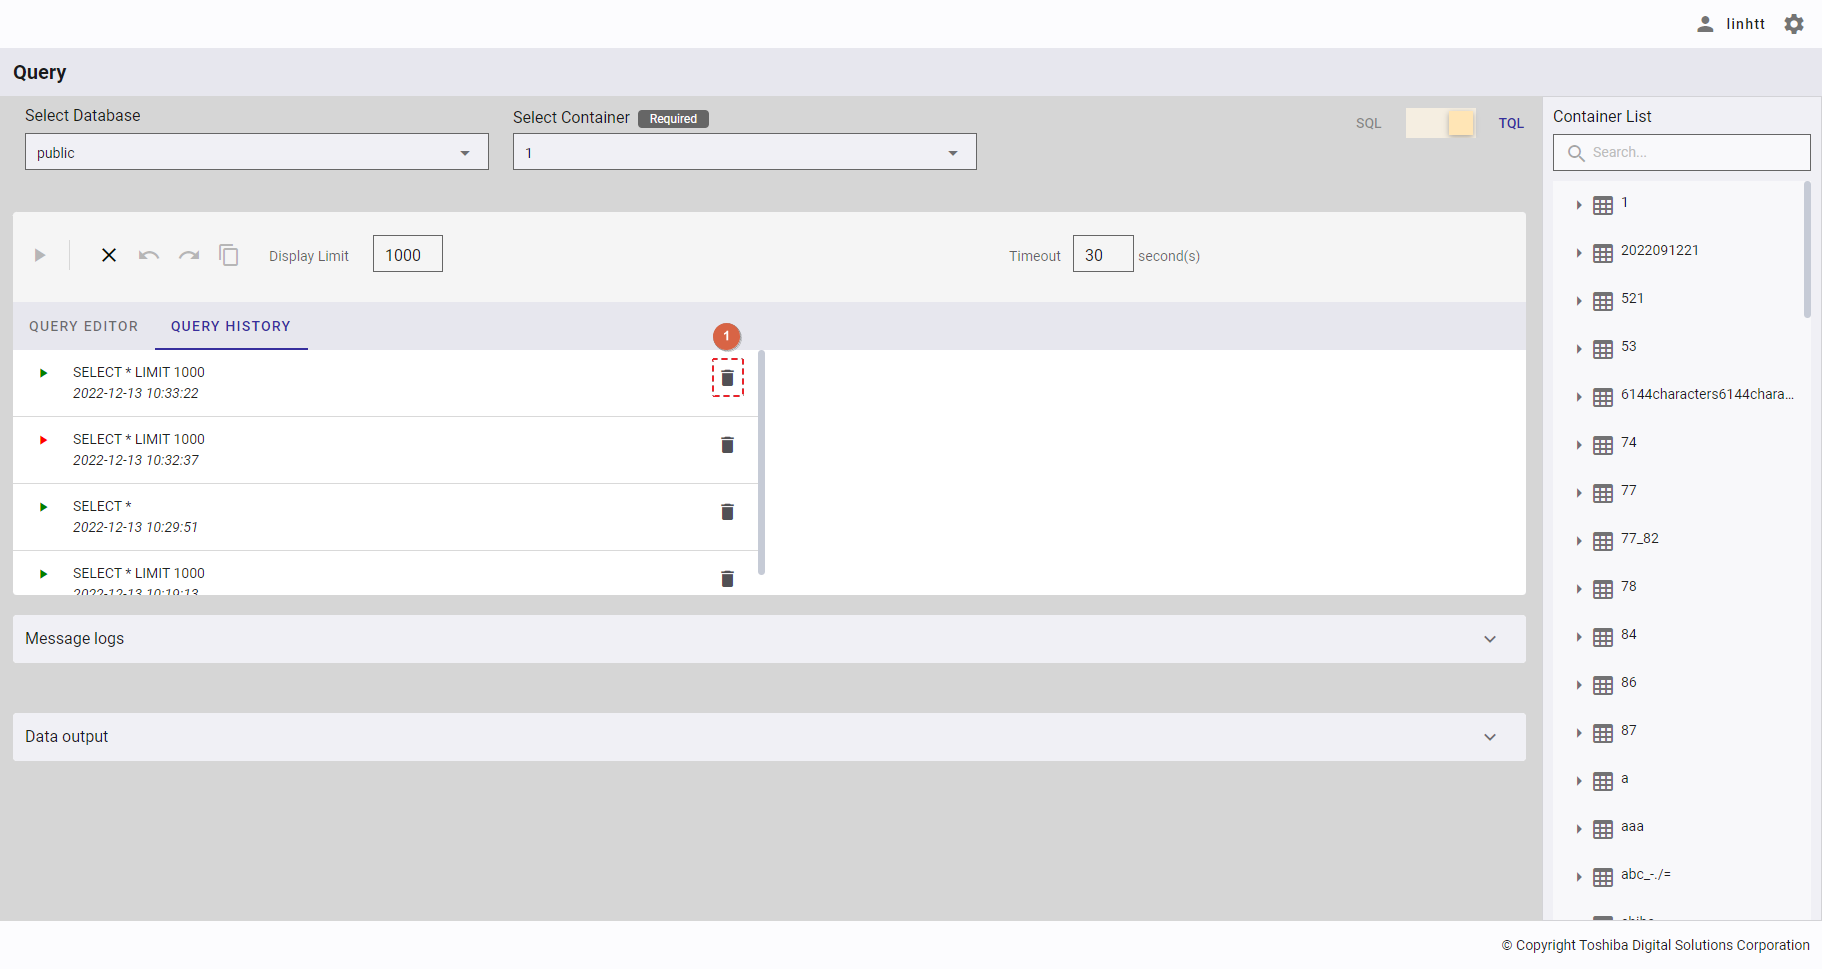
4.12.4.2 Deleting a query history
Step 1: Click the [Delete] button (①) on the right of a query history to delete that query history.
4.12.5 Inserting a script using a query template
This function is available in both SQL and TQL modes.
Step 1: Right-click the container name to see a list of query templates.
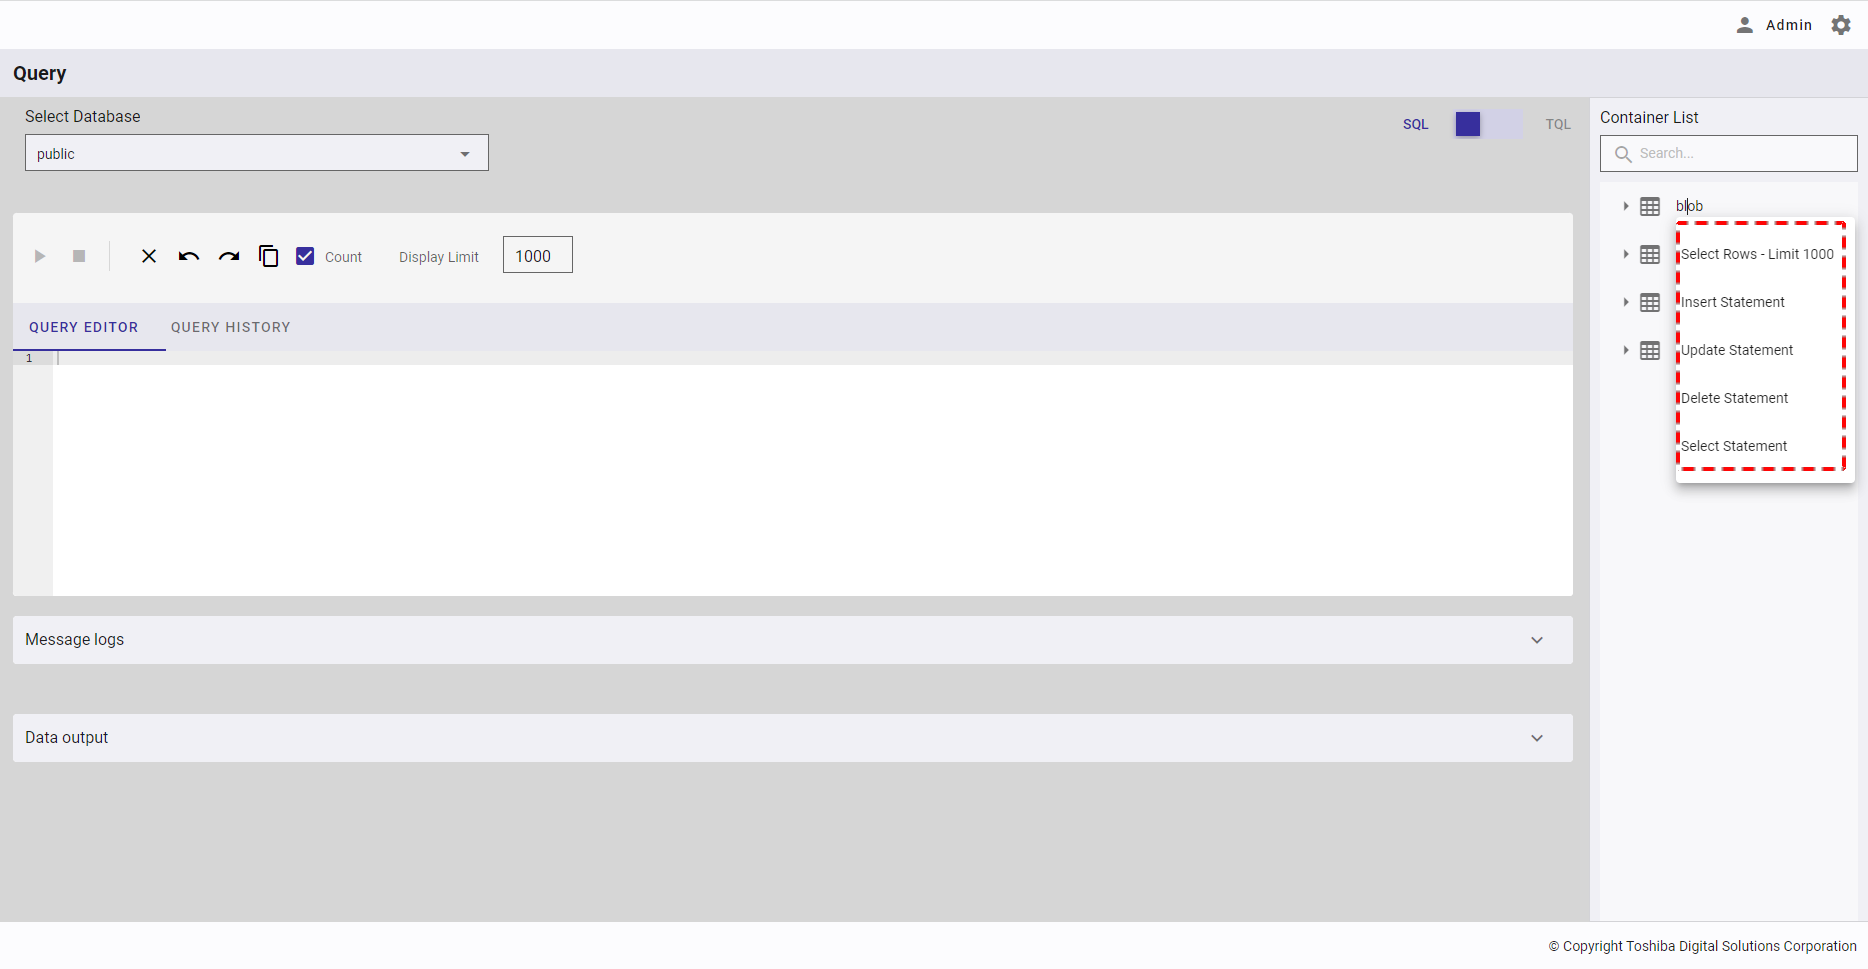
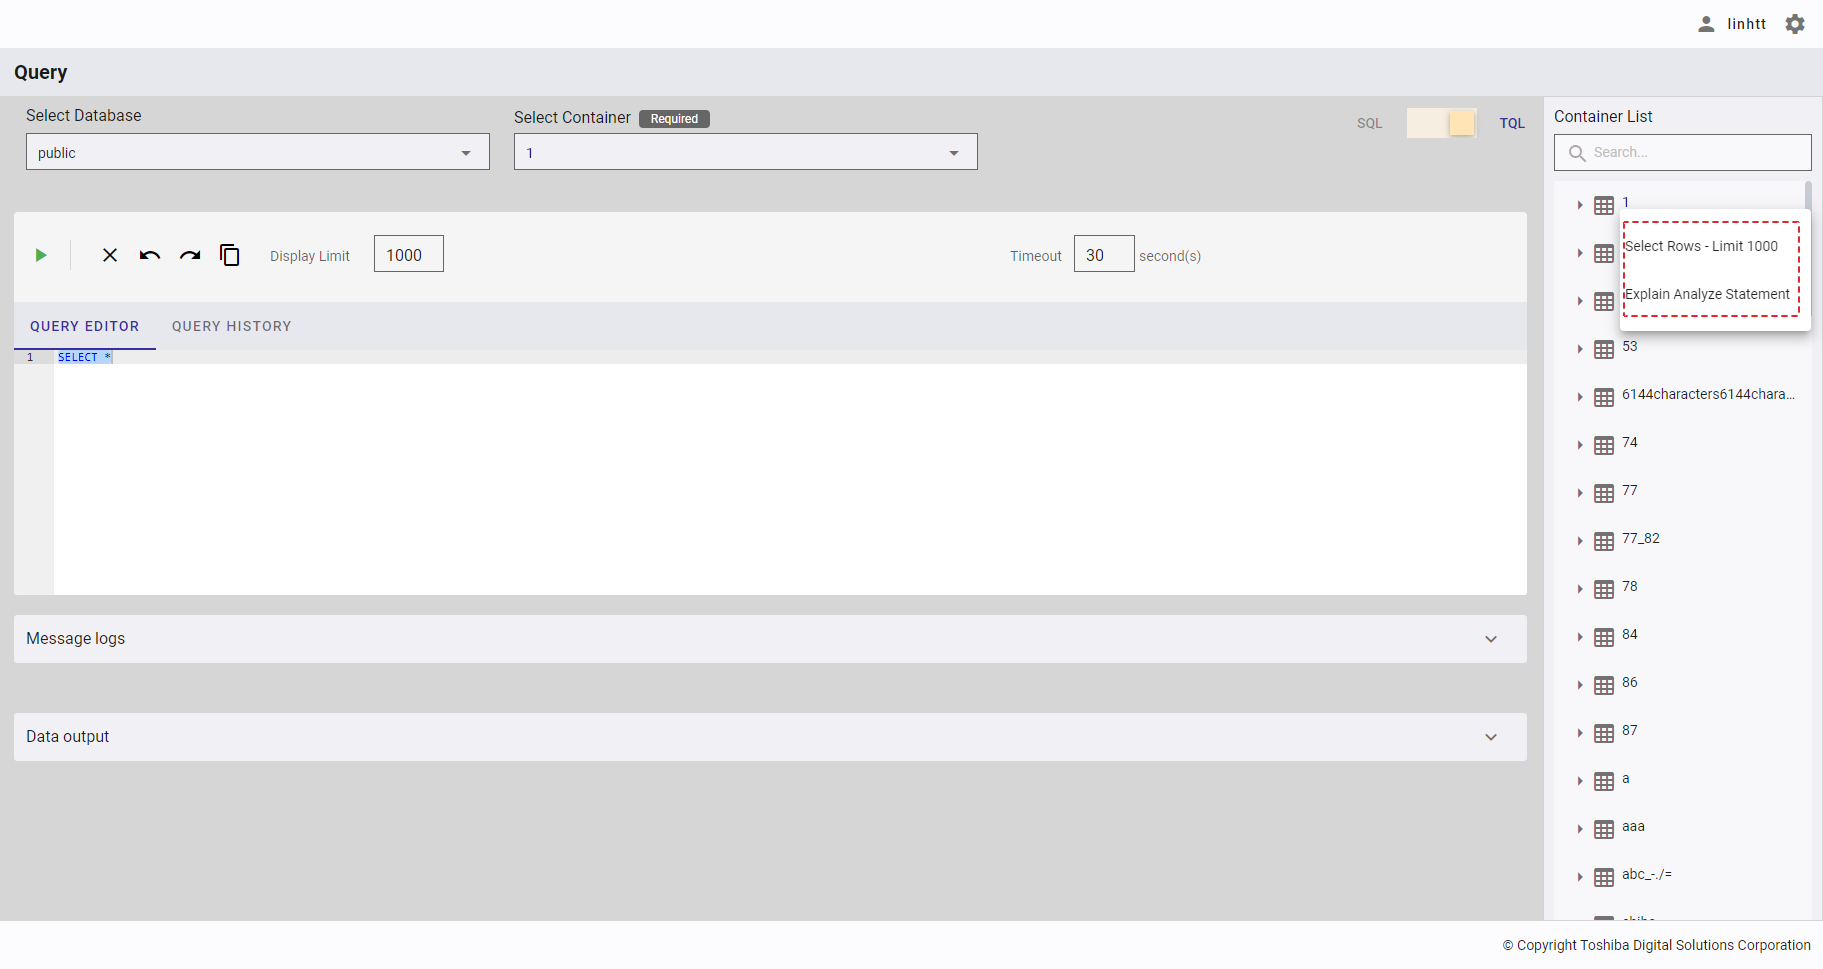
Step 2: Choose one of the query templates to insert a script into a query in the QUERY EDITOR. The script to be inserted into a query varies depending on the chosen template and on the mode used as shown by the table below. Five query templates are available for SQL while two are available for TQL.
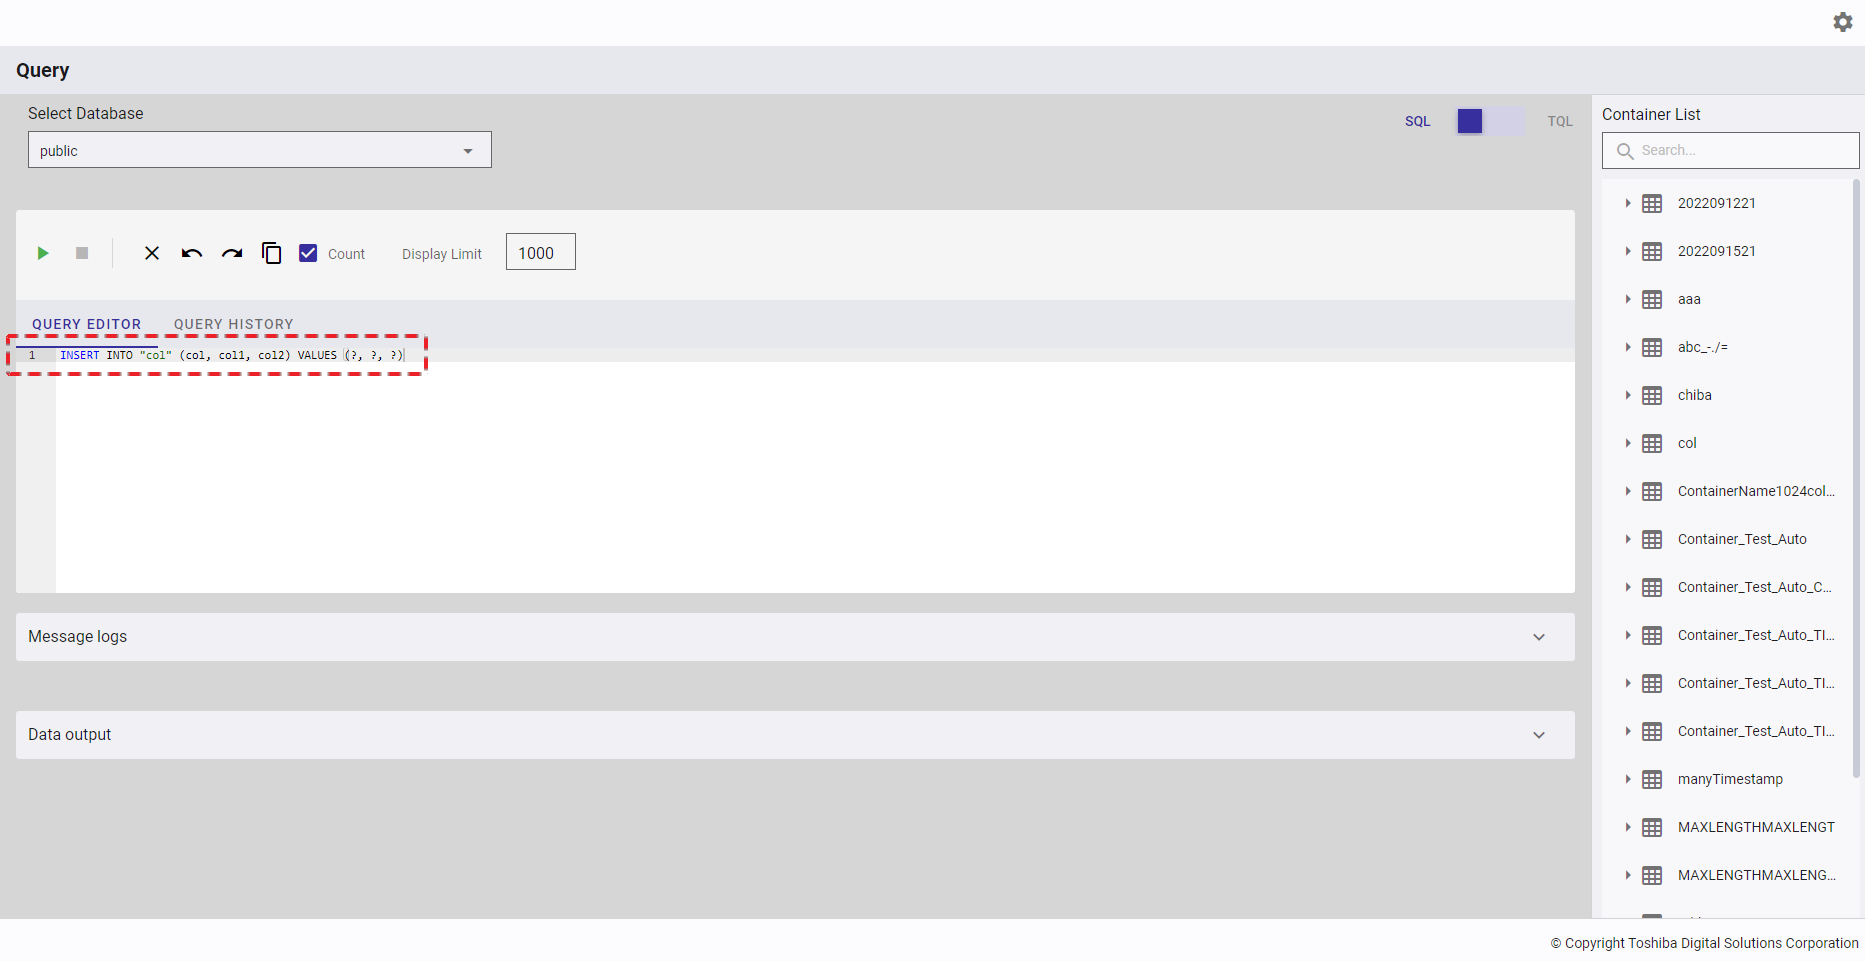
| Template | SQL Script | TQL Script |
|---|---|---|
| Select Rows - Limit 1000 | SELECT * FROM "{container-name}" LIMIT 1000 |
SELECT * LIMIT 1000 |
| Insert Statement | - For a one-column container:INSERT INTO "{container-name}" ("{column-name}") VALUES (?)- For multiple-column container: INSERT INTO "{container-name}" ("{column-name-1}", "{column-name-2}") VALUES (?, ?) |
NA |
| Update Statement | - For a container with one or more columns:UPDATE "{container-name}" SET "{column-name-1}" = ? WHERE [conditional expression] |
NA |
| Delete Statement | DELETE FROM "{container-name}" WHERE [conditional expression] |
NA |
| Select Statement | - For a one-column container:SELECT "{column-name}" FROM "{container-name}" WHERE [conditional expression]- For a multiple-column container: SELECT "{column-name-1}", "{column-name-2}" FROM "{container-name}" WHERE [conditional expression] |
NA |
| Explain Analyze Statement | NA | EXPLAIN ANALYZE SELECT [select expression] WHERE [conditional expression] |
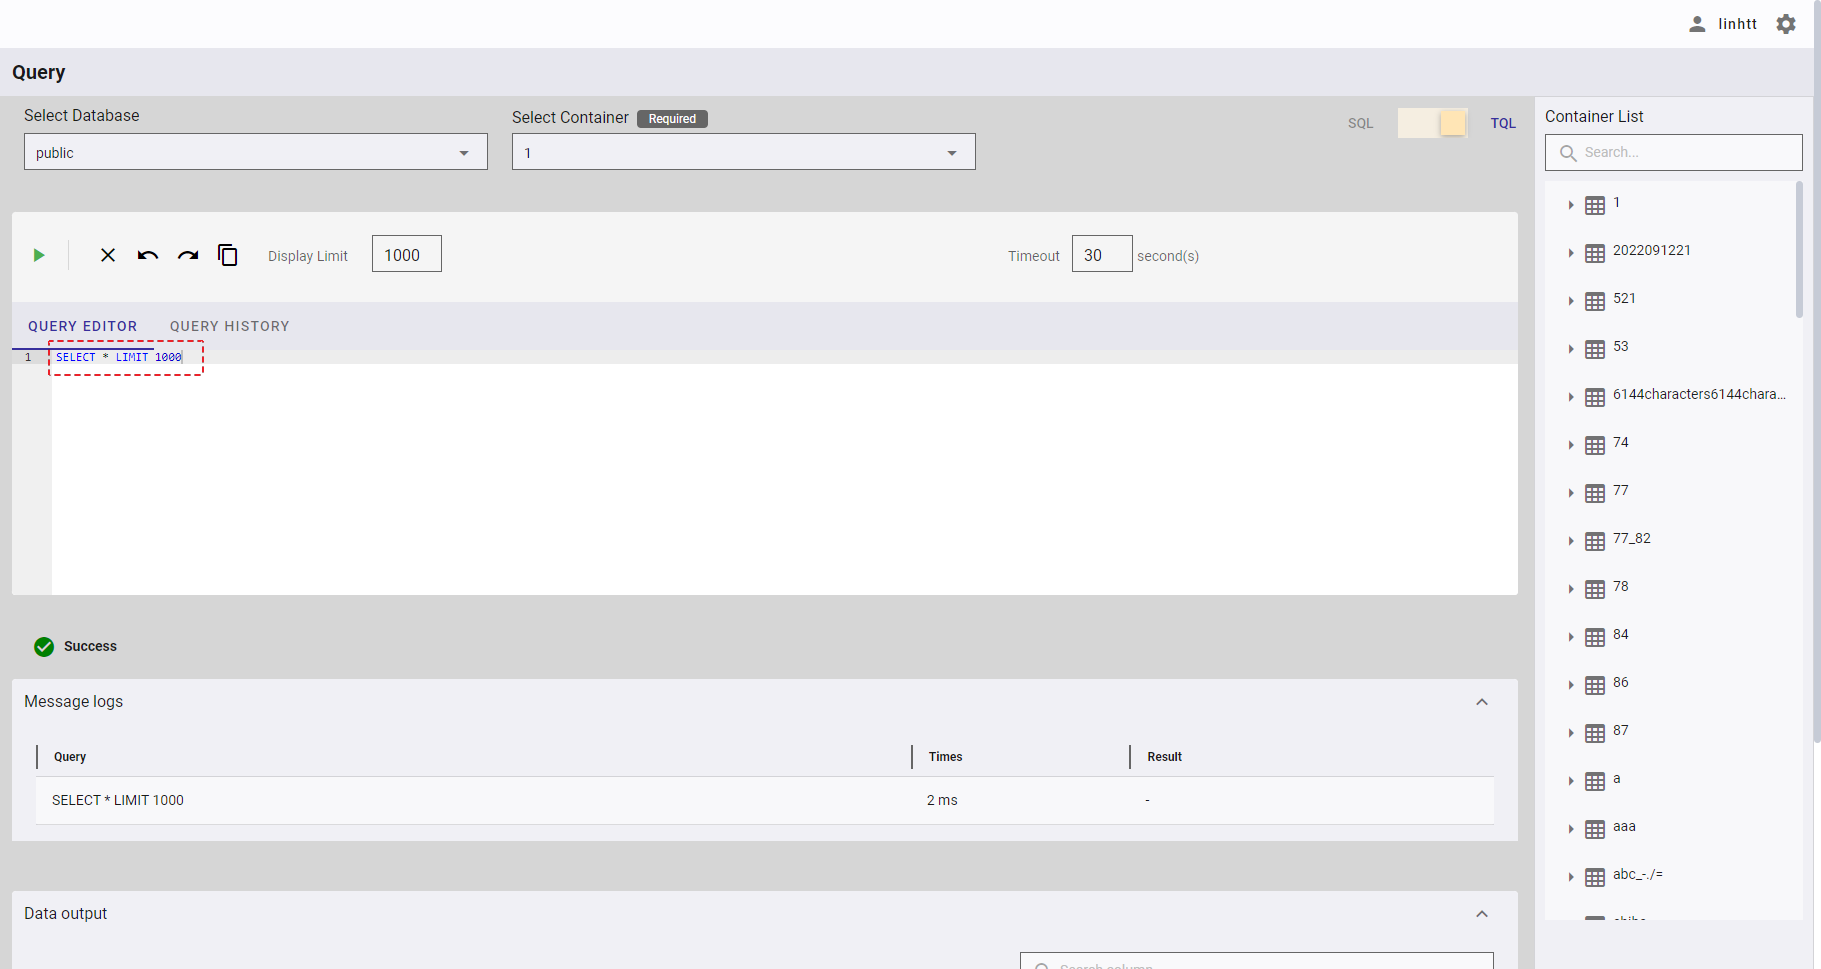
[Note]: If you choose the template Select Rows - Limit 1000, the query is executed automatically.
4.13 GridDB user management function
This function is used for various operations related to a database user, including creating and deleting a user, adding and deleting the permission for a database user, and displaying the user list and user permission list.
[Note]: For more details, refer to the section on database and users in the GridDB Features Reference.
4.13.1 Available roles
In the table below, the role with a plus sign (+) can use the function on the left whereas the role with a minus sign (-) cannot use it.
| No. | Function | General user | Administrator user |
|---|---|---|---|
| 1 | Display a database user list | - | + |
| 2 | Create a database user | - | + |
| 3 | Change a database user password | - | + |
| 4 | Delete a database user | - | + |
| 5 | Display database user information | - | + |
| 6 | Display database permissions | - | + |
| 7 | Add a database permission | - | + |
| 8 | Delete a database permission | - | + |
4.13.2 Displaying a database user list
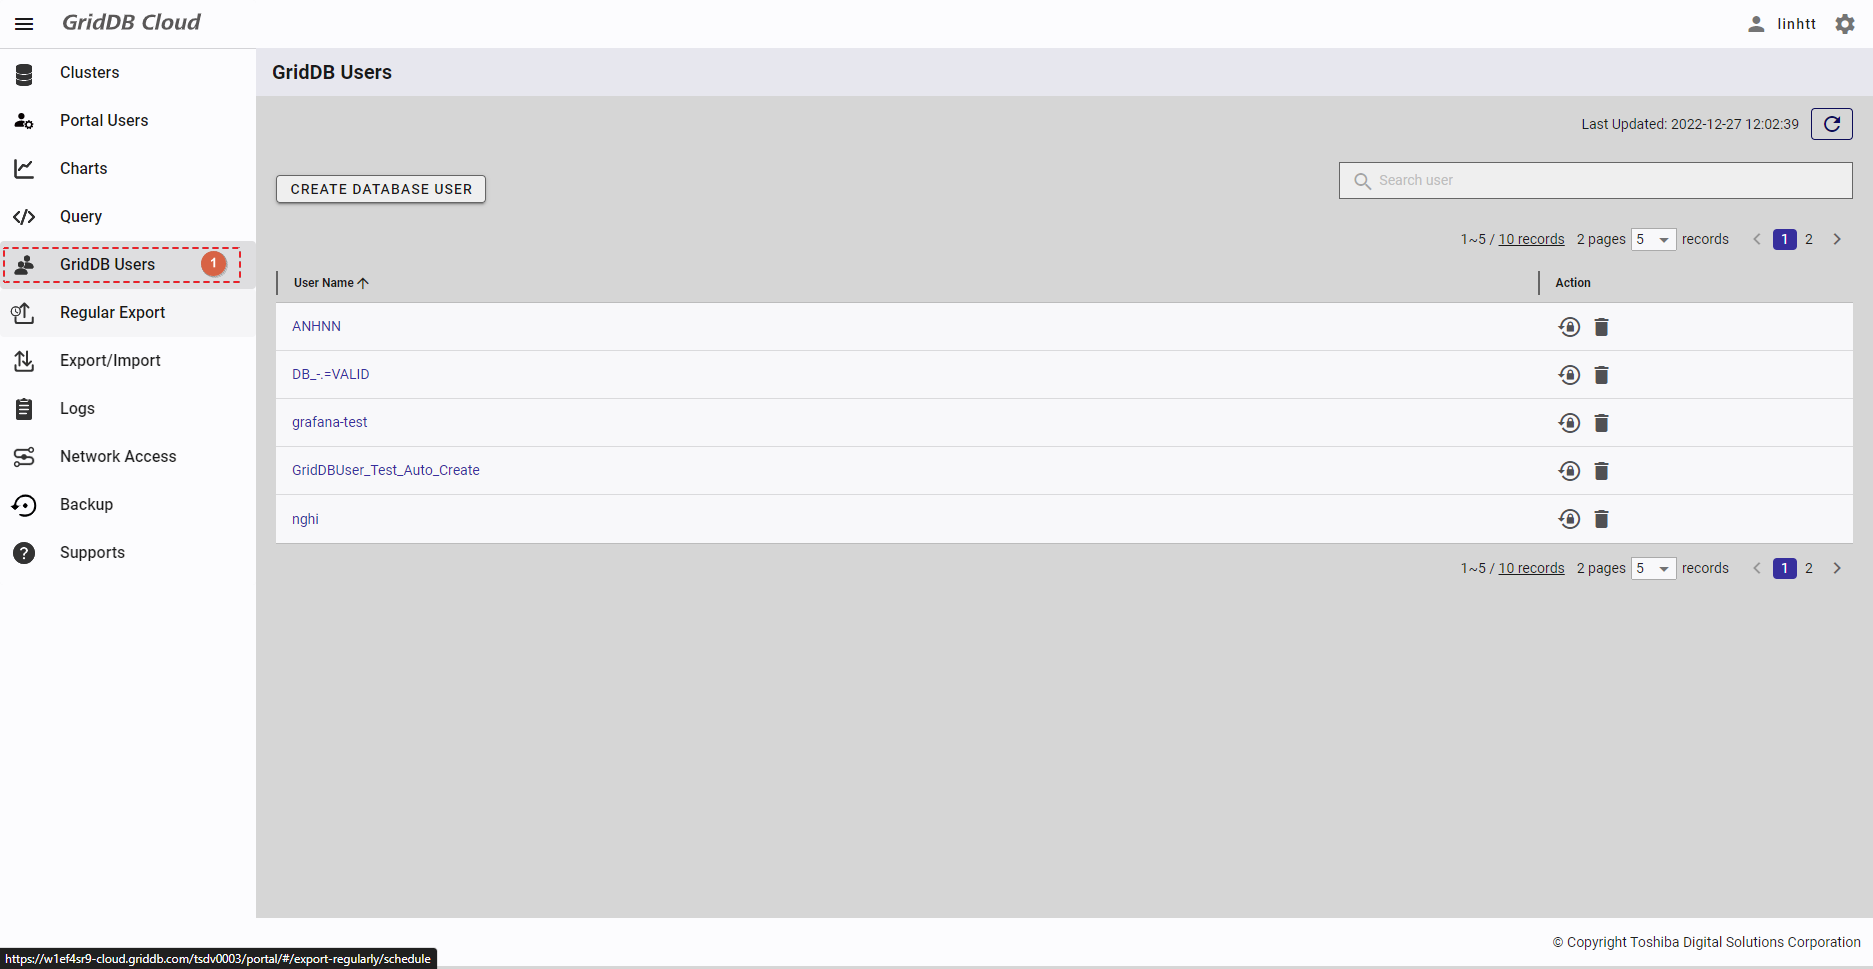
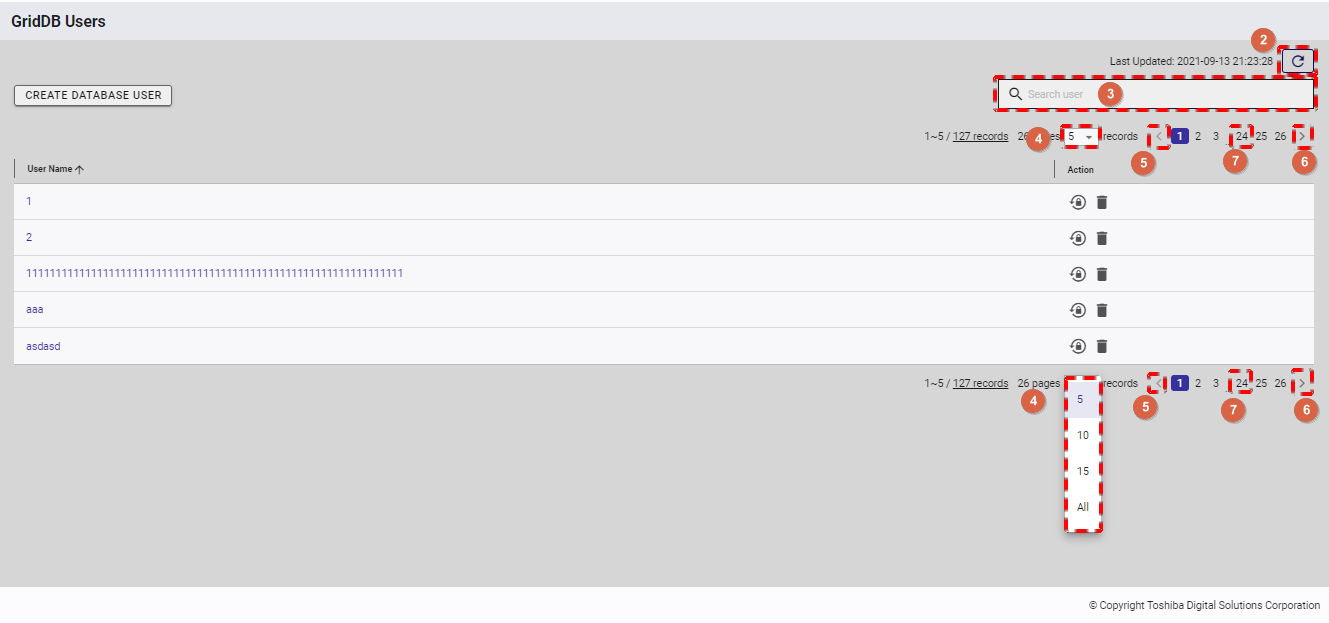
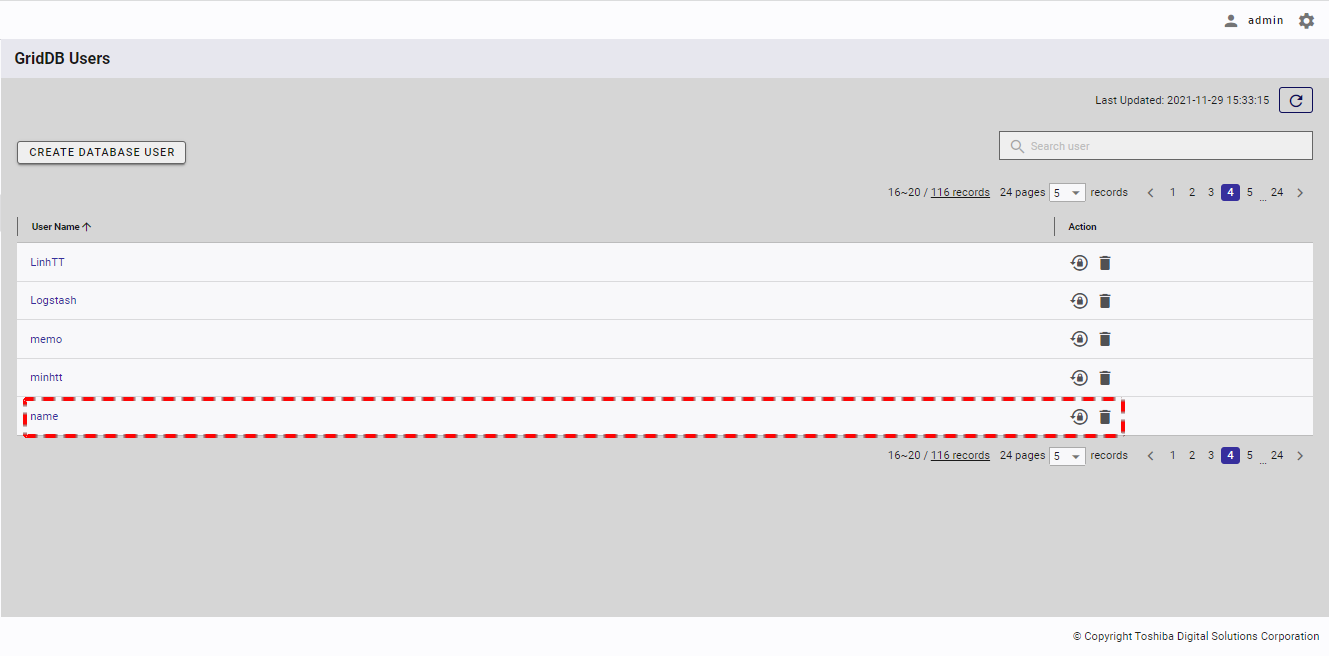
- To access the database user screen, first you must log in to the system and then click the item [GridDB Users] (①) in the left menu.
- You can choose the number of database users displayed on one page by selecting the number from [5, 10, 15, All] (④) at the top or bottom of the page. Click the [Next] button (⑥) or the [Back] button (⑤), or click the page number (⑦) to view another page.
- To search for a specific database user, type the name of the database user in the search bar (③).
- To refresh the database user list and get the latest information about the database user list, click the [Refresh] button (②) at the top of the right panel.
- You can adjust the column size by dragging and dropping the vertical bar "|" on the header.
4.13.3 Creating a database user
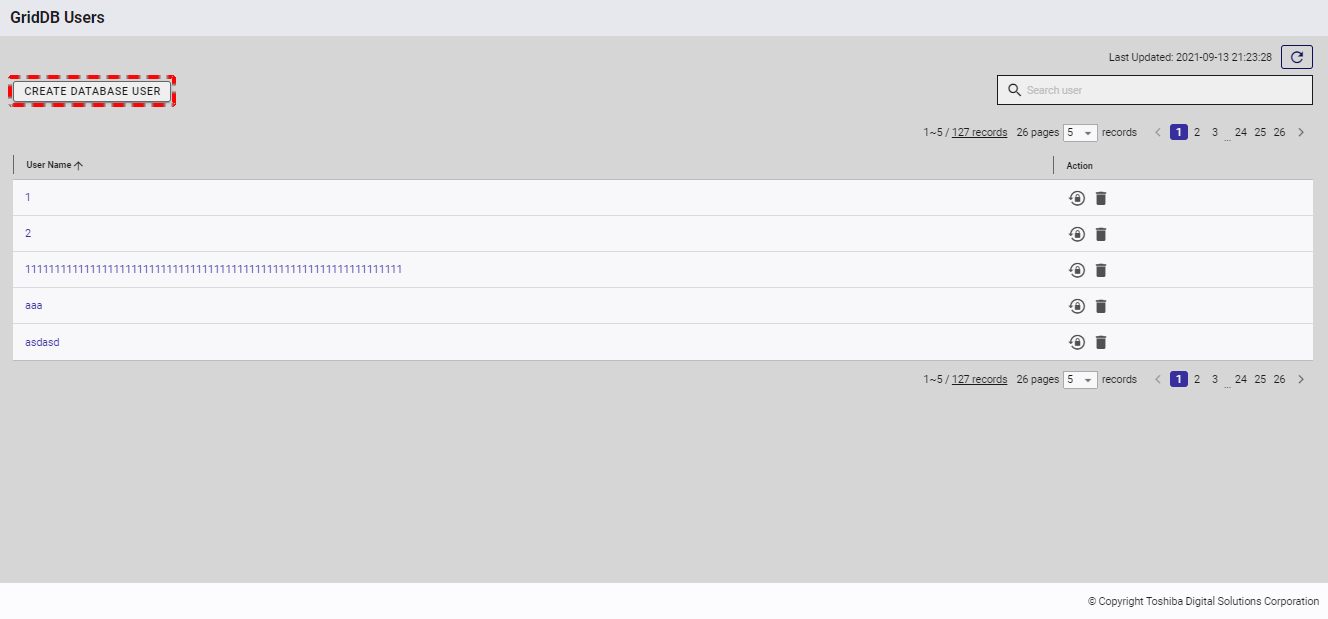
Step 1: To create a new database user, click the [CREATE DATABASE USER] button.
[Note]: If the total number of database users reaches 128, the [CREATE DATABASE USER] will be disabled.
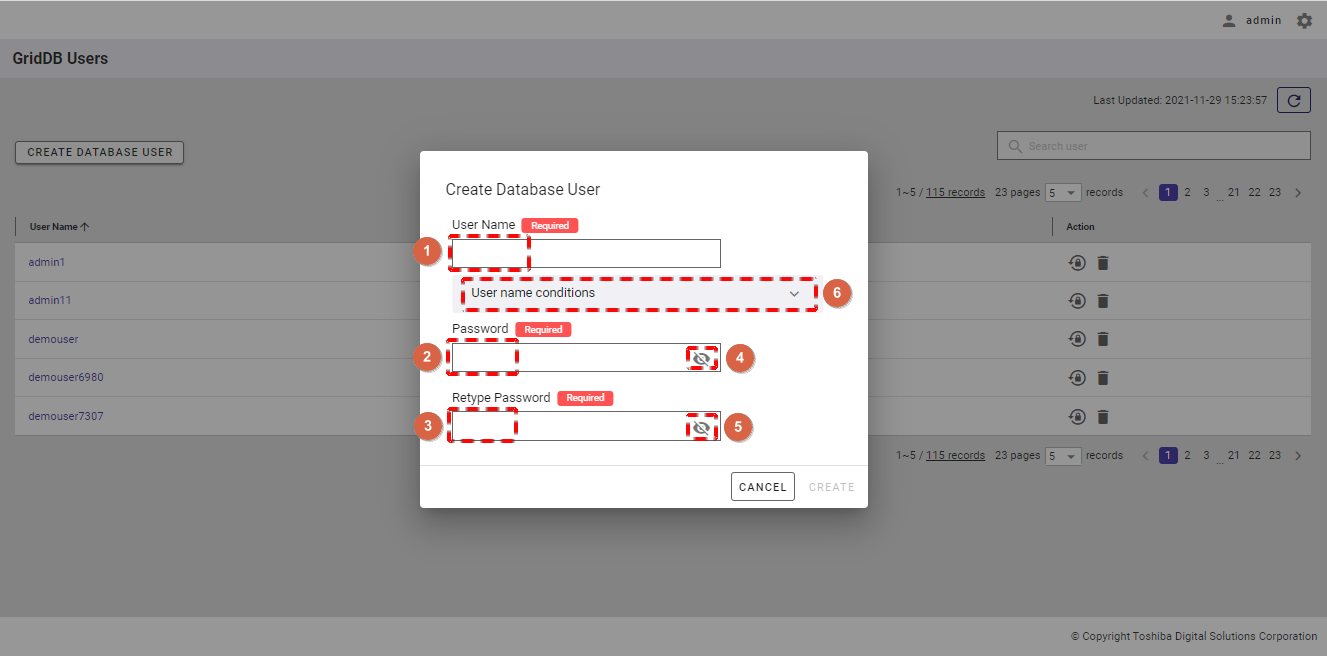
- Enter the user name in the text box (①), enter the password in the text box (②), and retype the password in the text box (③).
- You can check the password you have entered by clicking the show/hide (④) and (⑤) icons.
- You can click the [User name conditions] tab (⑥) to show/hide the conditions for a user name.
Step 3: After entering the database user information, click the [CREATE] button to create a new database user. Or click the [CANCEL] button to go back to the database user list screen without creating a database user.
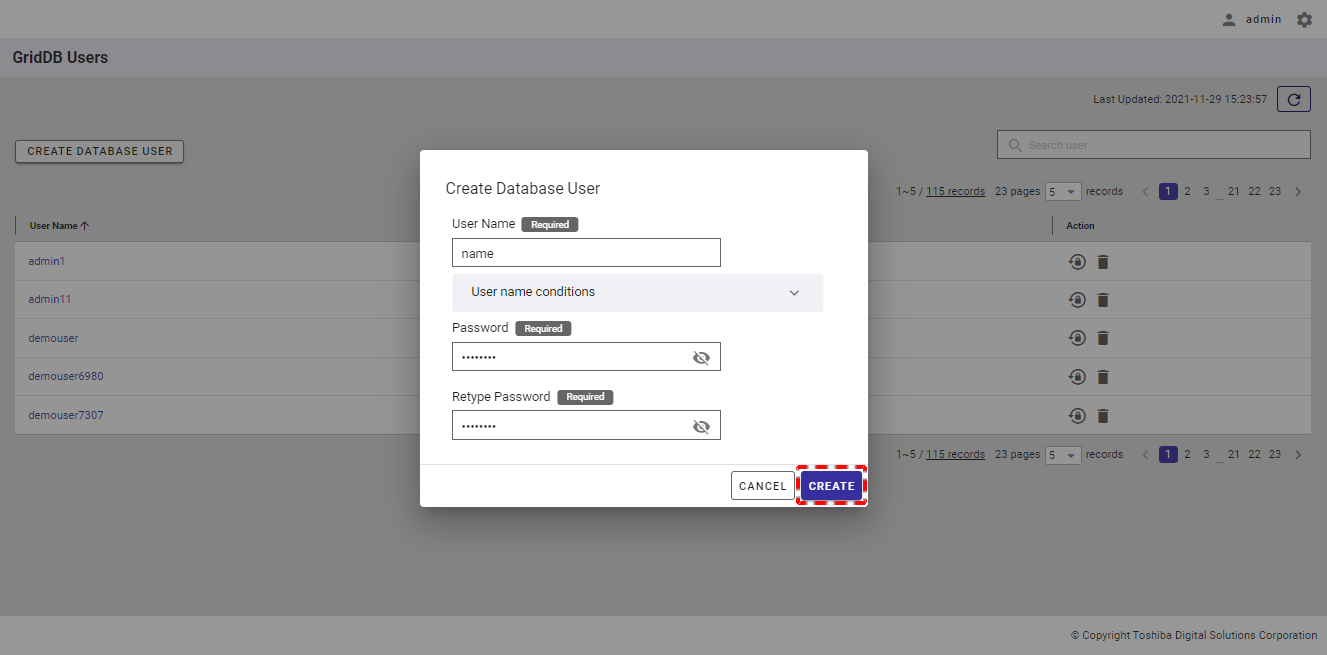
The new database user is then added to the database user list.
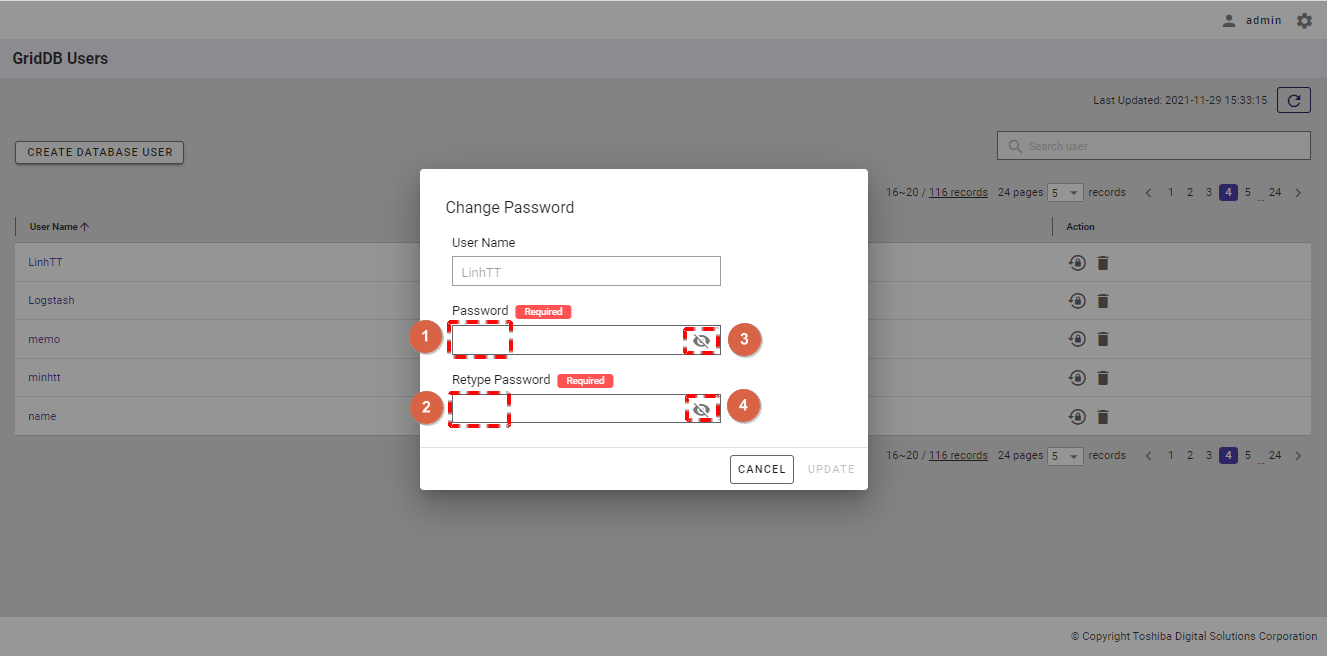
4.13.4 Changing a database user password
Step 1: To change the password of a database user, click the [CHANGE PASSWORD] button on the right of the database user item.

Step 2: Enter a new password:
Enter a new password in the text box (①) and retype the new password in the text box (②).
You can check your password you have entered by clicking the show/hide (③) and (④) buttons.
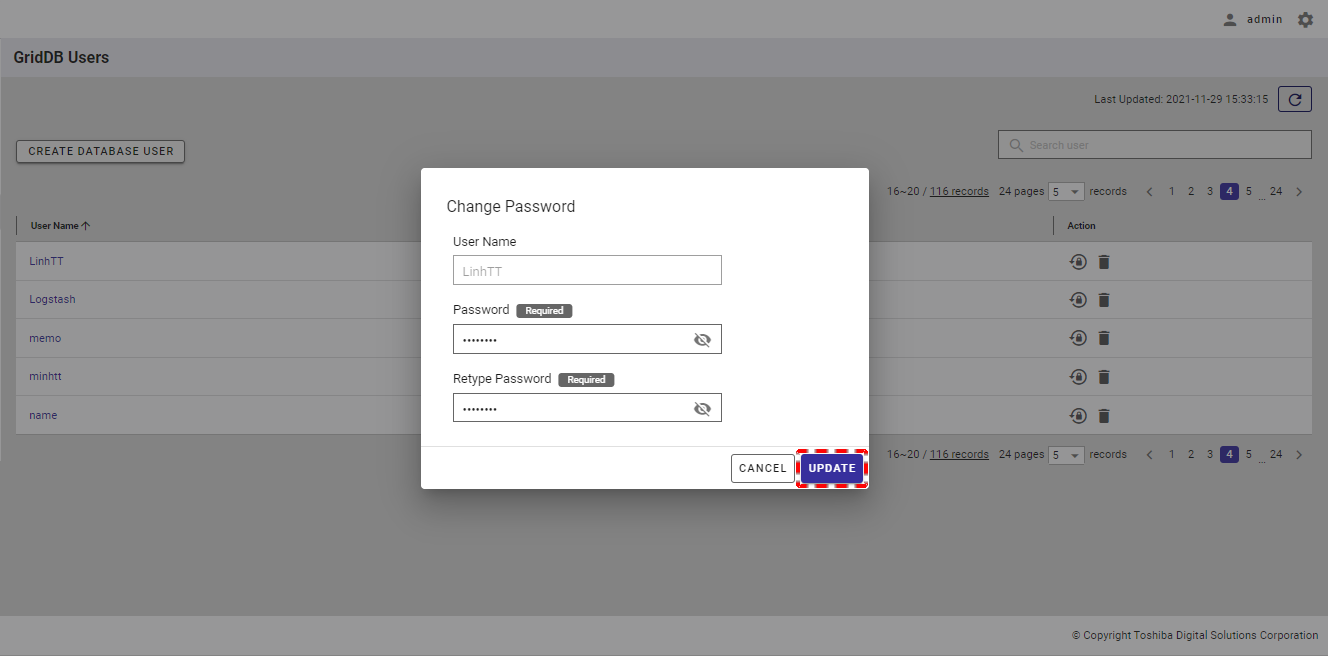
Step 3: After entering the new password, click the [UPDATE] button to change the password for the database user. Or click the [CANCEL] button to go back to the database user list screen without changing the password for the database user.
4.13.5 Deleting a database user
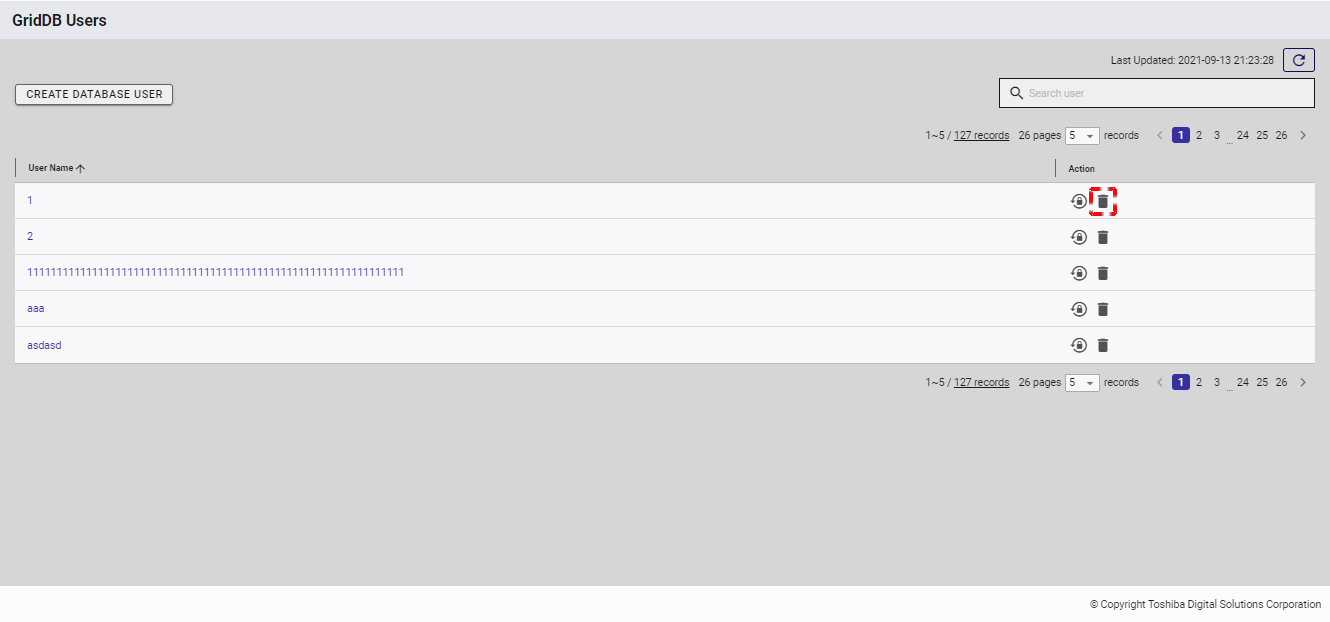
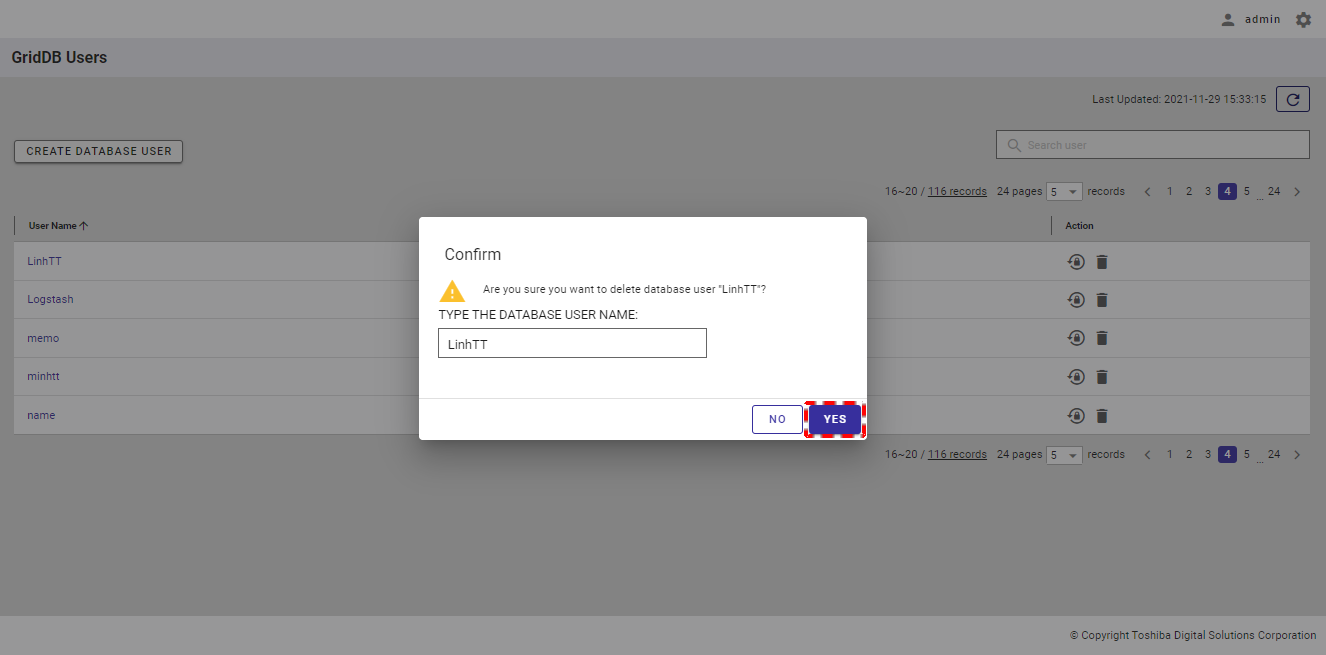
Step 1: To delete a database user, click the [DELETE] button on the right of the database user item.
Step 2: When the confirmation dialog is displayed, enter the username of a database user into the text field to confirm deletion.
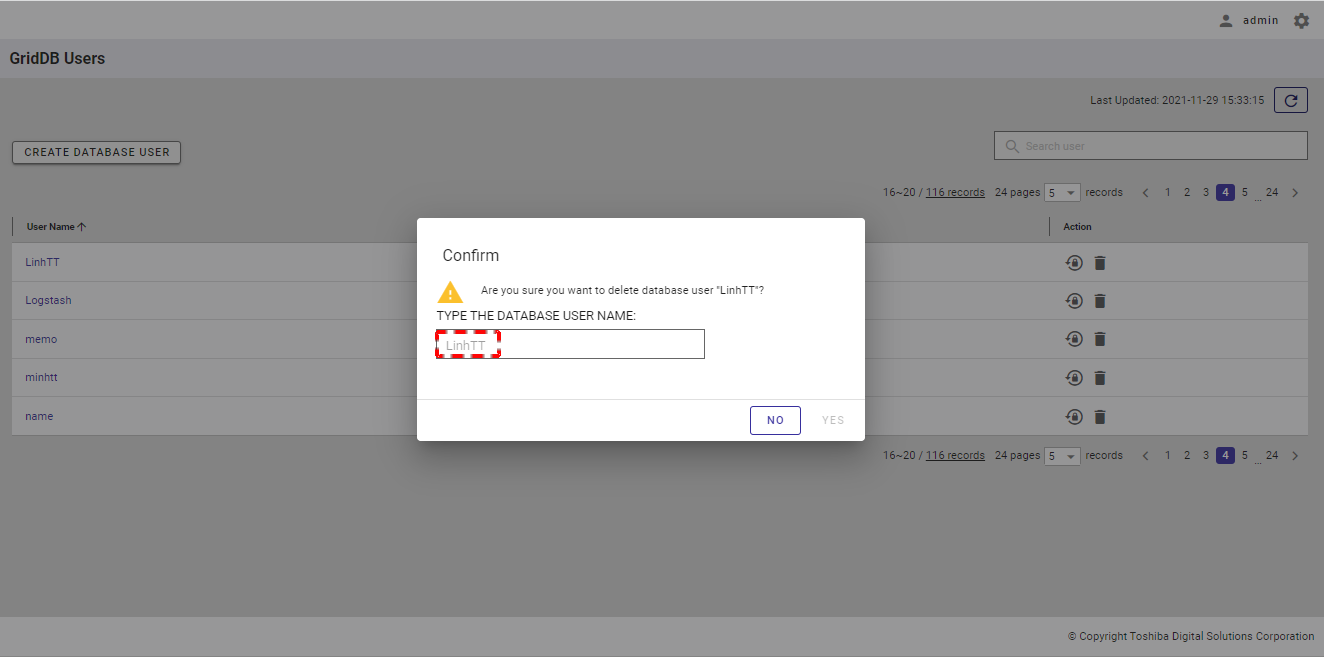
Step 3: Click the [YES] button to continue to delete the database user. Or click the [NO] button to close the dialog and return to the database user list screen without deleting the database user.
4.13.6 Displaying database user details
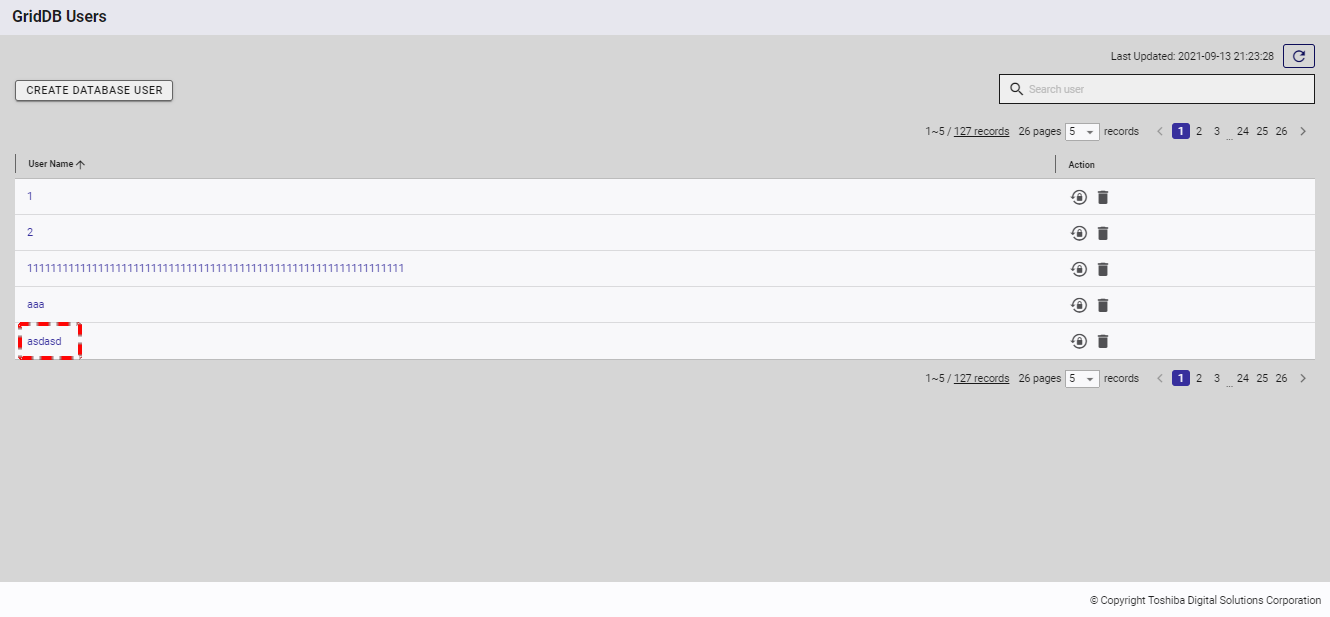
To see the details of the specific database user, click the database user name in the database user list.
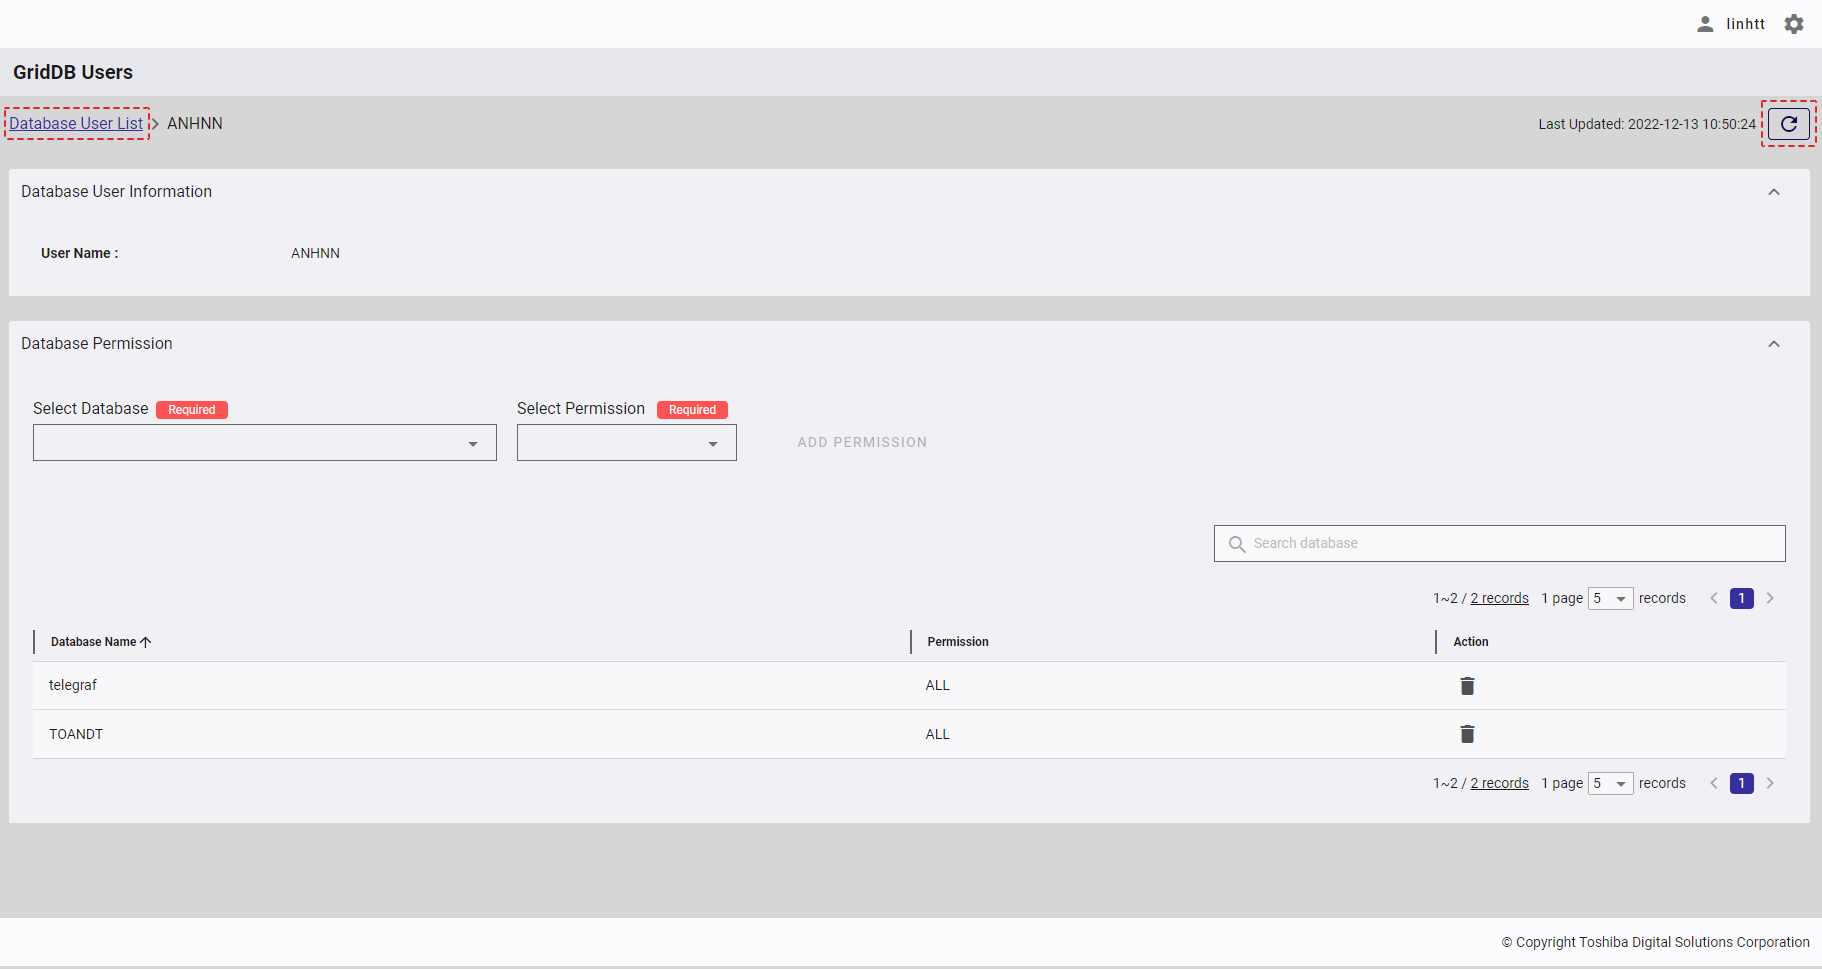
- To go back to the database user list, you can click the item [Database User List] (①).
- To get the latest information about the database user, click the [Refresh] button (②).
4.13.6.1 Displaying database user information
You can click the [Database User Information] tab to show/hide the information on the database user.
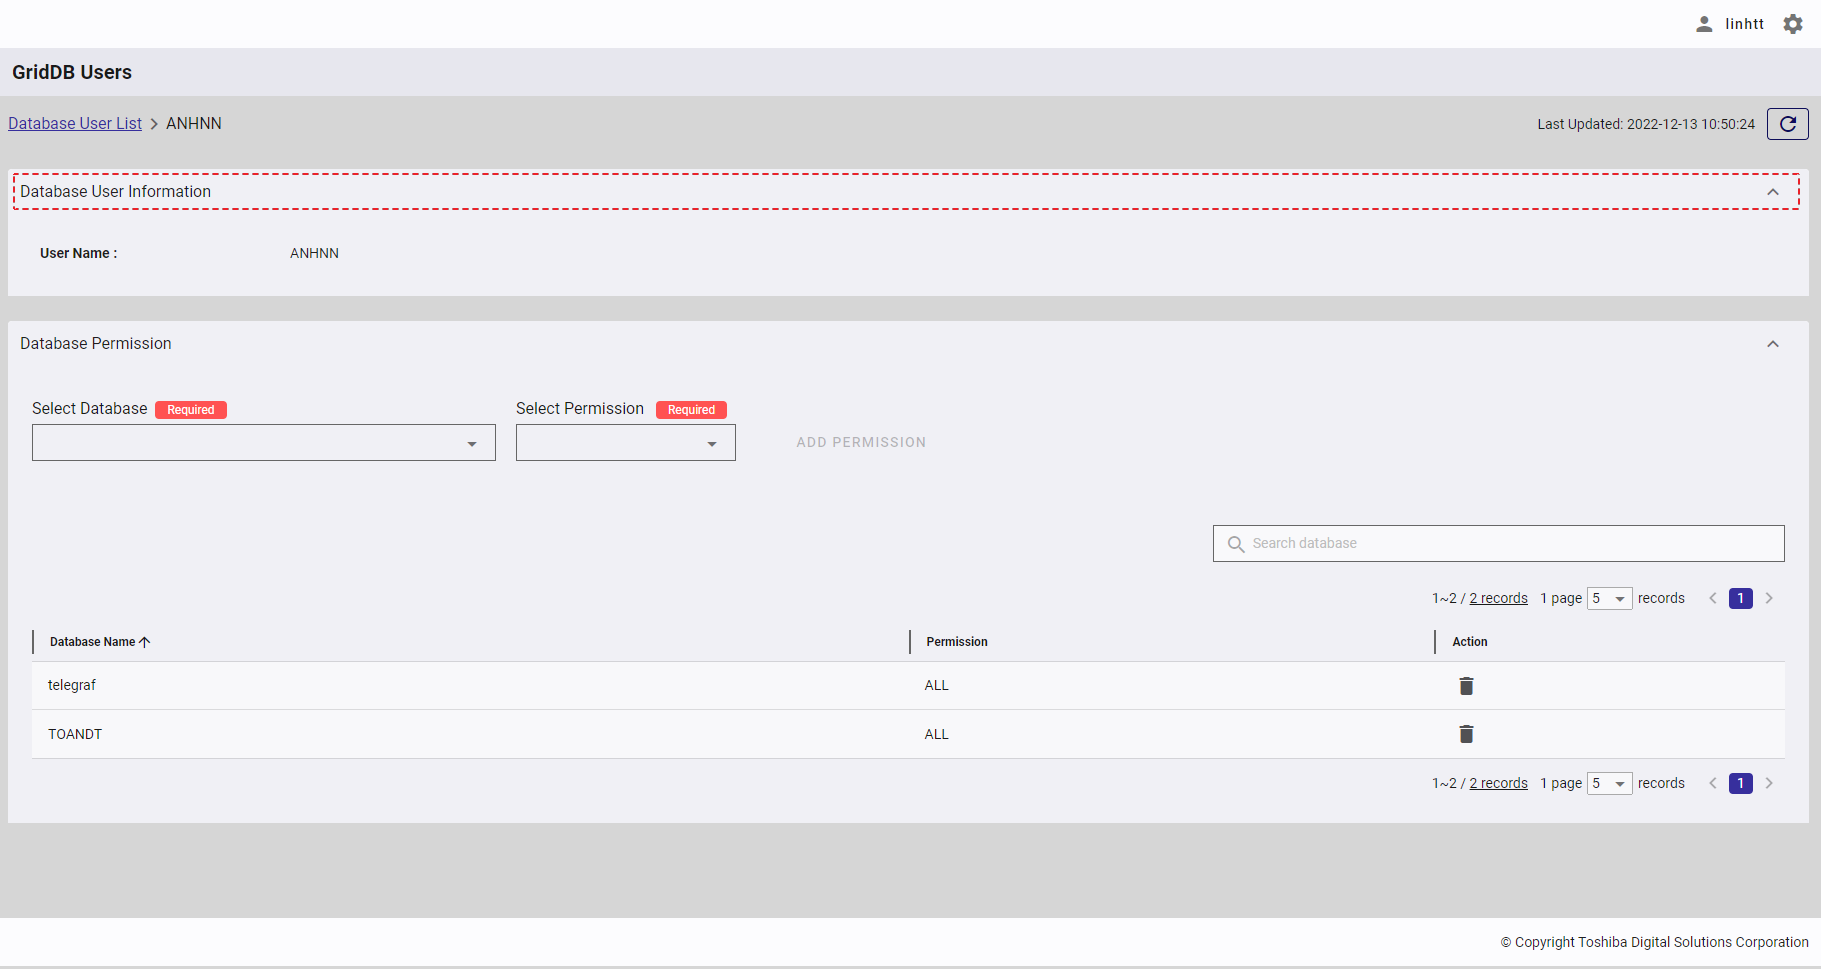
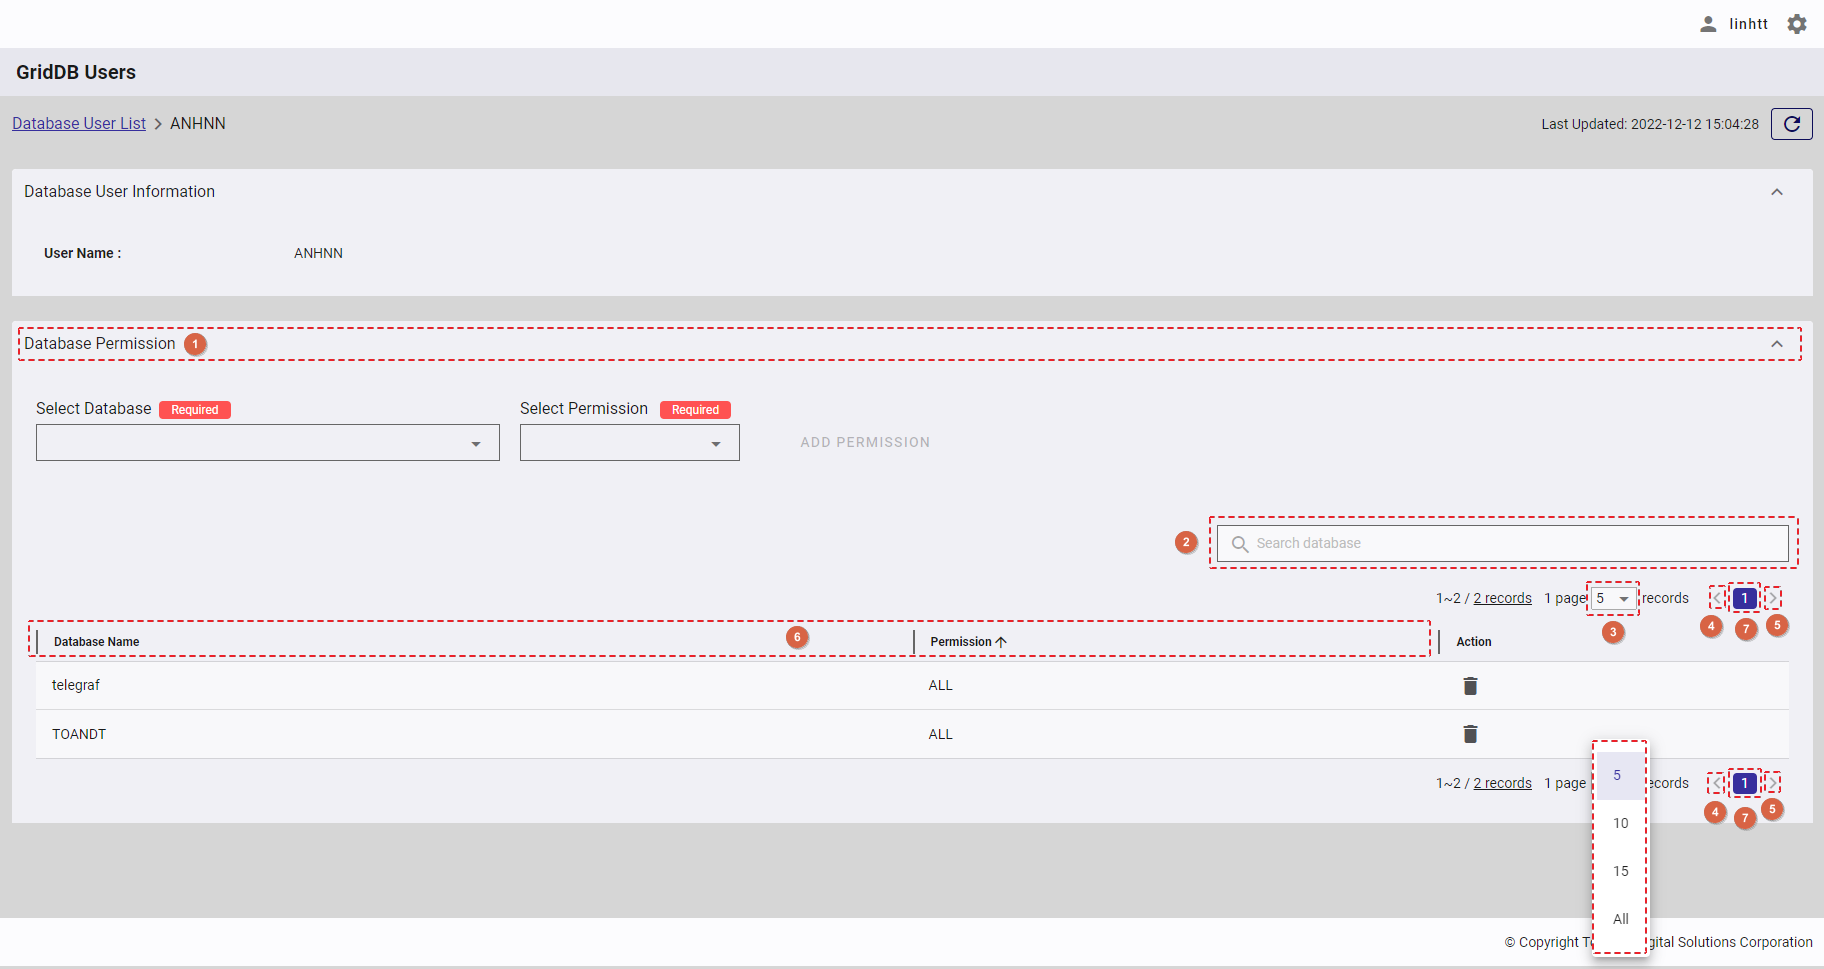
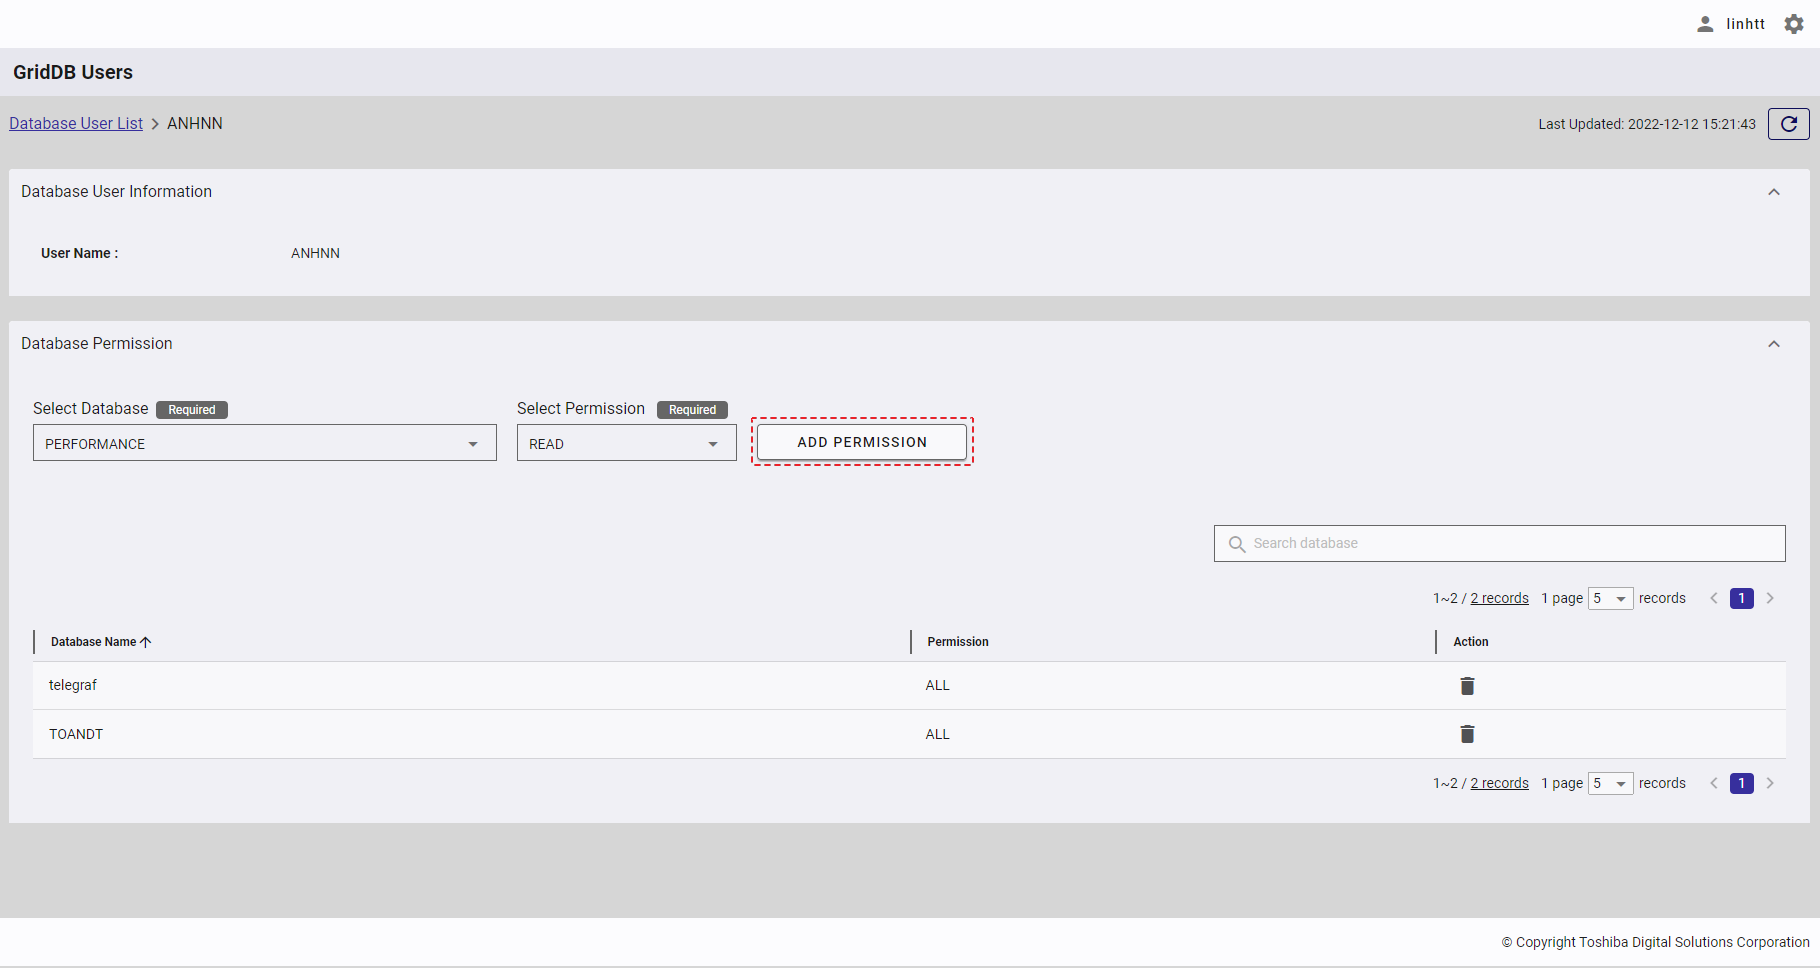
4.13.6.2 Displaying database permissions
- You can click the [Database Permission] tab (①) to show/hide the database permission list of the database user.
- To search for the permission of a specific database, type the database name in the search bar (②).
- You can choose the number of databases displayed on one page by selecting the number from [5, 10, 15, All] (③) on the bottom of the page. Click the [Next] button (⑤), the [Back] button (④), or the page number (⑦) to view another page.
- You can order the list of database permissions by database name or by database permission, by clicking the header (⑥) of each column.
- You can adjust the column size by dragging and dropping the vertical bar "|" on the header.
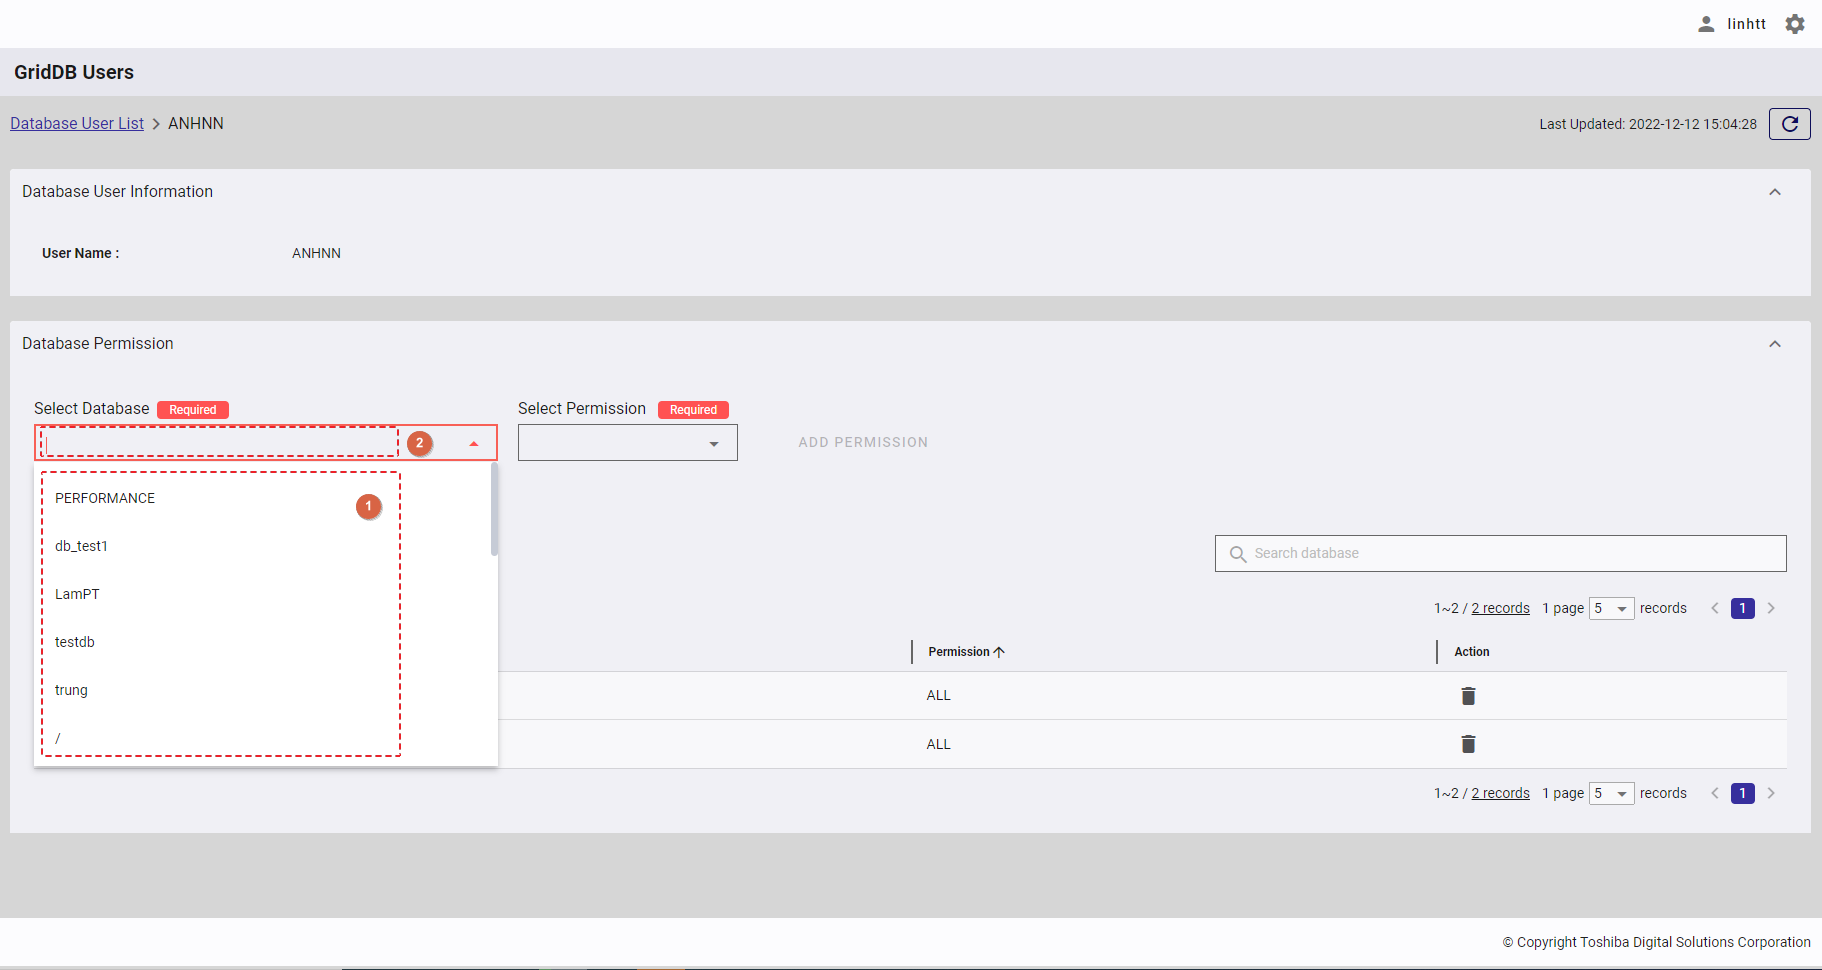
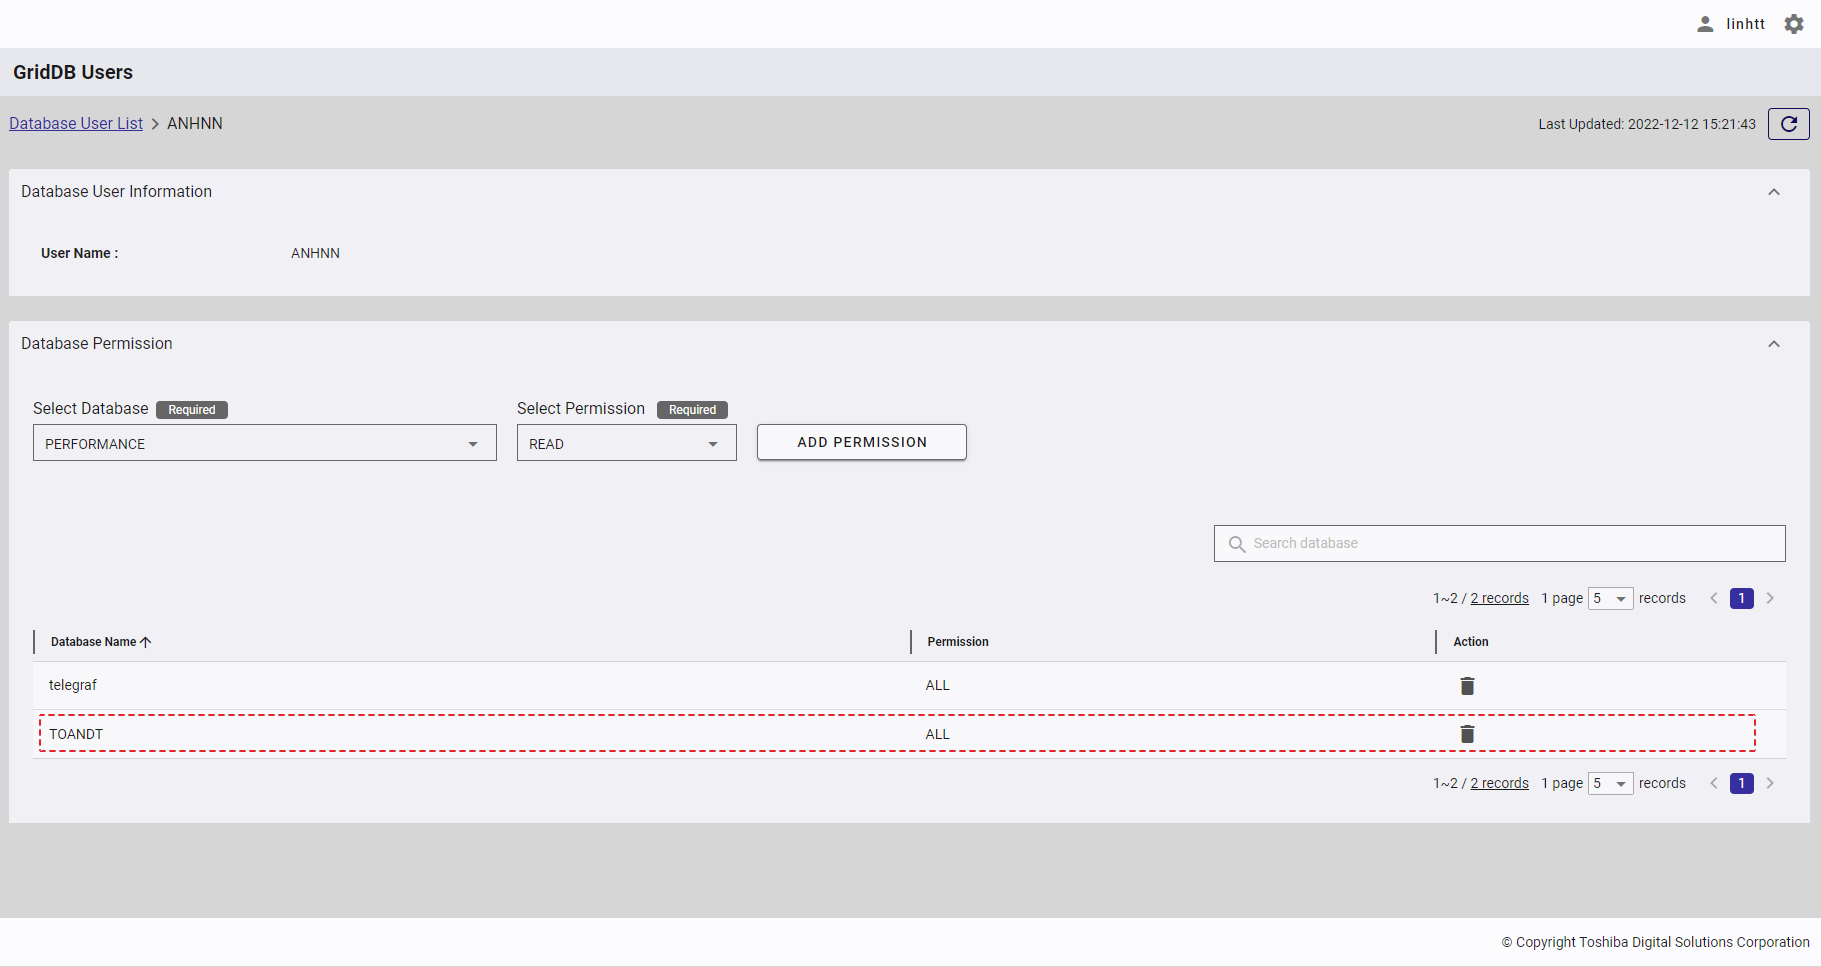
4.13.6.3 Adding a database permission
Step 1: To add a new database permission, first select the database (①) which you want to add a new permission to. You can also enter the database name in the text box (②) to search for the database name you want to select.
Step 2: Select the permission [READ] or [ALL] you want to add to the database selected in Step 1.
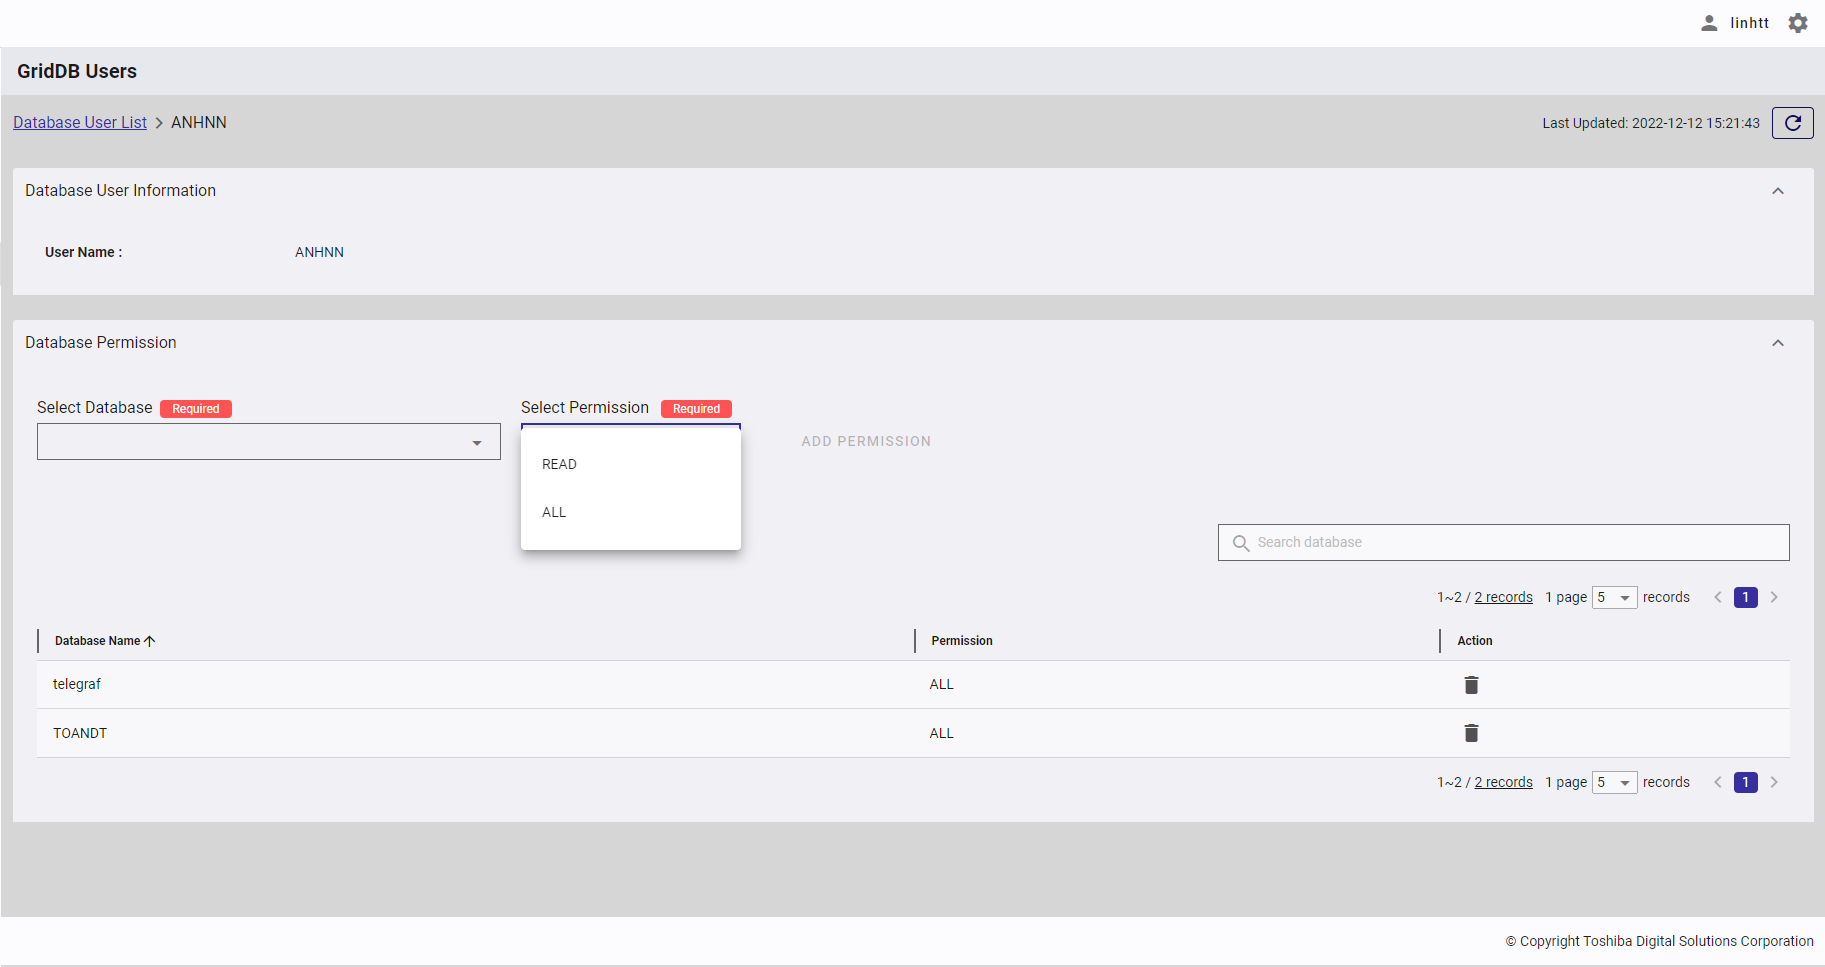
- Types of database permission:
| Database permission | Description |
|---|---|
| READ | Only search operations are allowed. |
| ALL | All operations on a container are allowed, including creating a container, adding a row, and searching for and creating an index. |
Step 3: Click the [ADD PERMISSION] button to add a new database permission.
A new database permission is then added to the database permission list.
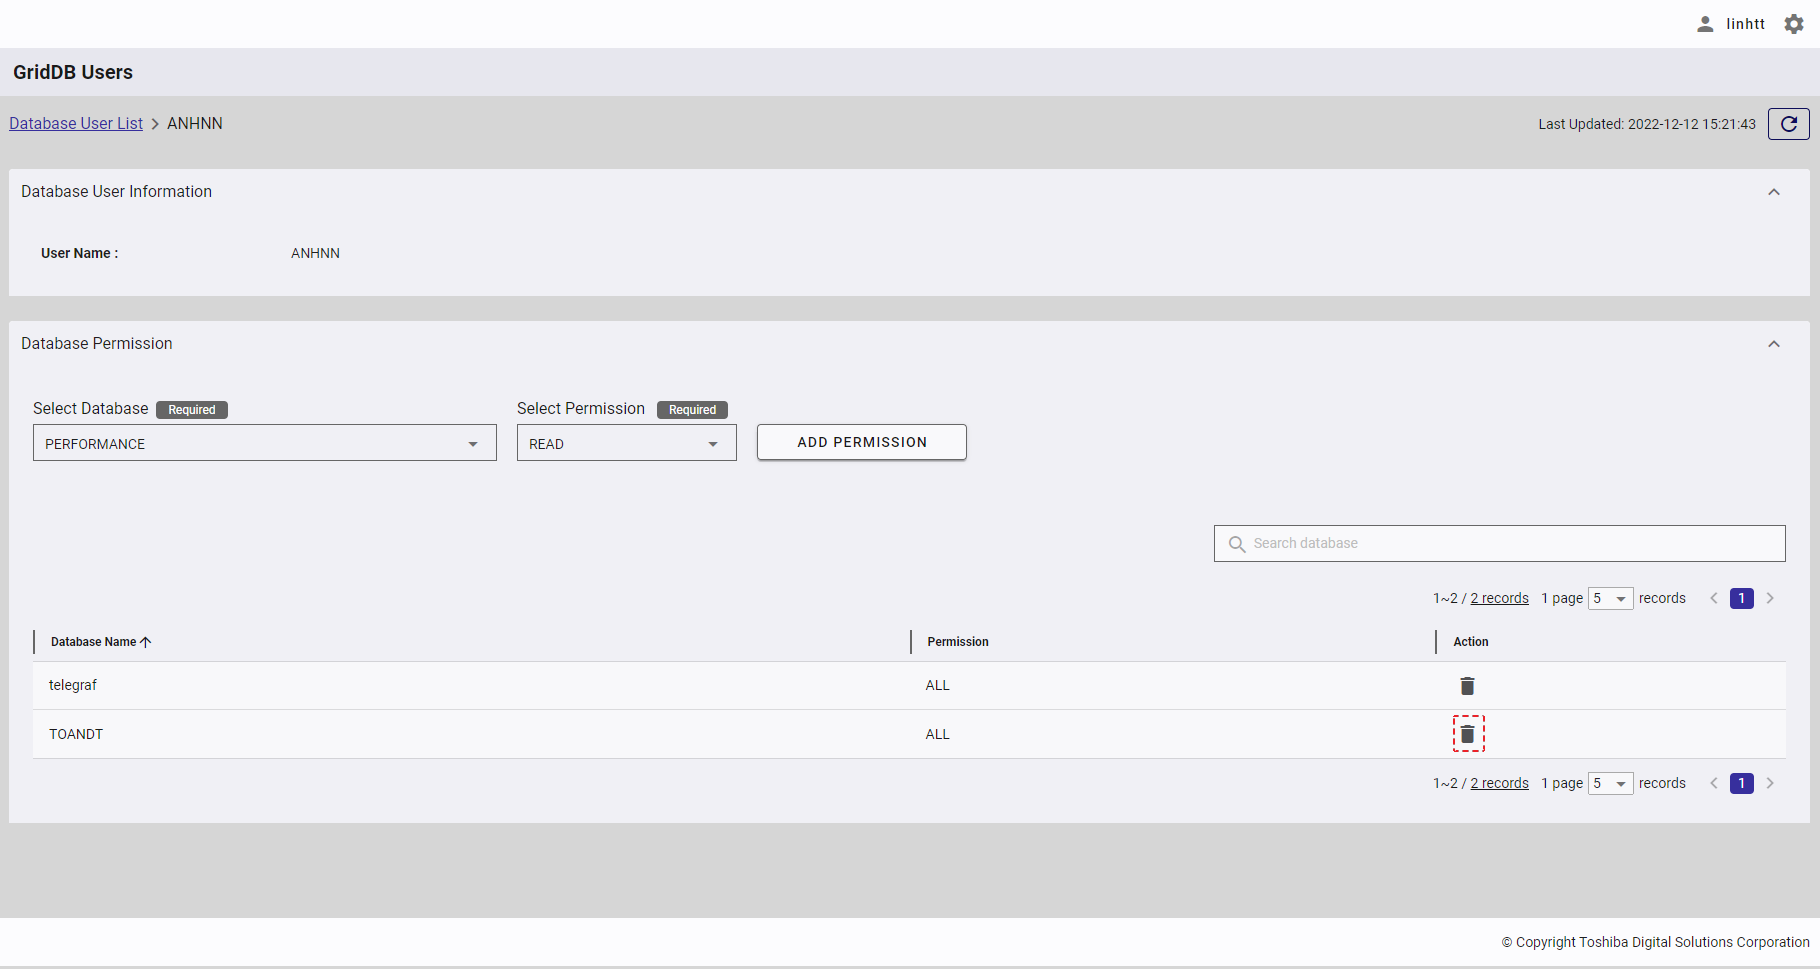
4.13.6.4 Deleting a database permission
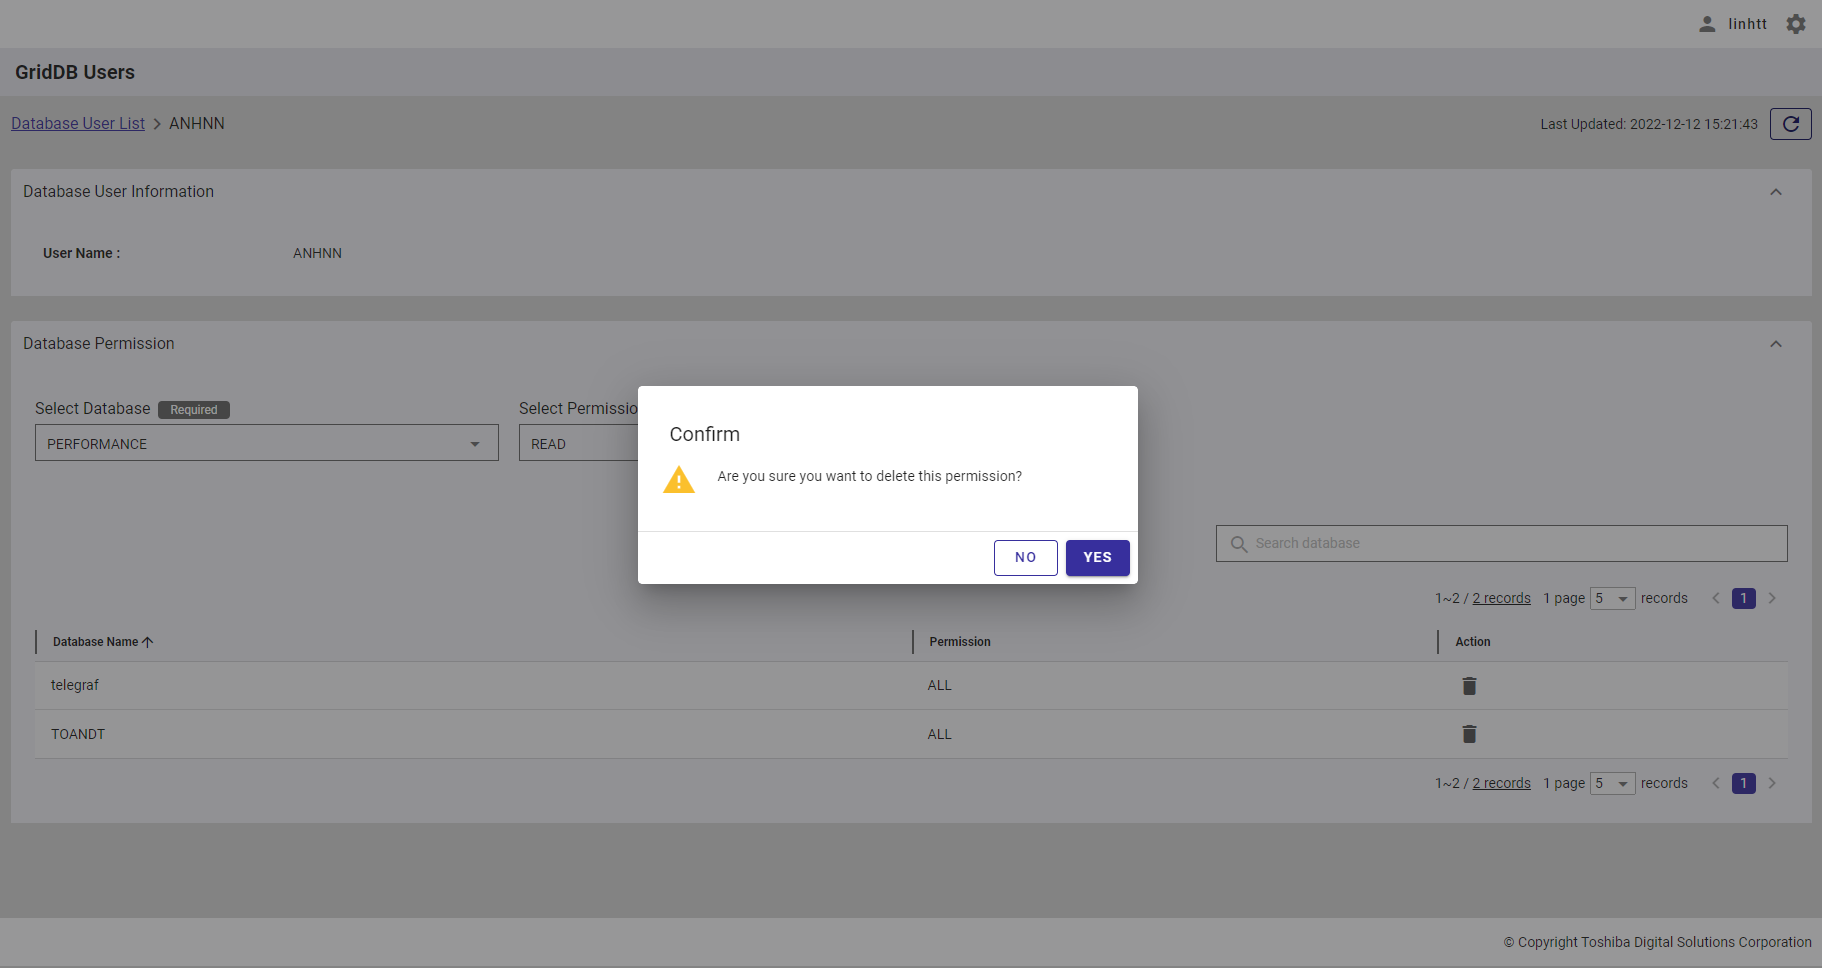
Step 1: To delete a database permission, click the [DELETE] button on the right of the database permission item.
Step 2: After the confirmation dialog is displayed, click the [YES] button to continue to delete the database permission. Or click the [NO] button to go back to the database permission screen without deleting the database permission.
4.14 Regular export schedules function
This function is used for adding a regular export schedule. More specifically, it is used for setting an export schedule for databases and containers to be exported and an interval at which export is performed. Thus, jobs are regularly created to perform export according to the schedule set with this function. The export result will be saved in Azure Storage as a csv file.
[Note]: This function is available for a fee.
4.14.1 Available roles
In the table below, the role with a plus sign (+) can use the function on the left.
| No. | Function | General user | Administrator user |
|---|---|---|---|
| 1 | Display a regular export schedule list | + | + |
| 2 | Add regular export schedules | + | + |
| 3 | Import a schedule from a CSV file | + | + |
| 4 | Delete regular export schedules | + | + |
| 5 | View schedule detail | + | + |
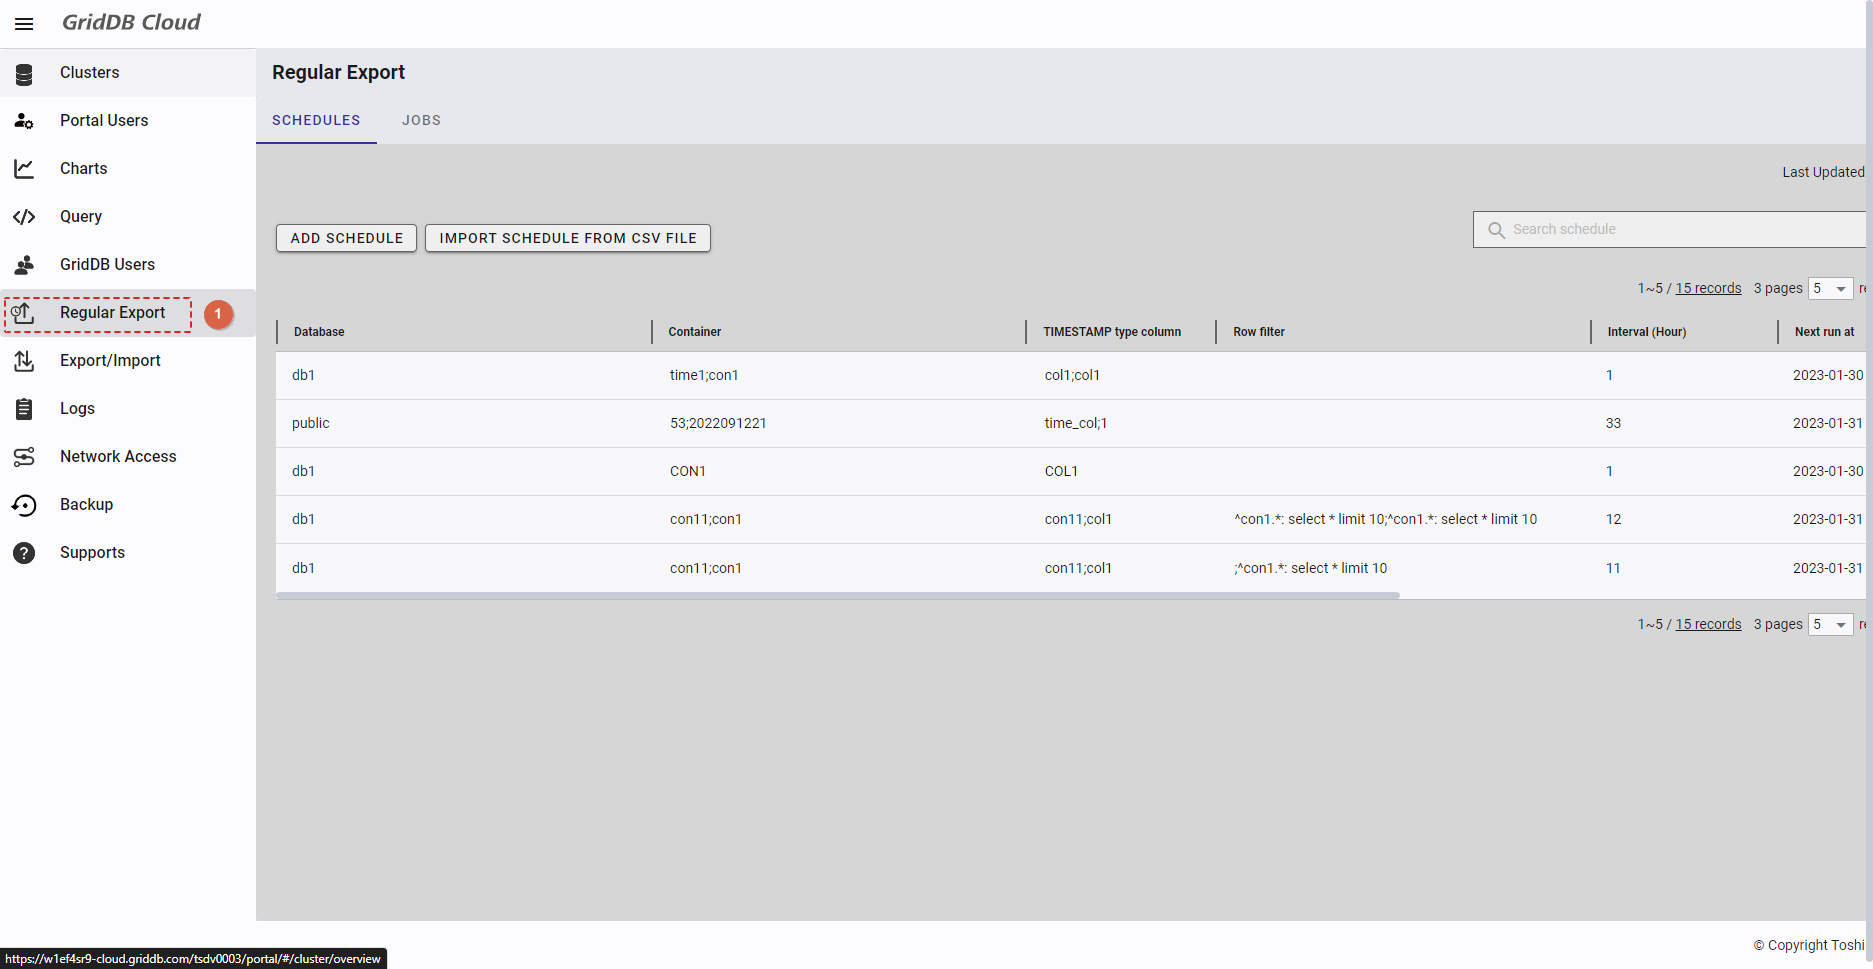
4.14.2 Displaying a regular export schedule list
This function displays a list of regular export schedules.
To access the Regular Export Schedule screen, first you must log in to the system and then click the item [Regular Export] (①) in the left panel.
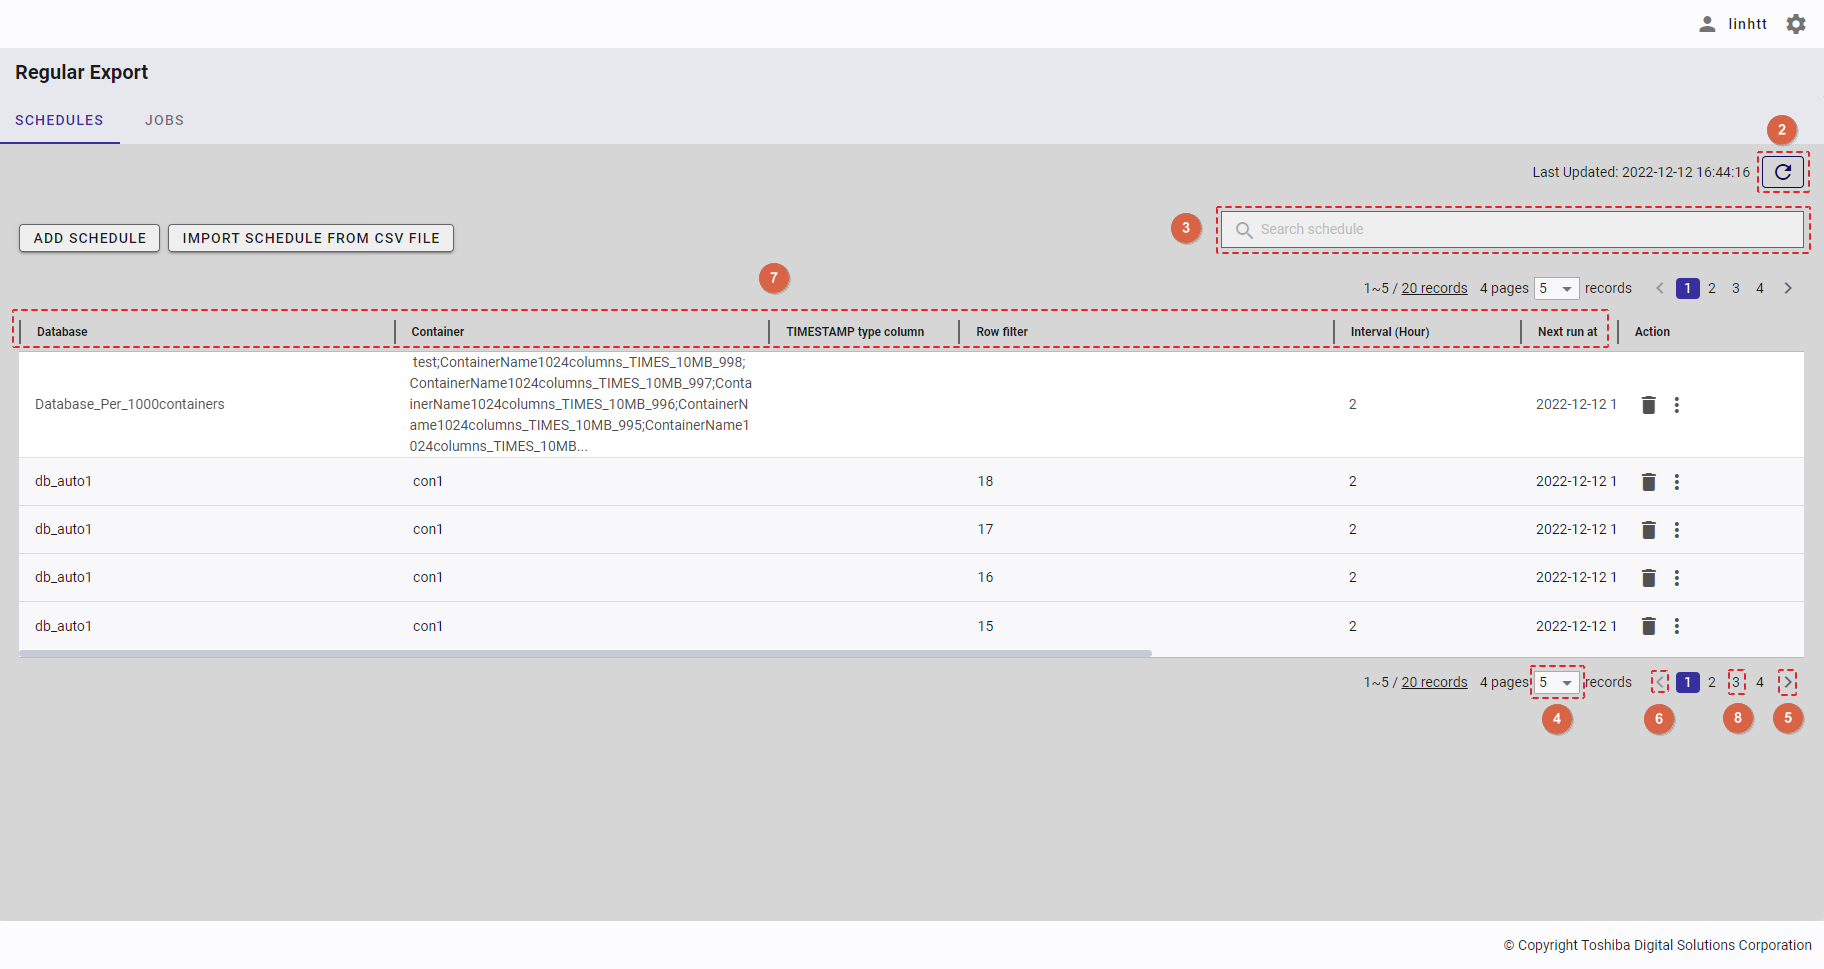
- You can choose the number of regular export schedule records displayed on one page by selecting the number from [5, 10, 15, All] (④) at the top or bottom of the page. Click the [Next] button (⑤) or the [Back] button (⑥), or click the page number (⑧) to view another page.
- To search for a specific schedule record, type the name of an item in the schedule record in the search bar (③).
- To refresh the regular export schedule list and get the latest information about the regular export schedule list, click the [Refresh] button (②) on the top of the right panel.
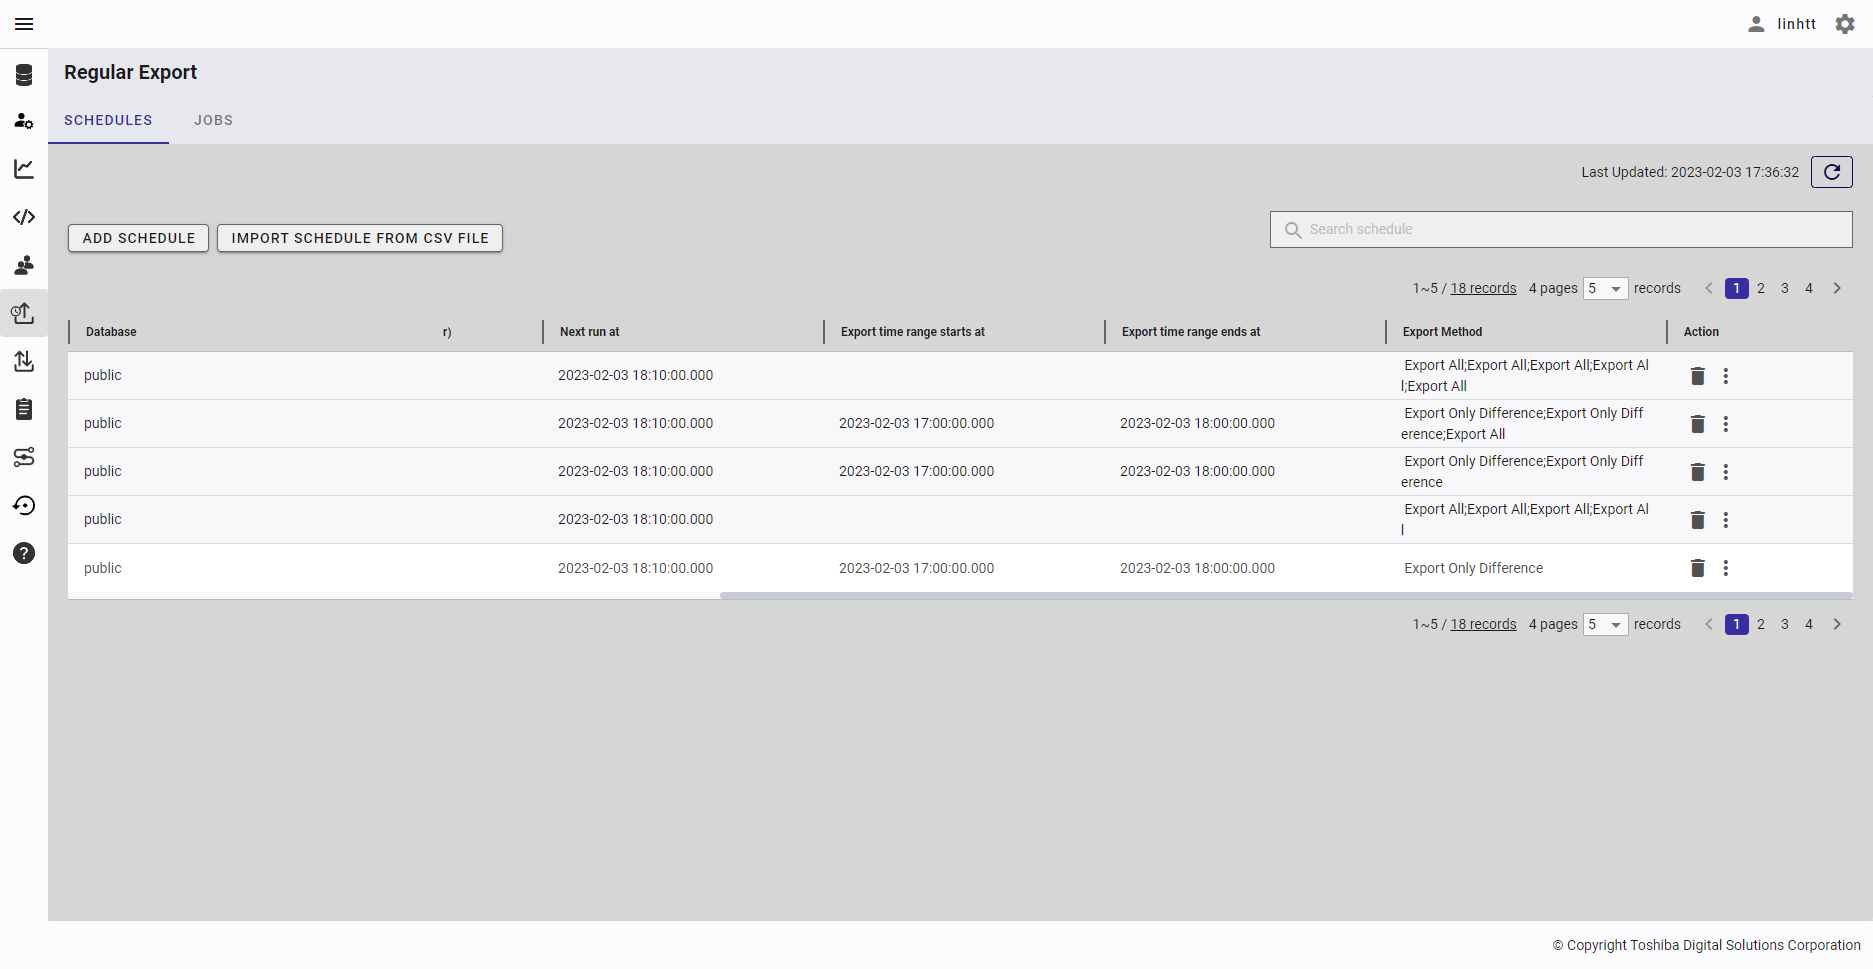
- You can order the regular export schedule list by database, by container, by TIMESTAMP type column, by row filter, by interval, by next run date, by 'export time range starts at', by 'export time range ends at', or by export method, by clicking the header (⑦) of each column.
- You can adjust the column size by dragging and dropping the vertical bar "|" on the header.
4.14.3 Adding a regular export schedule
This function adds a regular export schedule for which export data jobs are executed when the specified time is reached.
- Choose 'Export Only Difference' to export delta data (e.g., difference between 14:00 and 15:00, or difference between 15:00 and 16:00) extracted from timeseries data at an interval you set. To use this option, you need to specify a timeseries container or a collection with timestamp columns.
- Choose 'Export All' to export all data in the container at an interval you set.
4.14.3.1 Adding a regular export schedule to export delta data
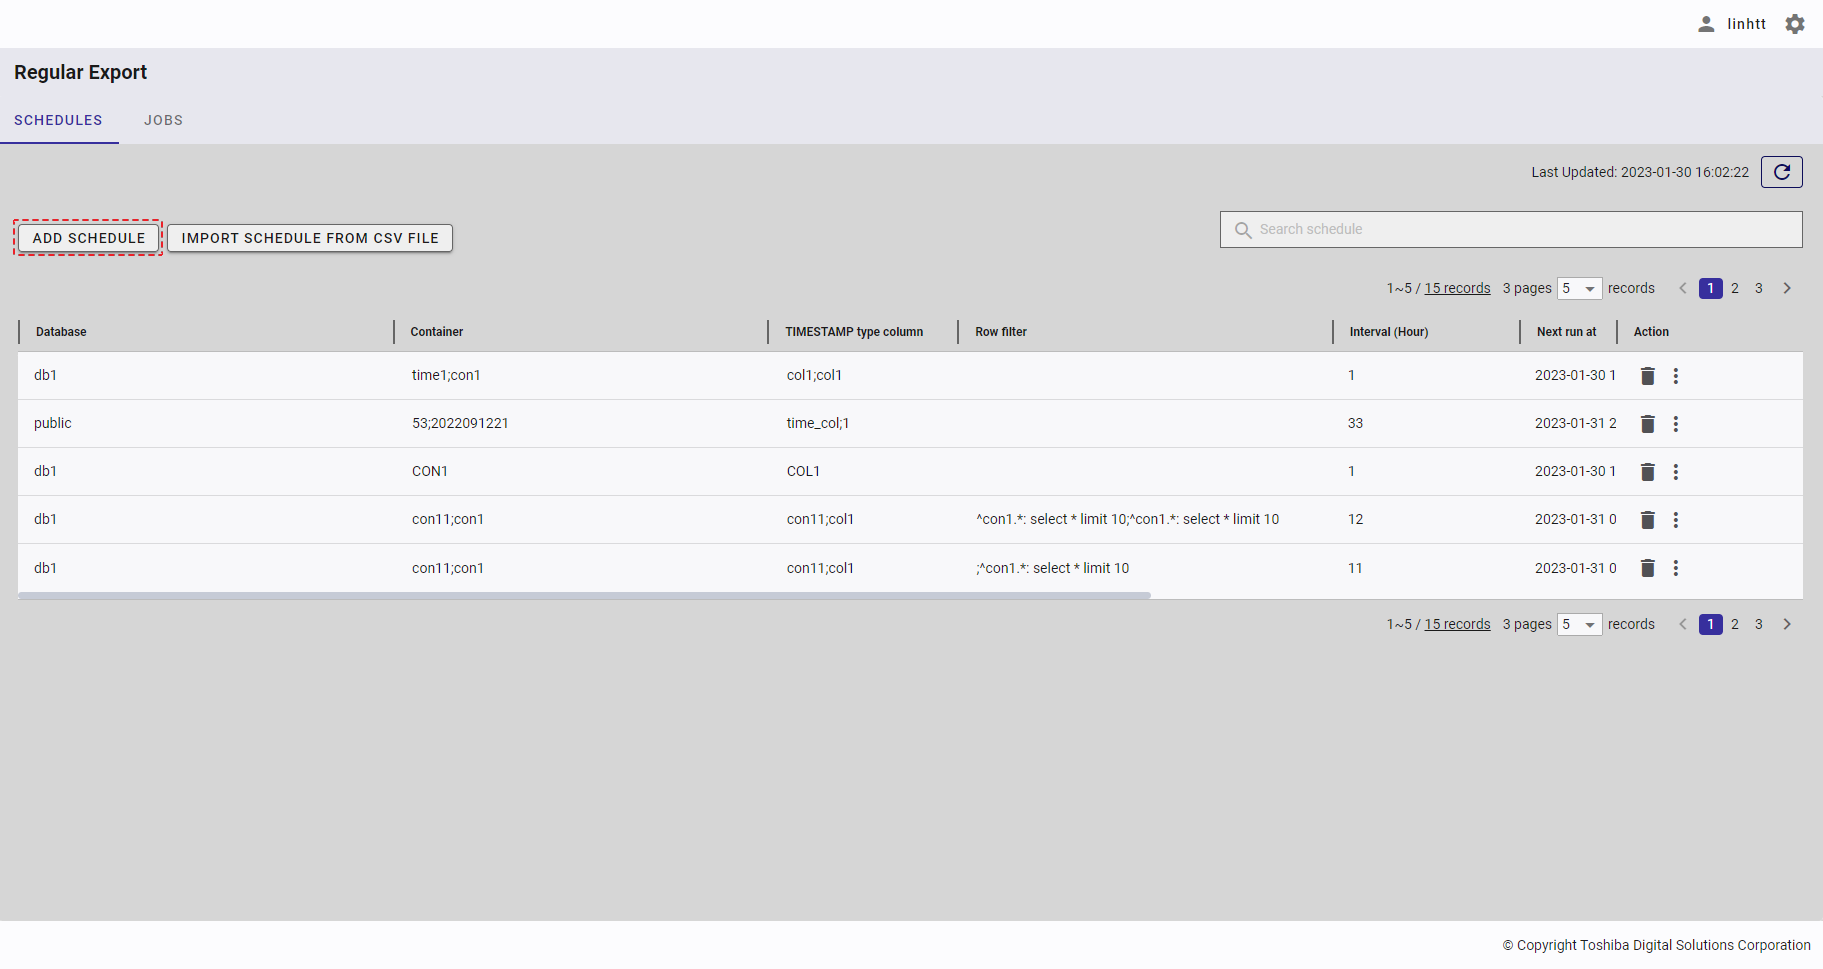
Step 1: To add a schedule, click the [ADD SCHEDULE] button.
Step 2: Select the [Export Only Difference] radio button (①). Then, select a database that includes containers to export from the [Database] drop-down list (②). Only one database can be selected. You can also enter the database name in the text box to search for a database name you want to select.
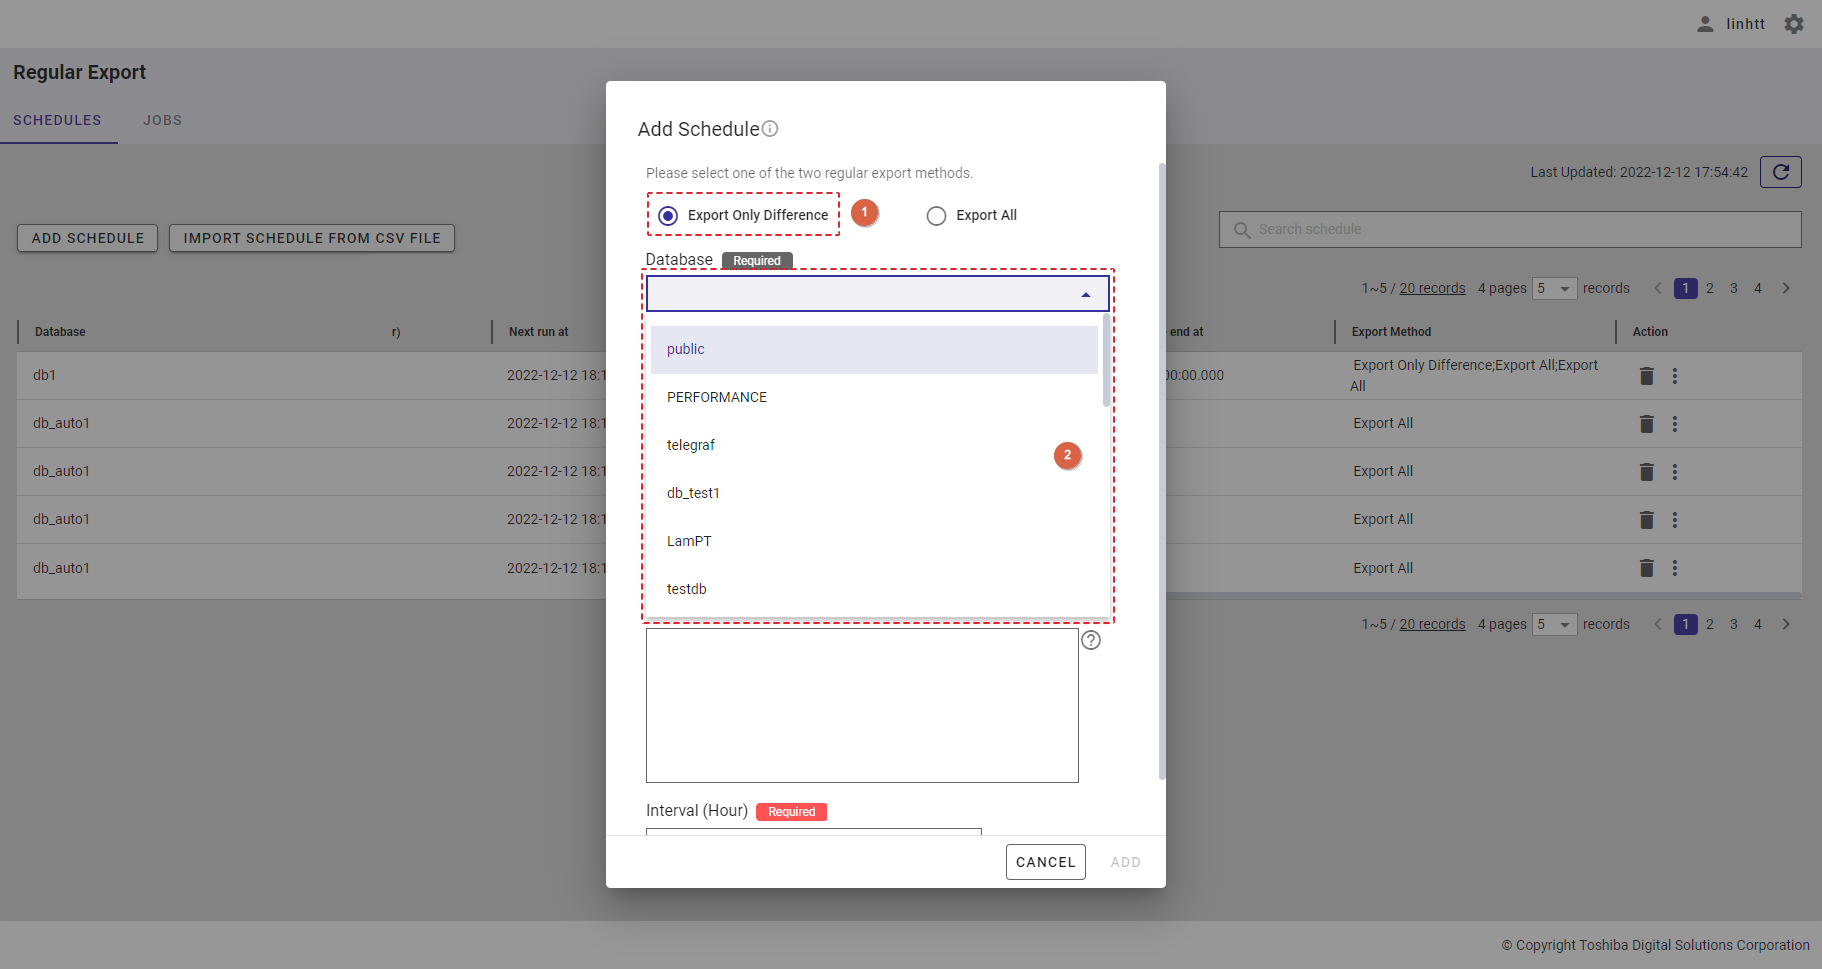
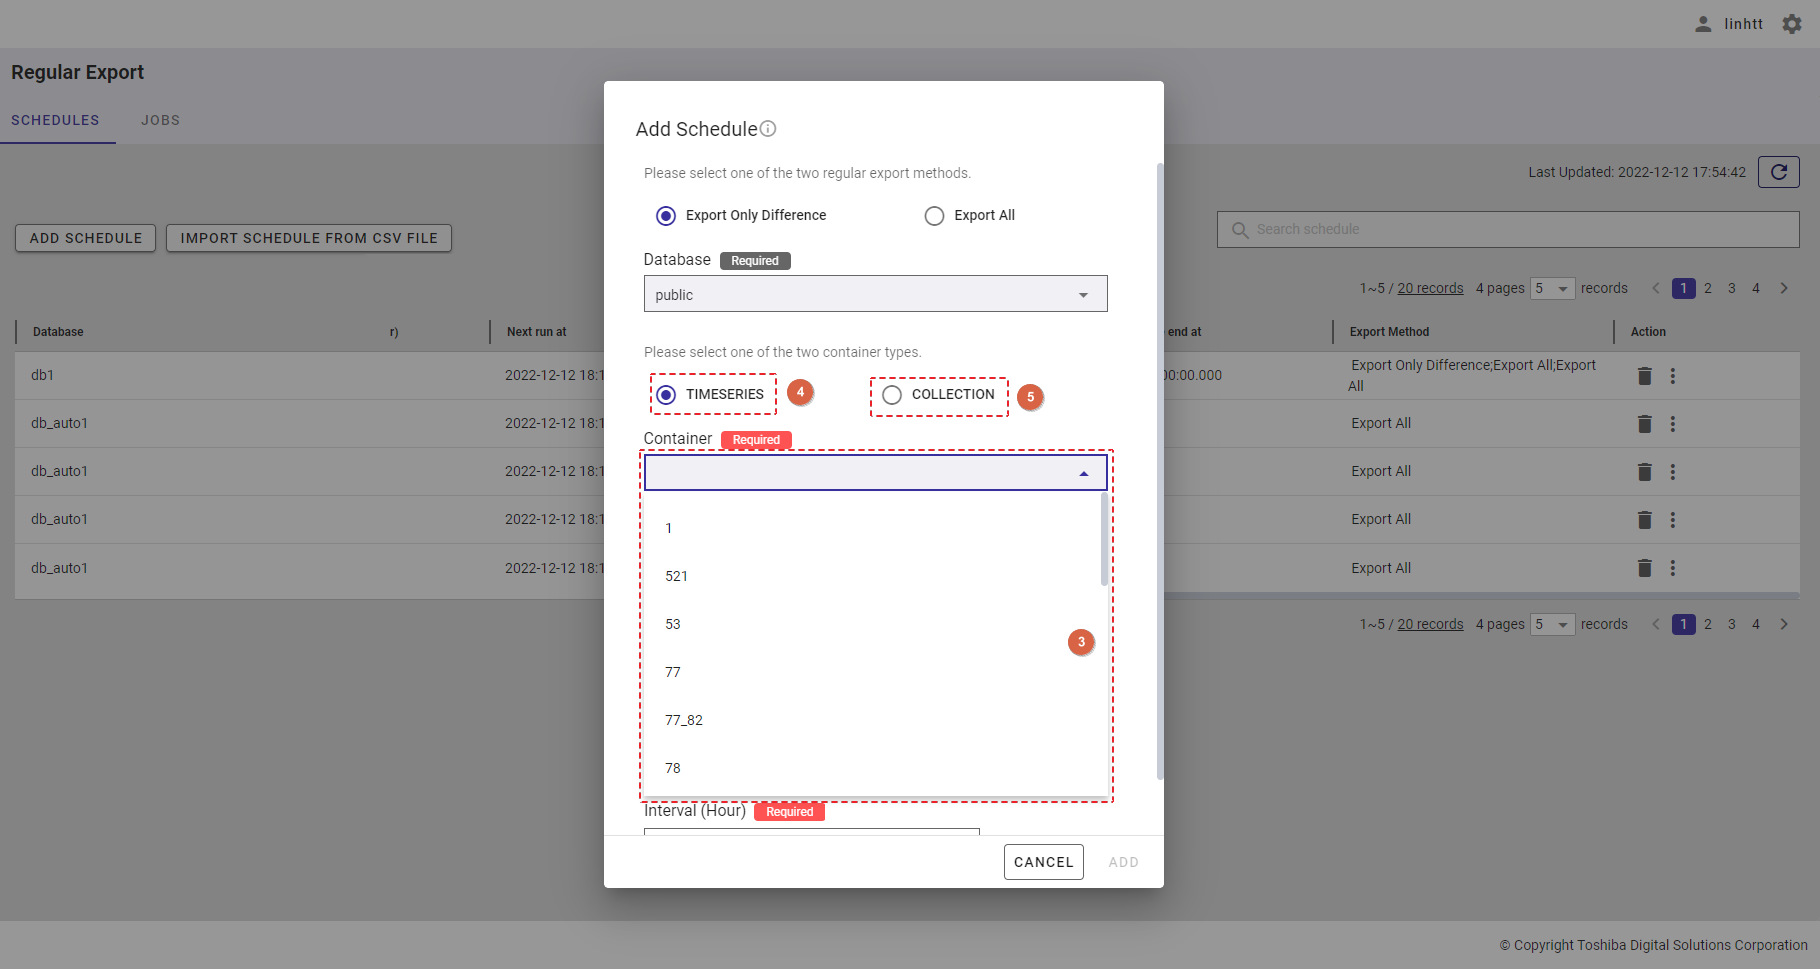
Step 3: Choose the container type by selecting the [TIMESERIES] radio button (④) or the [COLLECTION] radio button (⑤). Select a container to export from the [Container] drop-down list (③). Only one container can be selected. You can also enter the container name in the text box to search for a container name you want to select.
Type of container
Container type Note TIMESERIES For this container type, select a container that has a TIMESERIES data type. COLLECTION For this container type, select a container that has a COLLECTION data type.
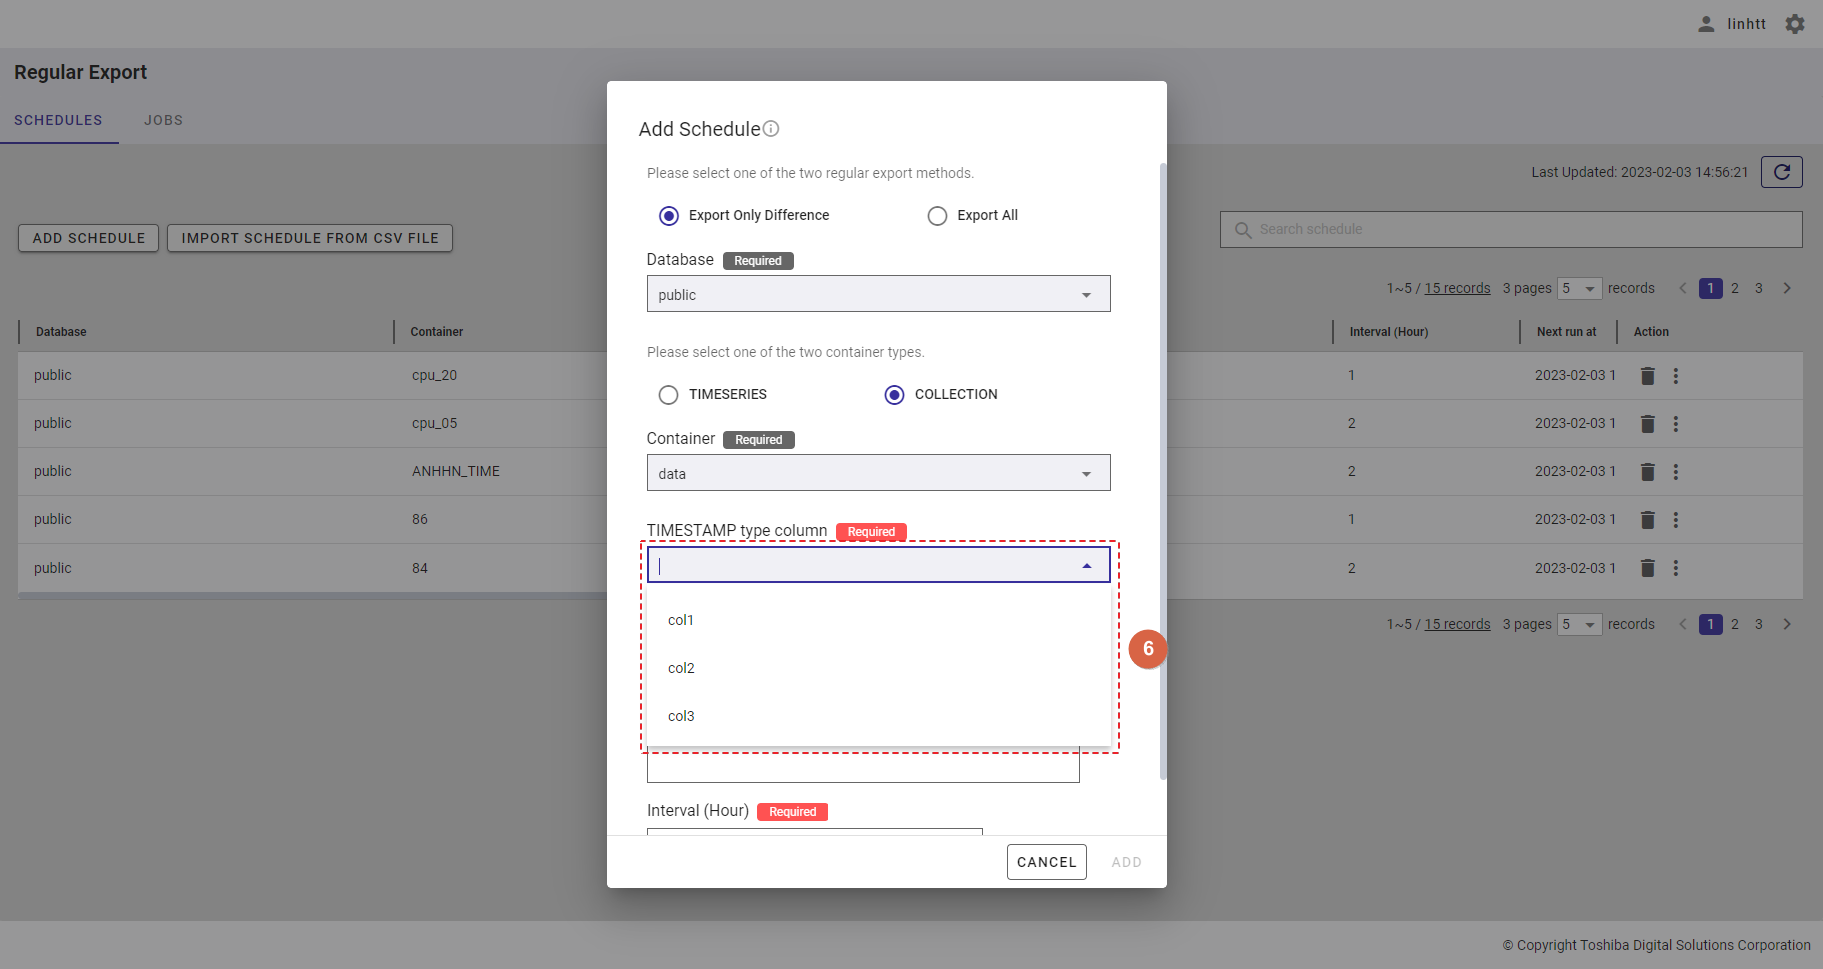
Step 4: Select the timestamp type column from the [TIMESTAMP type column] drop-down list.
| Container type | Note |
|---|---|
| TIMESERIES | If the container type TIMESERIES is selected, the first column will automatically be a TIMESTAMP type column (⑦); you cannot choose any other column. |
| COLLECTION | If the container type COLLECTION is selected, select a TIMESTAMP type column from the [TIMESTAMP type column] drop-down list (⑥). |
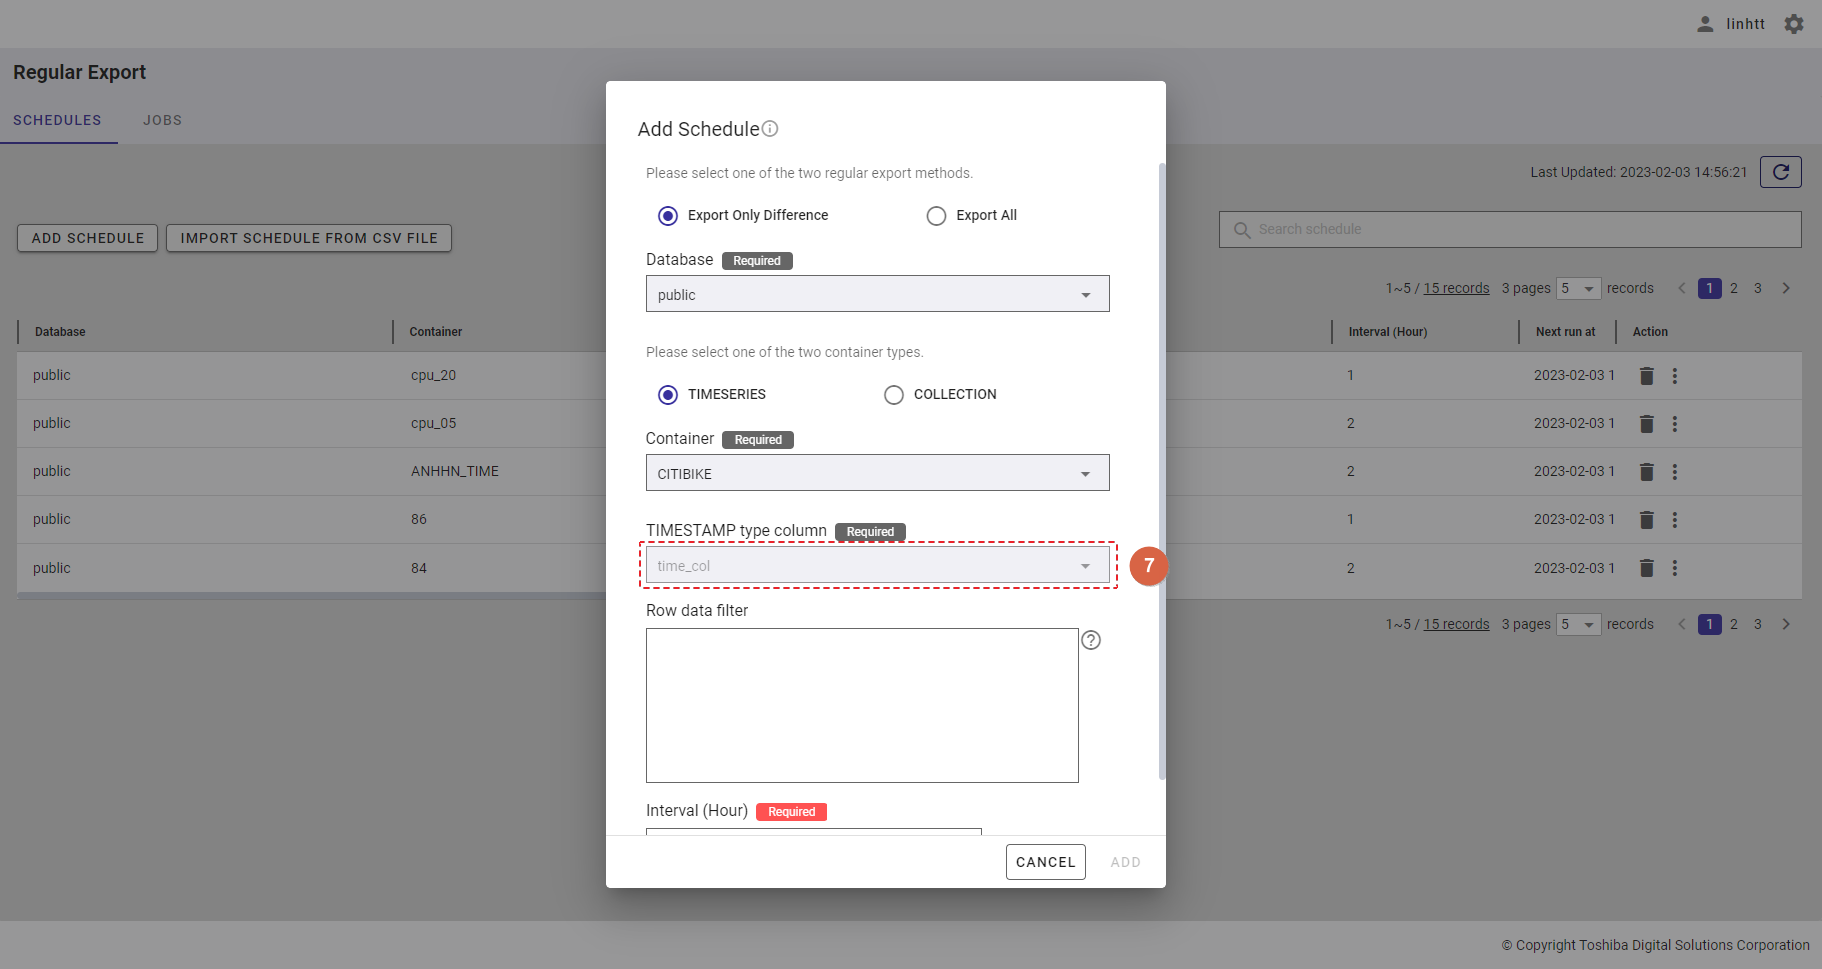
Step 5: In the [Row data filter] text field (⑧), specify a syntax used for filtering. The row data extracted using the filter will be exported.
Rows located by a search query can be exported by specifying a search query to remove rows from a container. All rows stored in a container that has not been specified in the search query will be exported.
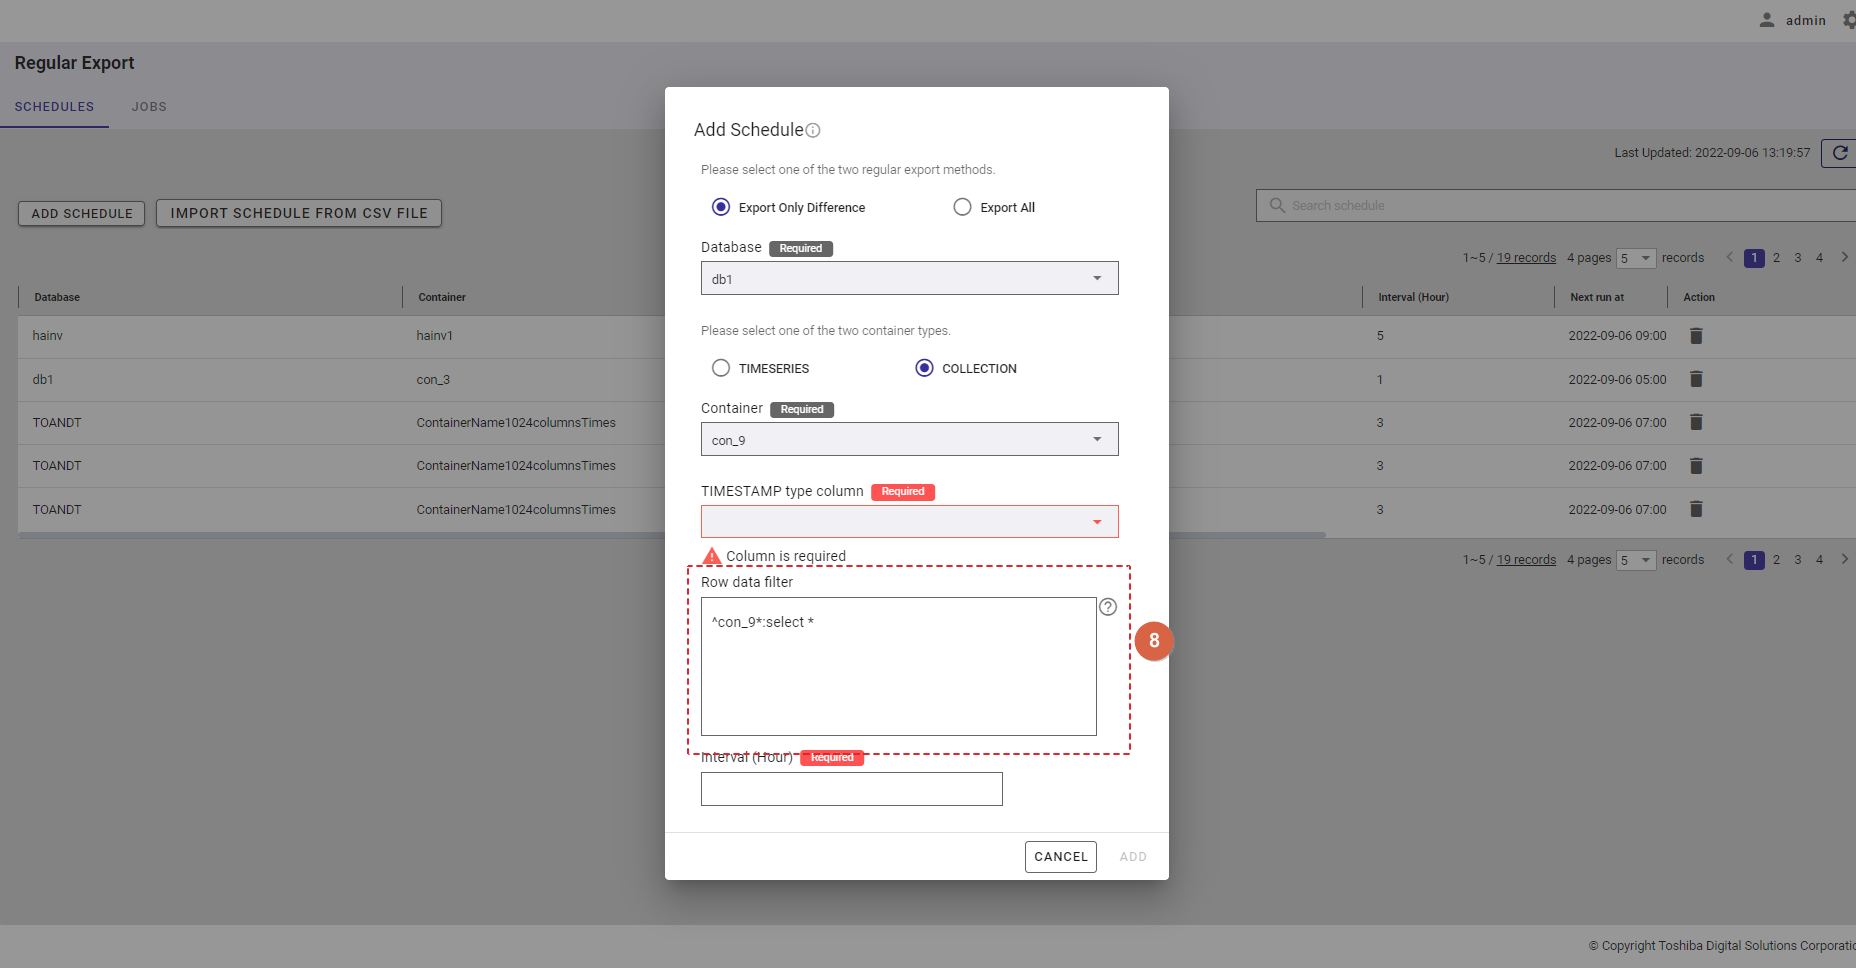
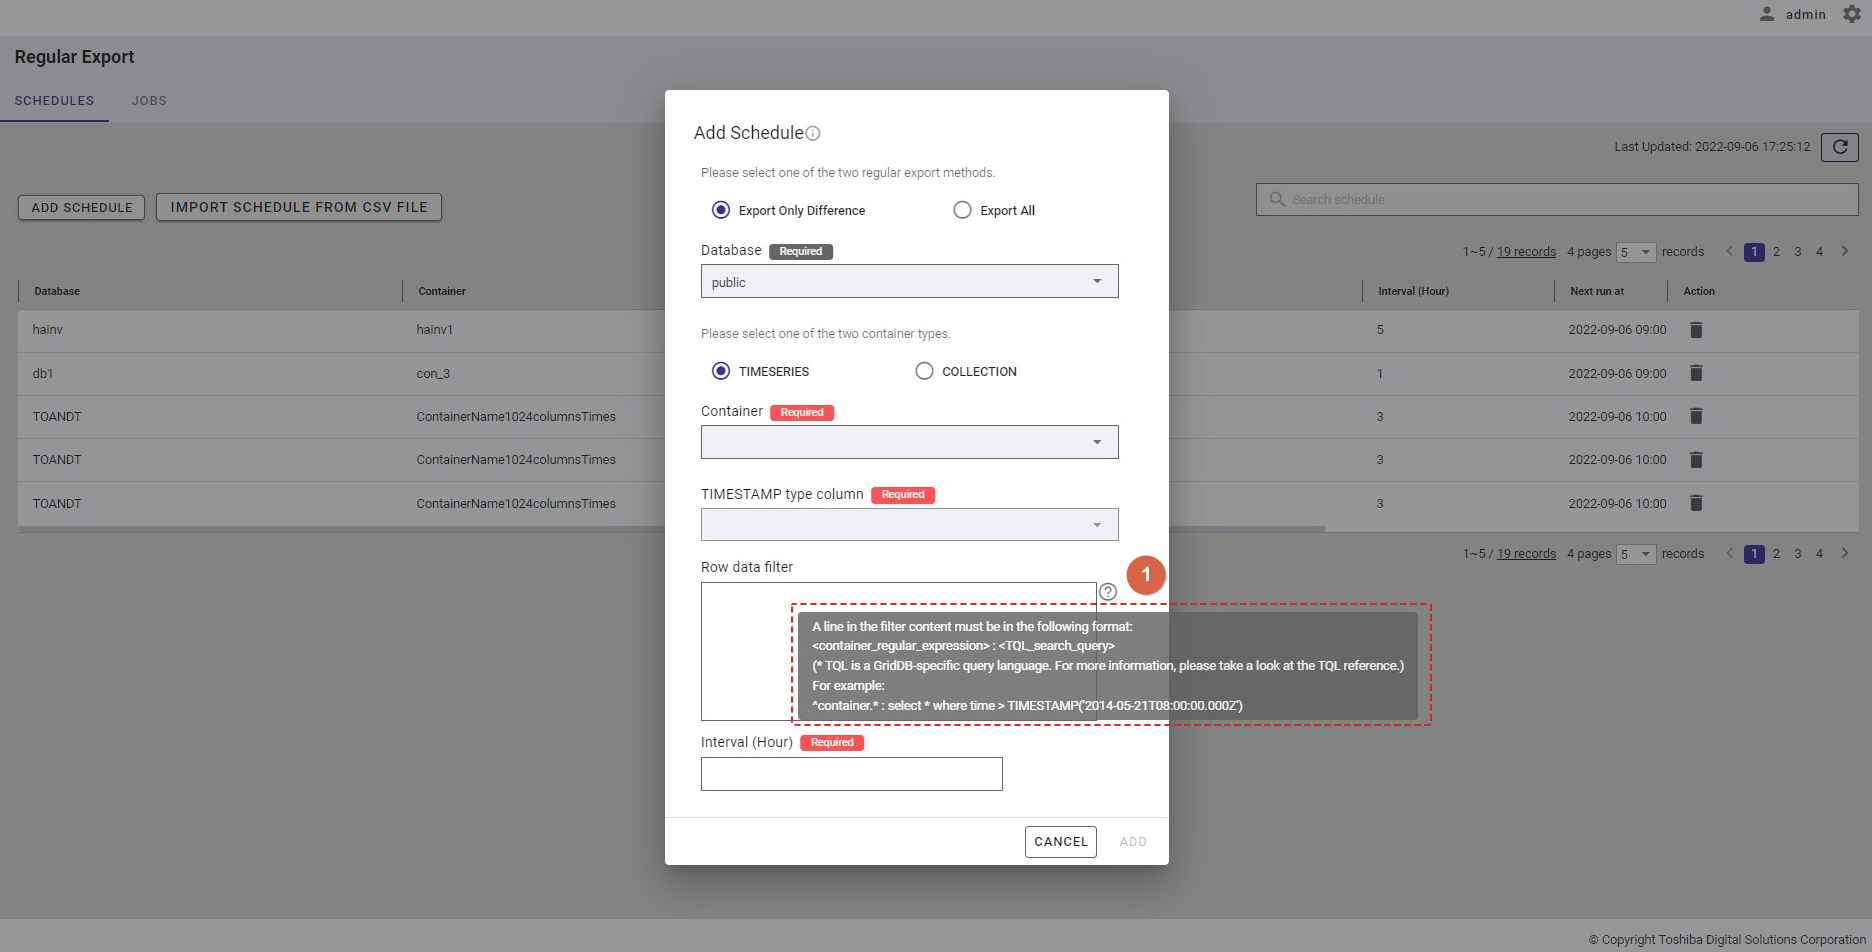
[Note]: For more details, refer to the section on how to specify a row in the GridDB Operation Tools Reference, or you can hover the mouse pointer over the [HELP] icon (①) to get an example.
Step 6: Enter the interval value between 1 and 168 in the [Interval (Hour)] text field (⑨) to set an interval for the export schedule. This is a required field.
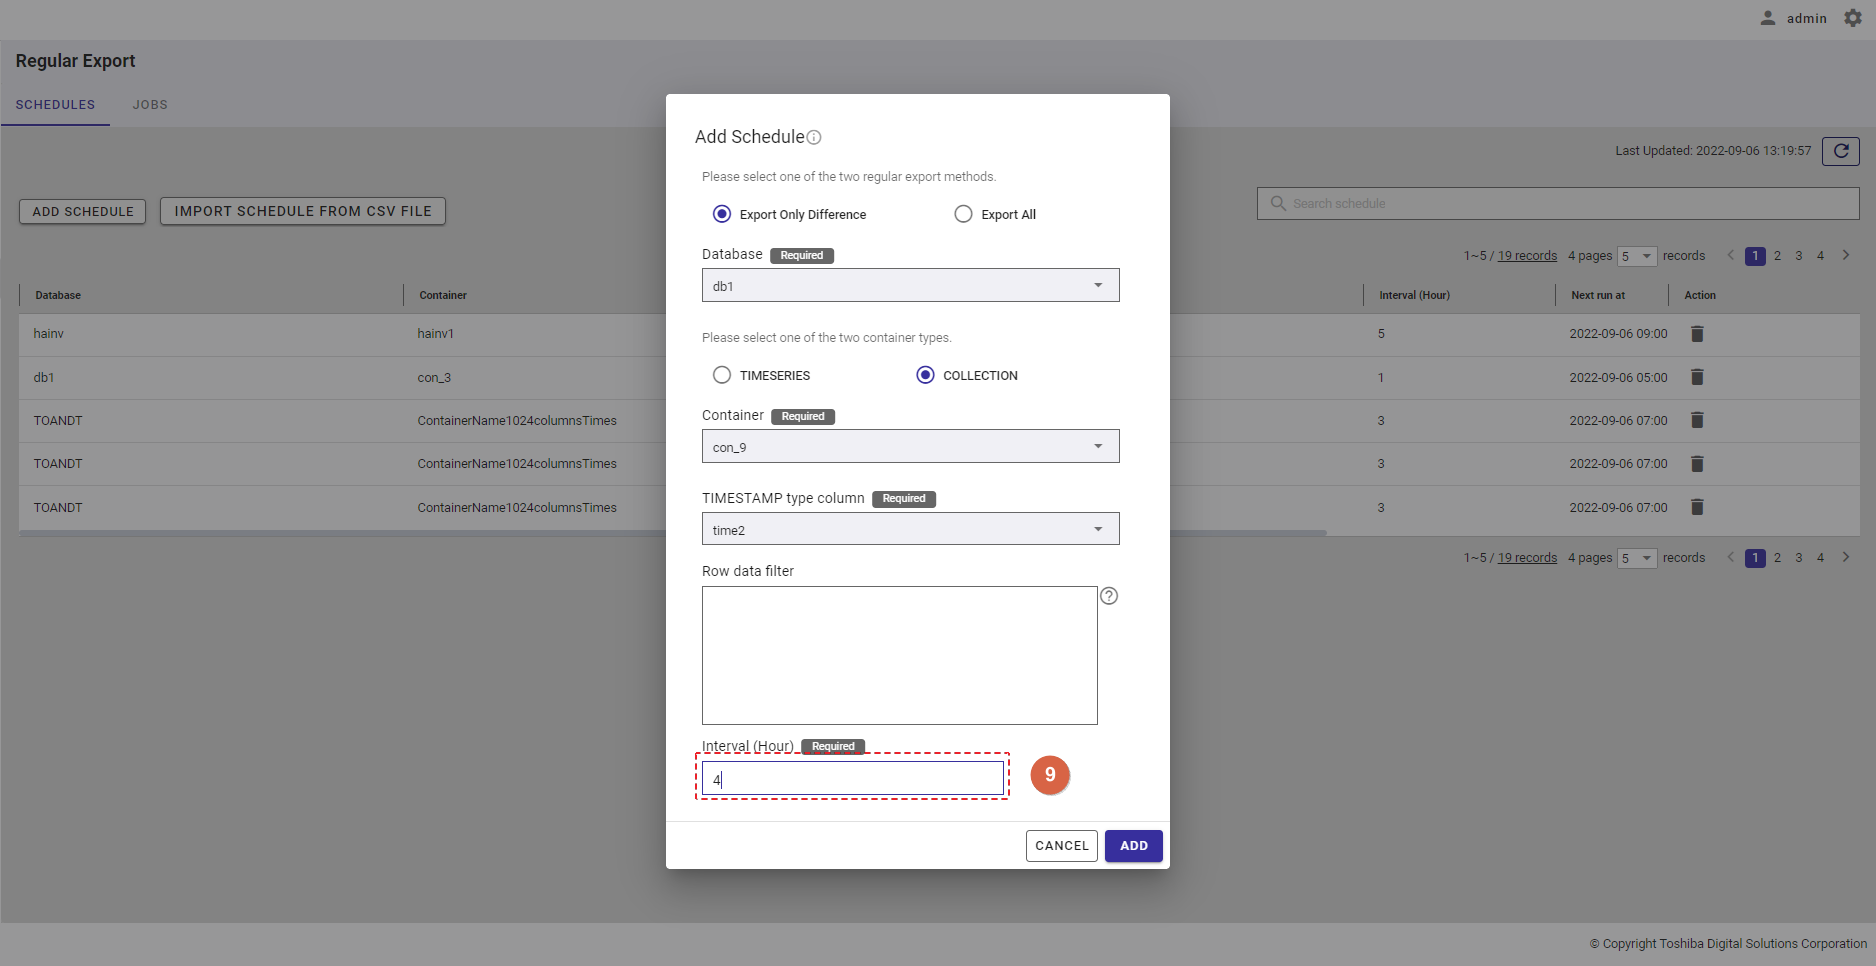
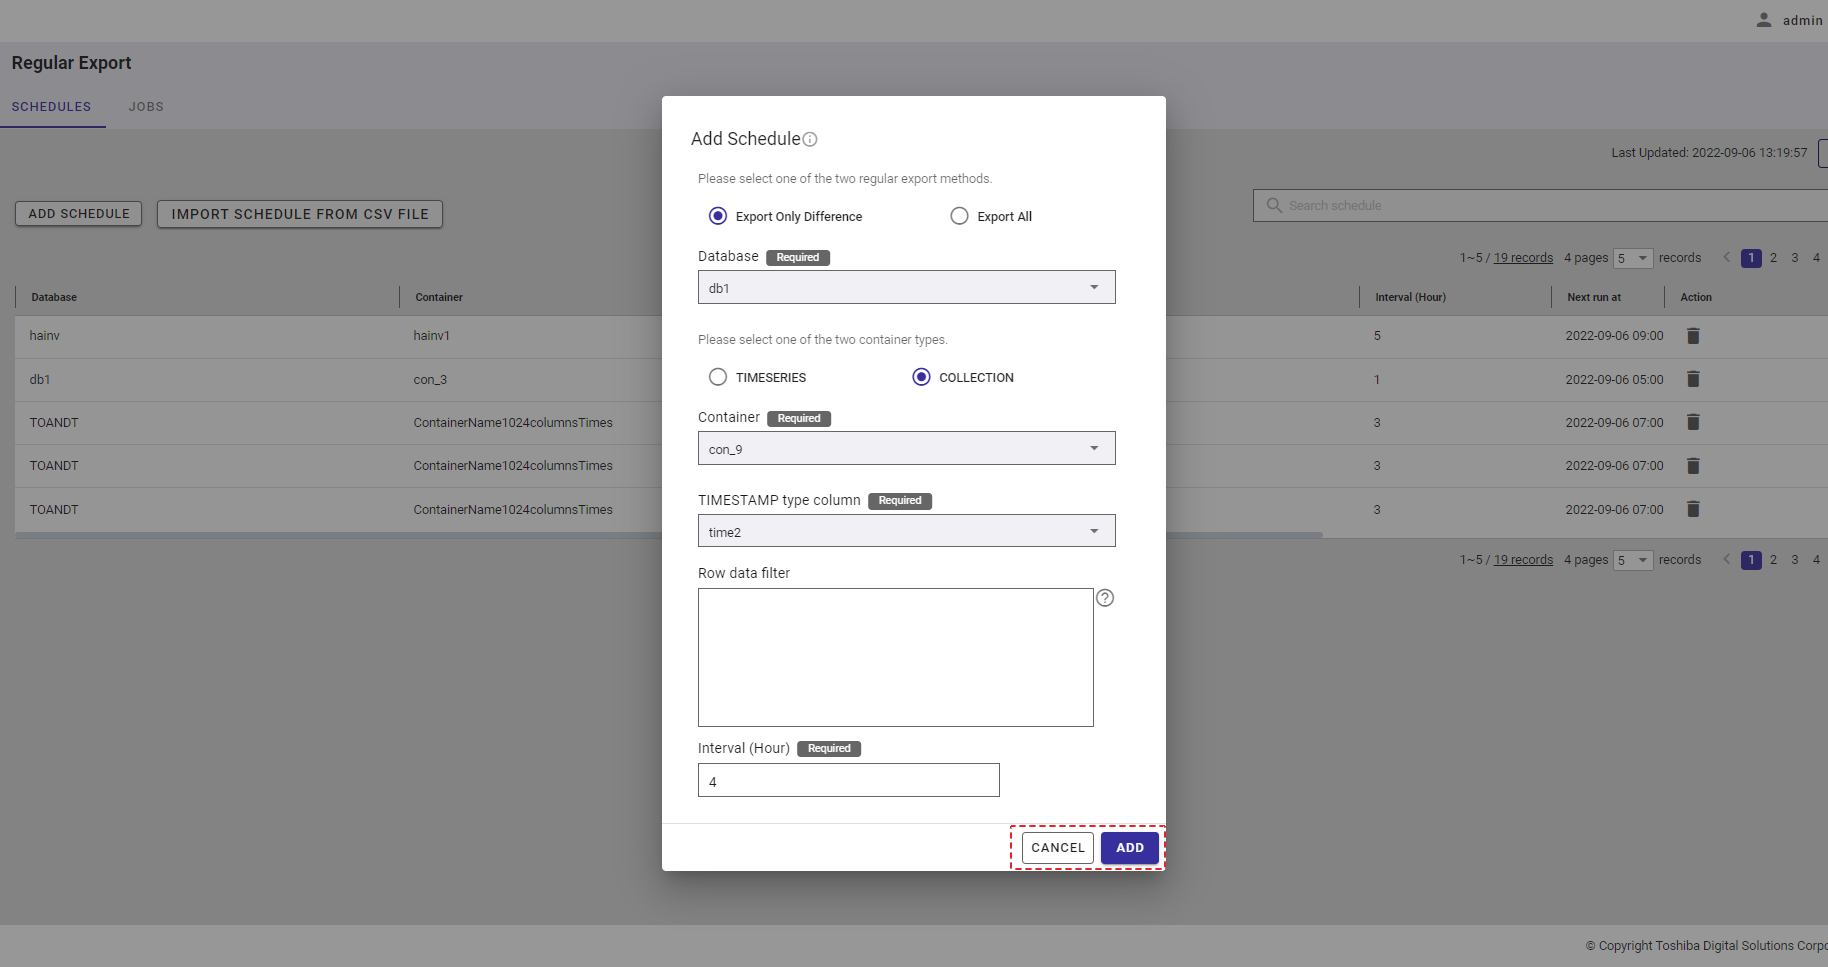
Step 7: Click the [ADD] button to add a schedule. Or click the [CANCEL] button to close the Add Schedule dialog.
4.14.3.2 Adding a regular export schedule to export all data
Step 1: To add a schedule, click the [ADD SCHEDULE] button.
Step 2: Select the [Export All] radio button (①). Then, select a database that includes containers to export from the [Database] drop-down list (②). Only one database can be selected. You can also enter the database name in the text box to search for a database name you want to select.
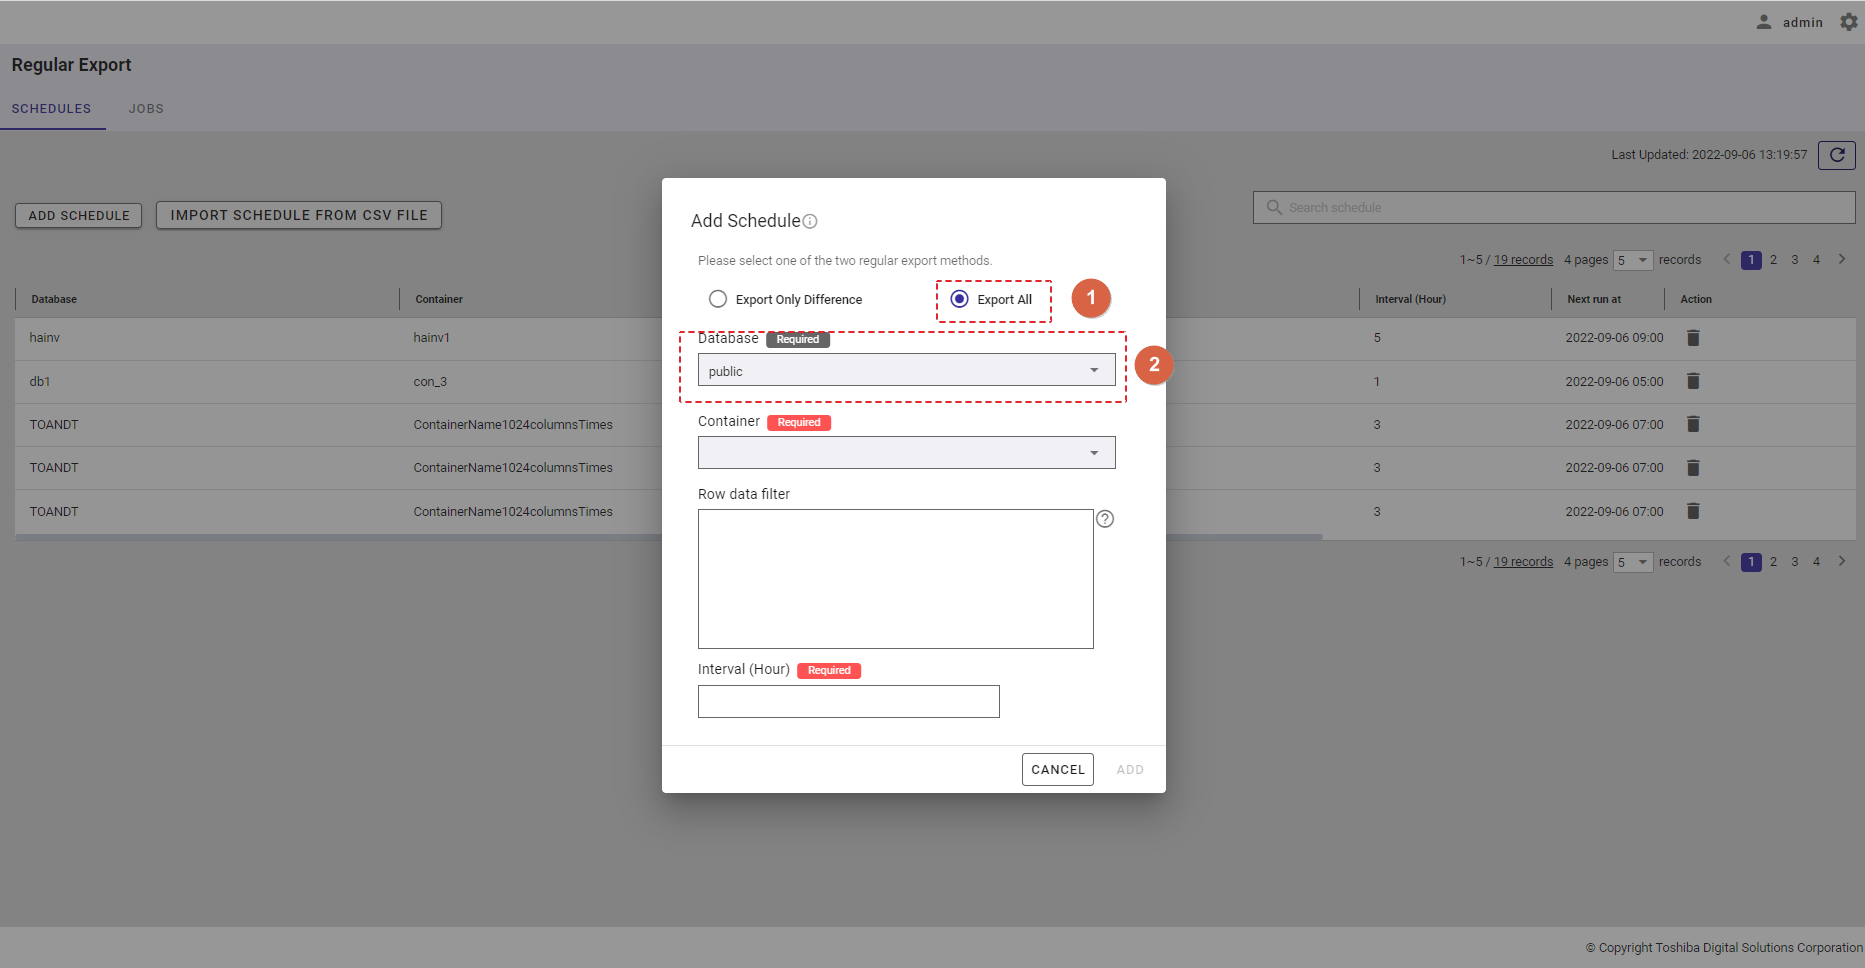
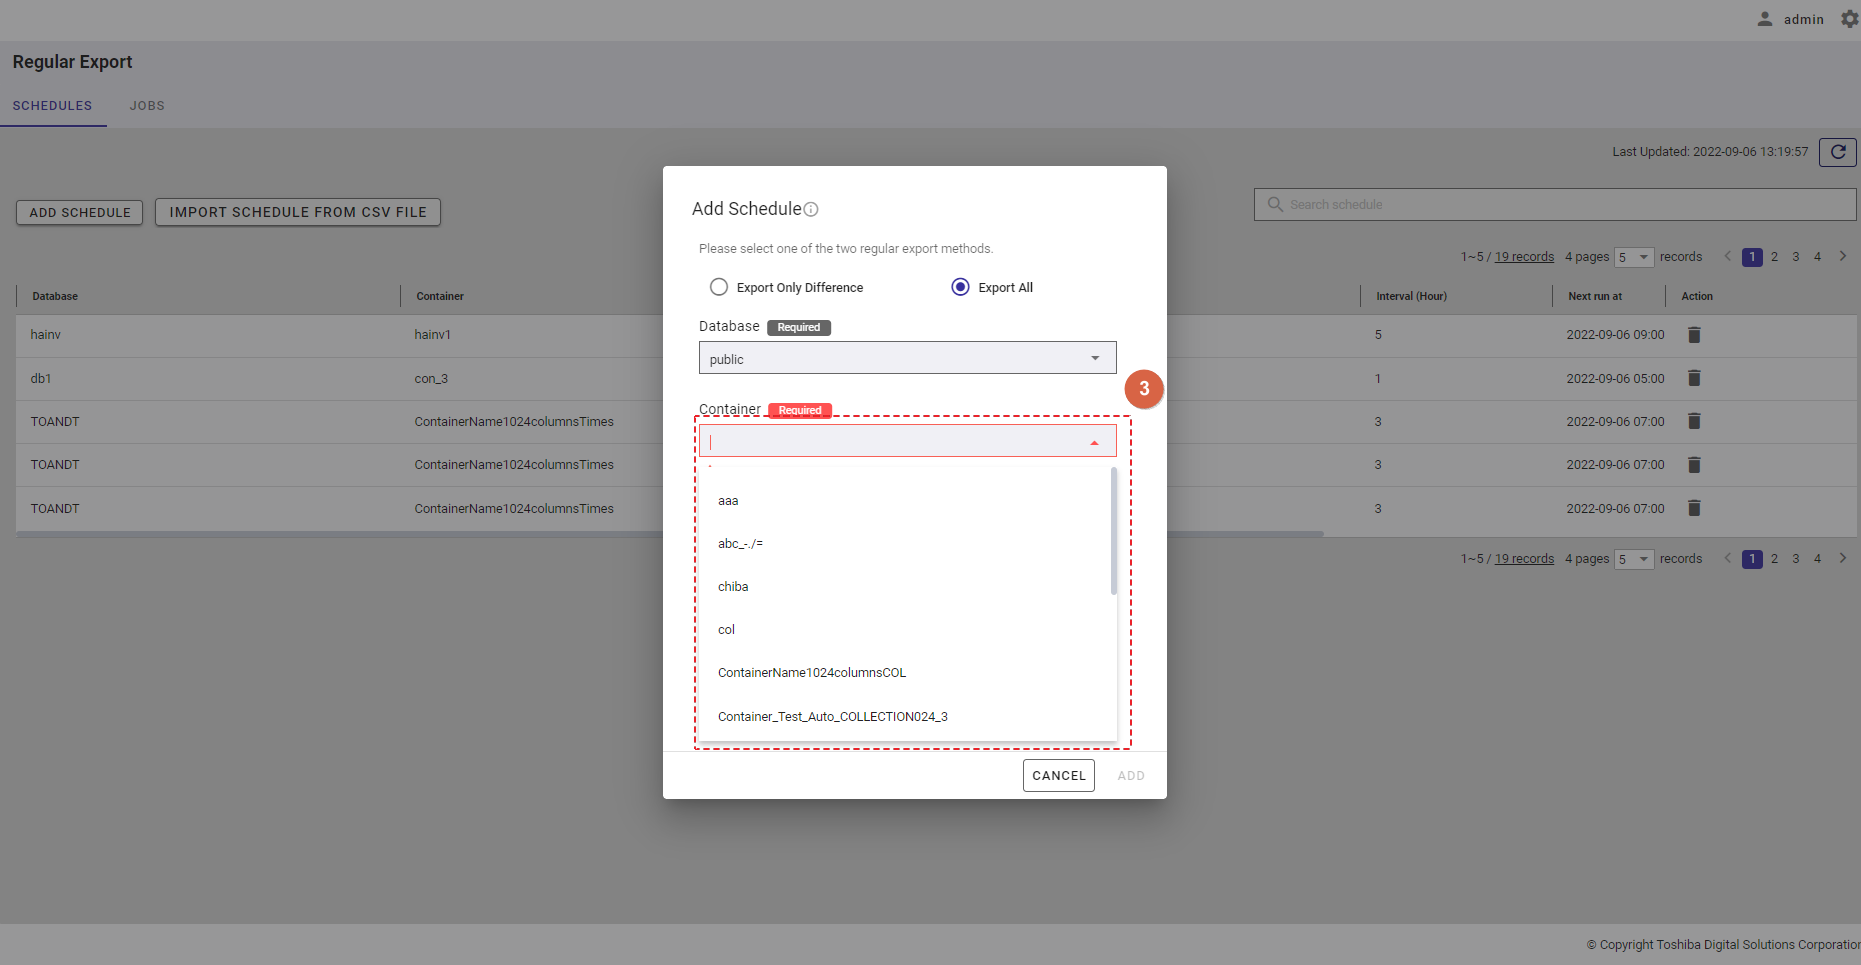
Step 3: Select a container from the [Container] drop-down list (③). Only one container can be selected. You can also enter the container name in the text box to search for a container name you want to select.
Step 4: In the [Row data filter] text field (④), specify a syntax used for filtering. The row data extracted using the filter will be exported.
Rows located by a search query can be exported by specifying a search query to remove rows from a container. All rows stored in a container that has not been specified in the search query will be exported.
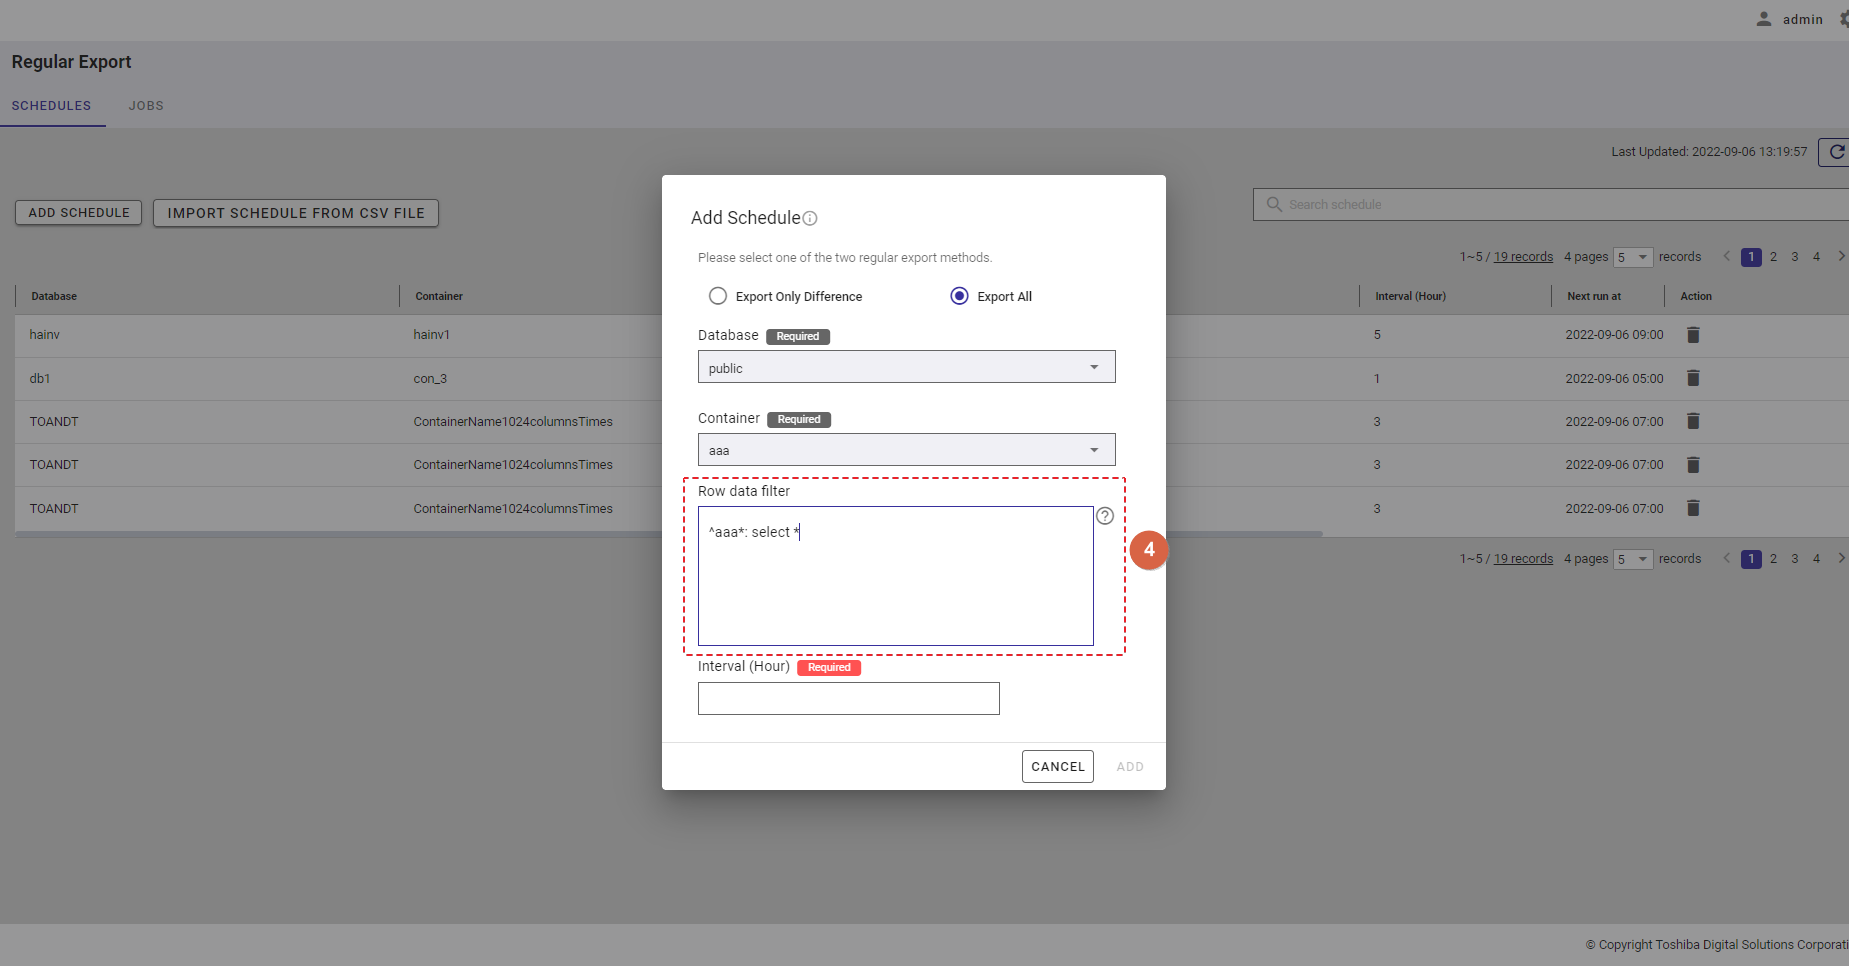
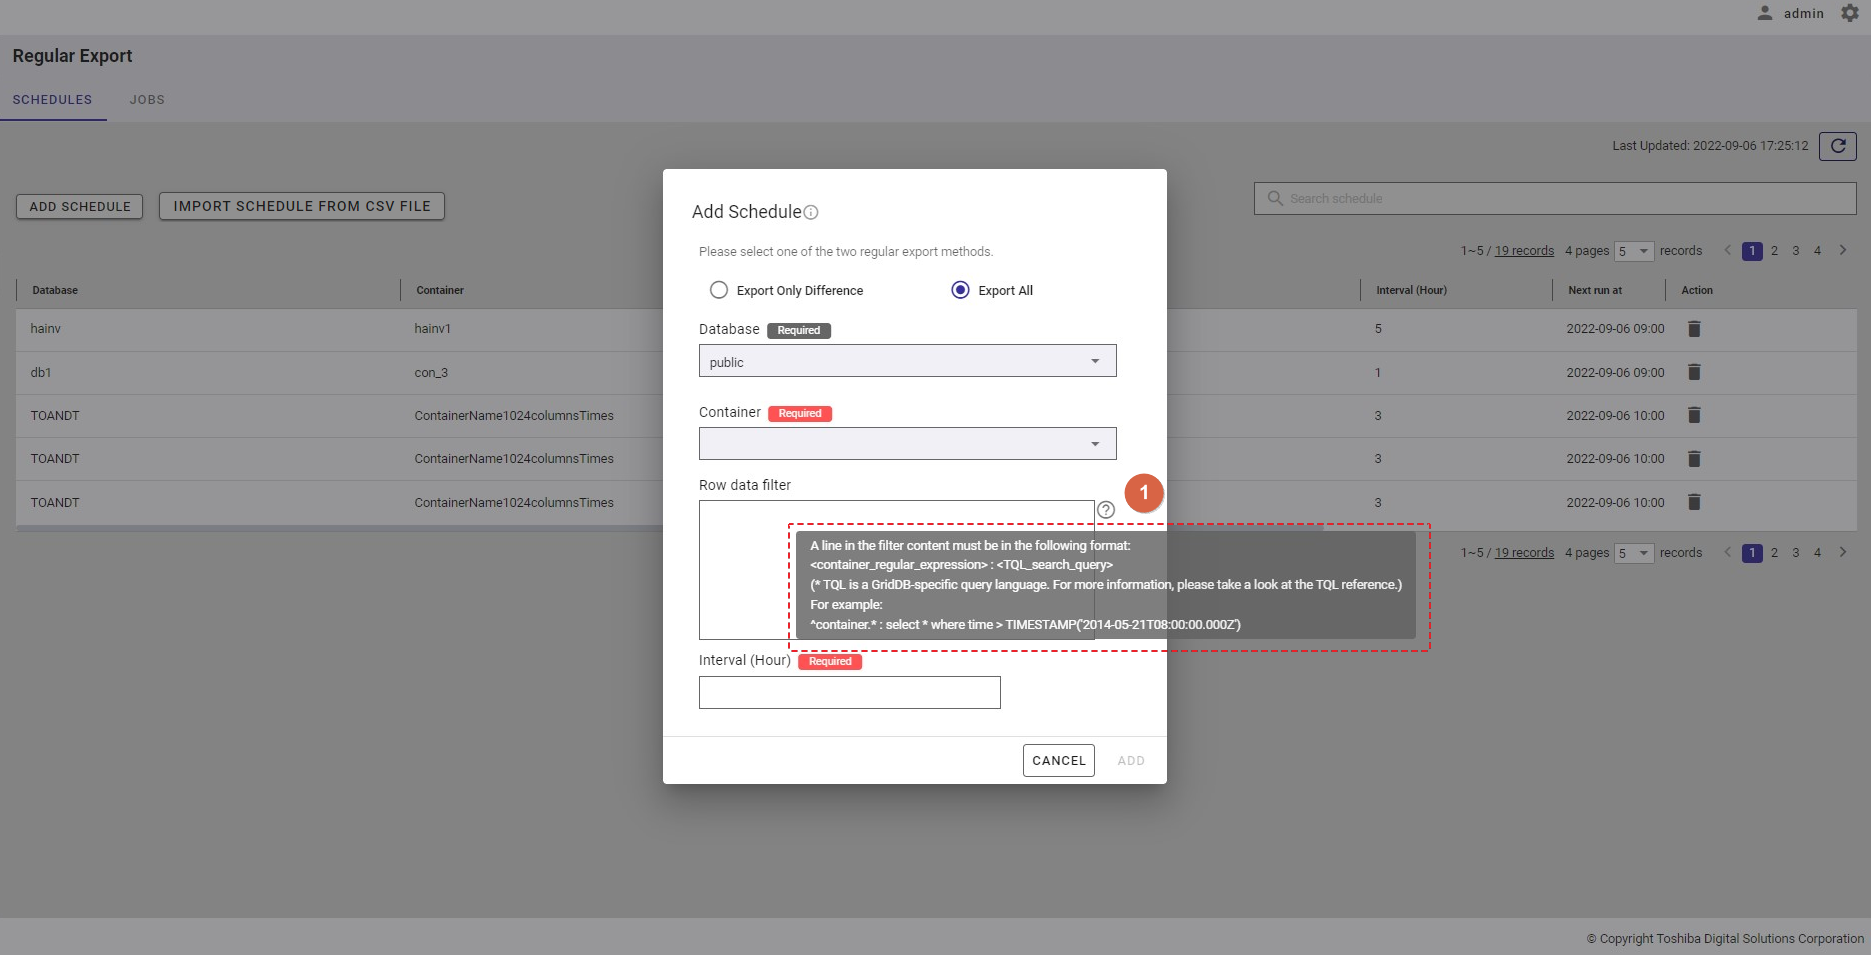
[Note]: For more details, refer to the section on how to specify a row in the GridDB Operation Tools Reference, or you can hover the mouse pointer over the [HELP] icon (①) to get an example.
Step 5: Enter the interval value between 1 and 168 in the [Interval (Hour)] text field (⑤) to set an interval for the export schedule.
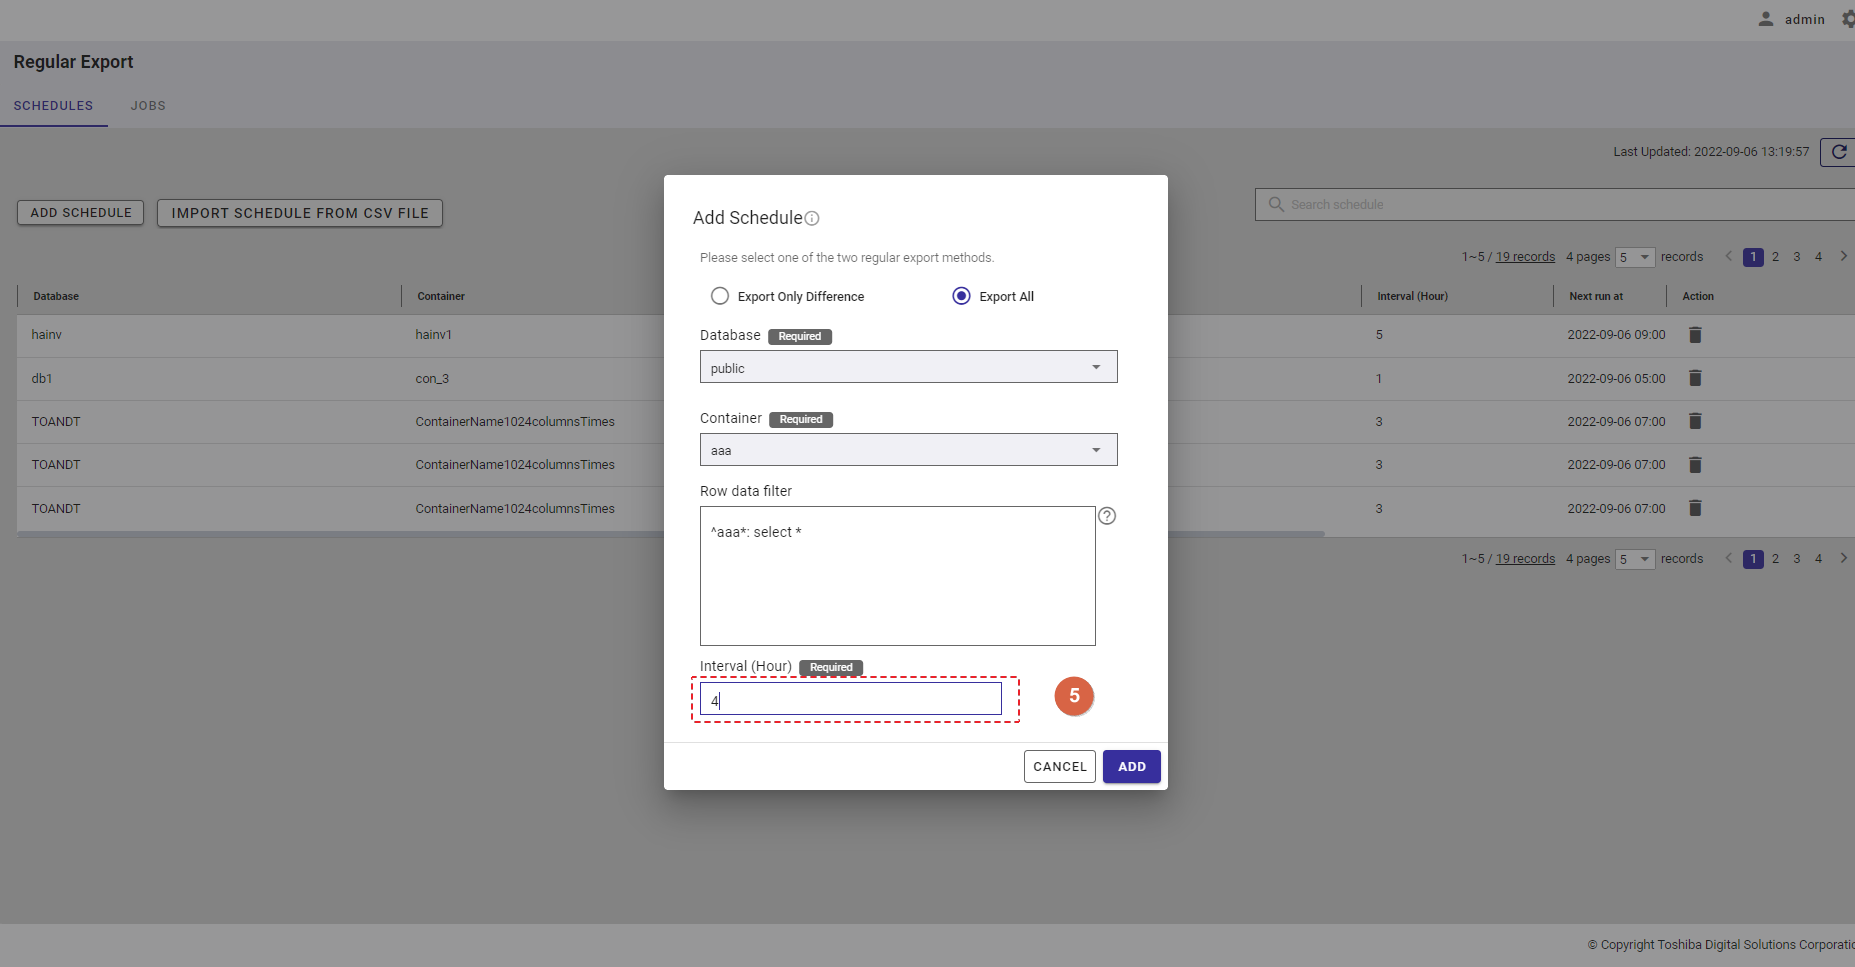
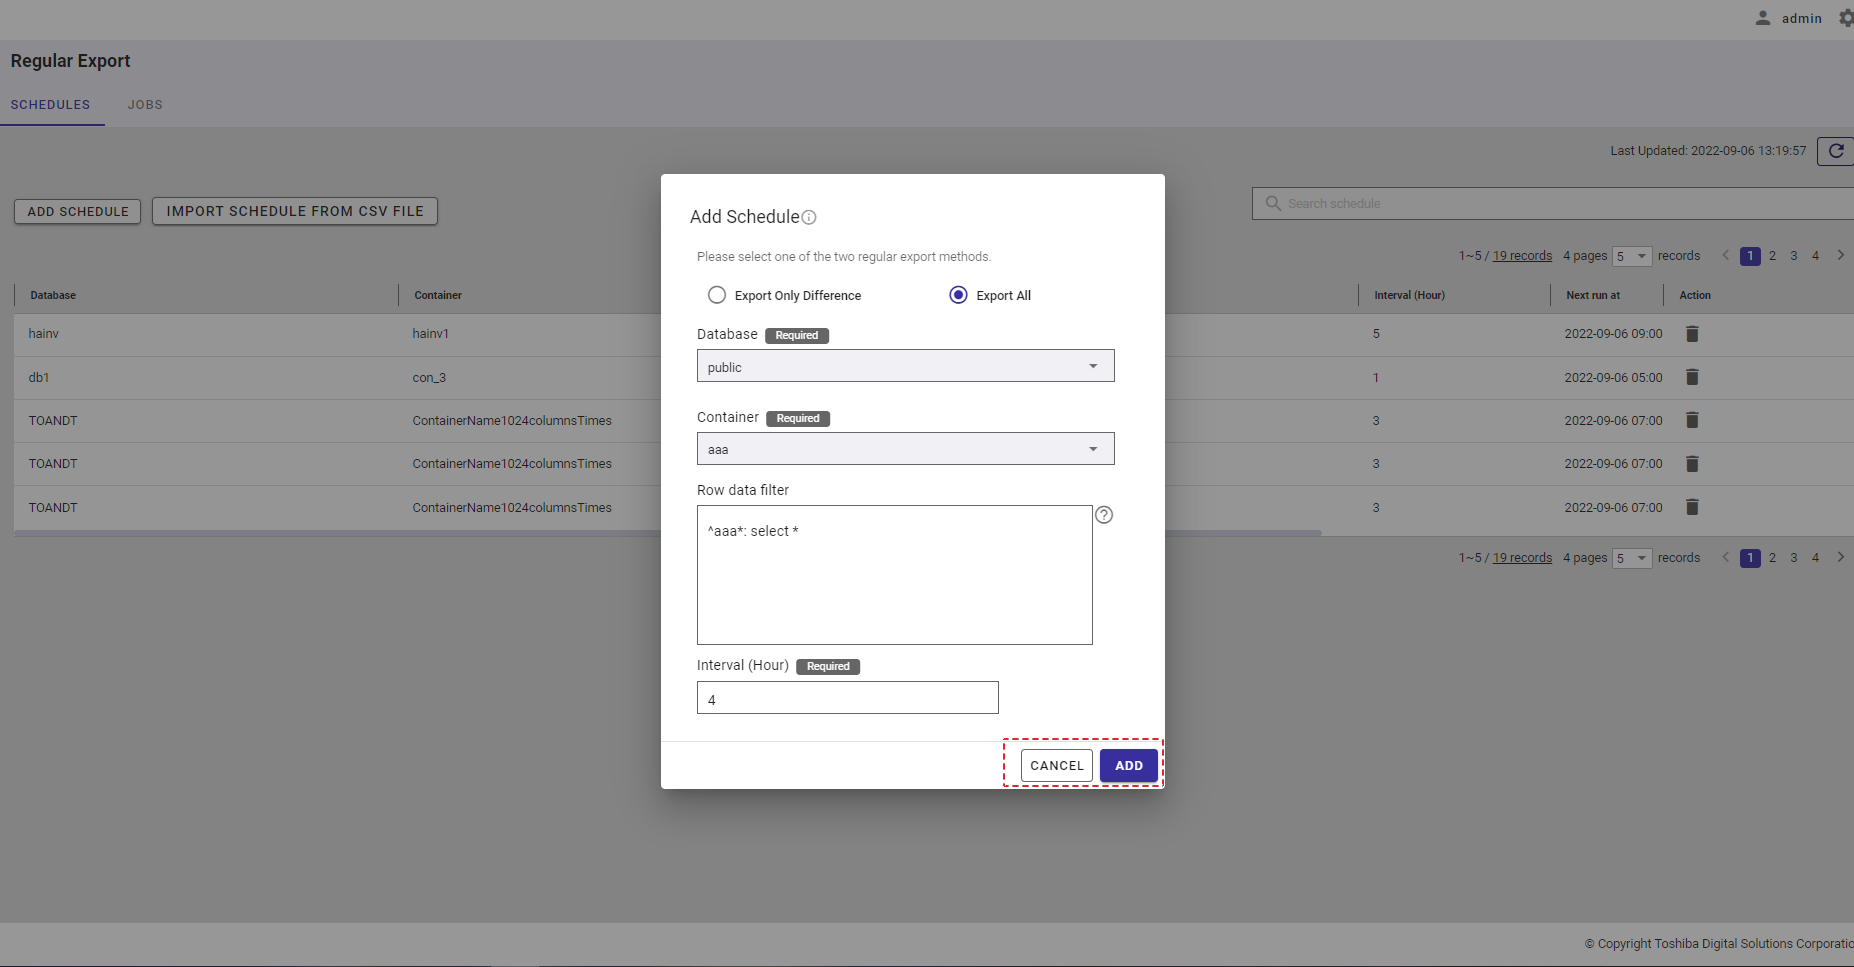
Step 6: Click the [ADD] button to add a schedule. Or click the [CANCEL] button to close the Add Schedule dialog.
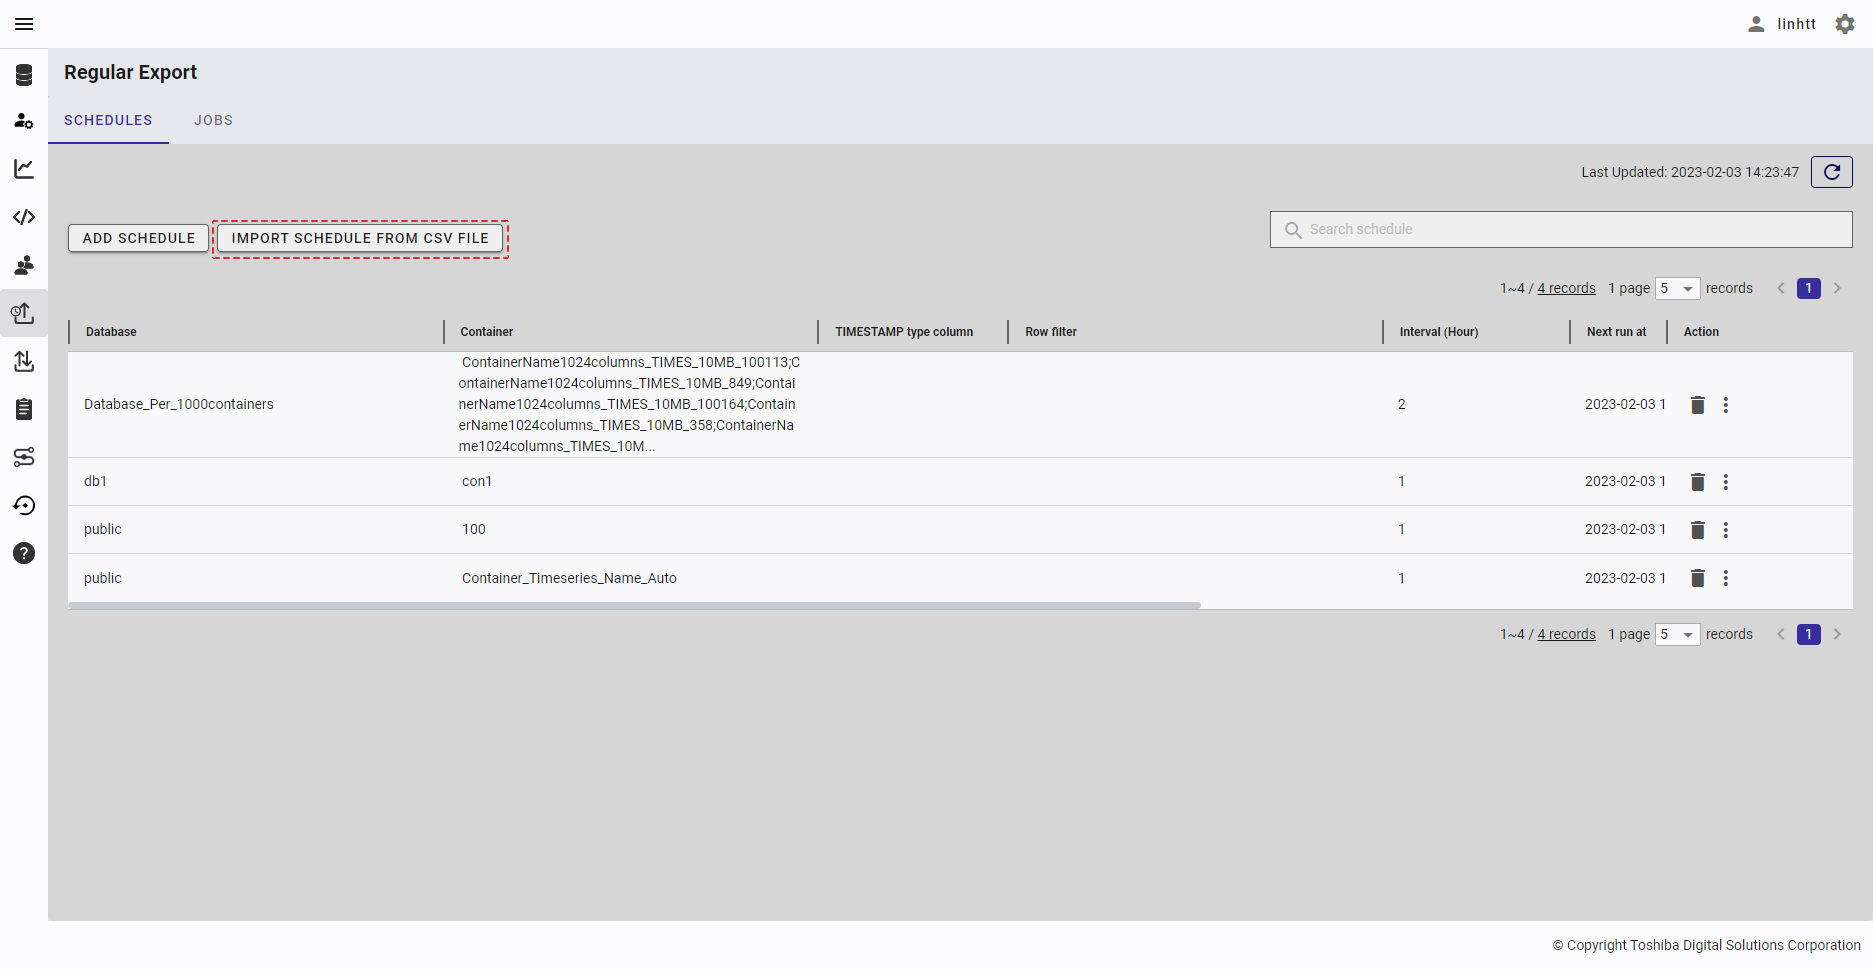
4.14.4 Importing a schedule from a CSV file
[Note]: You can specify multiple containers in a schedule only when importing a schedule by uploading a CSV file. You cannot specify multiple containers when adding a schedule in the 'Add Schedule' dialog (See Adding a regular export schedule).
Step 1: To import a schedule from a CSV file, click the [IMPORT SCHEDULE FROM CSV FILE] button.
Step 2: When the [Import schedule from CSV file] dialog is displayed, enter the file required in the input field (①). You can click the [CSV file conditions] tab (②) to show/hide the conditions for the import file. You can download the CSV template file from here by clicking the download icon.
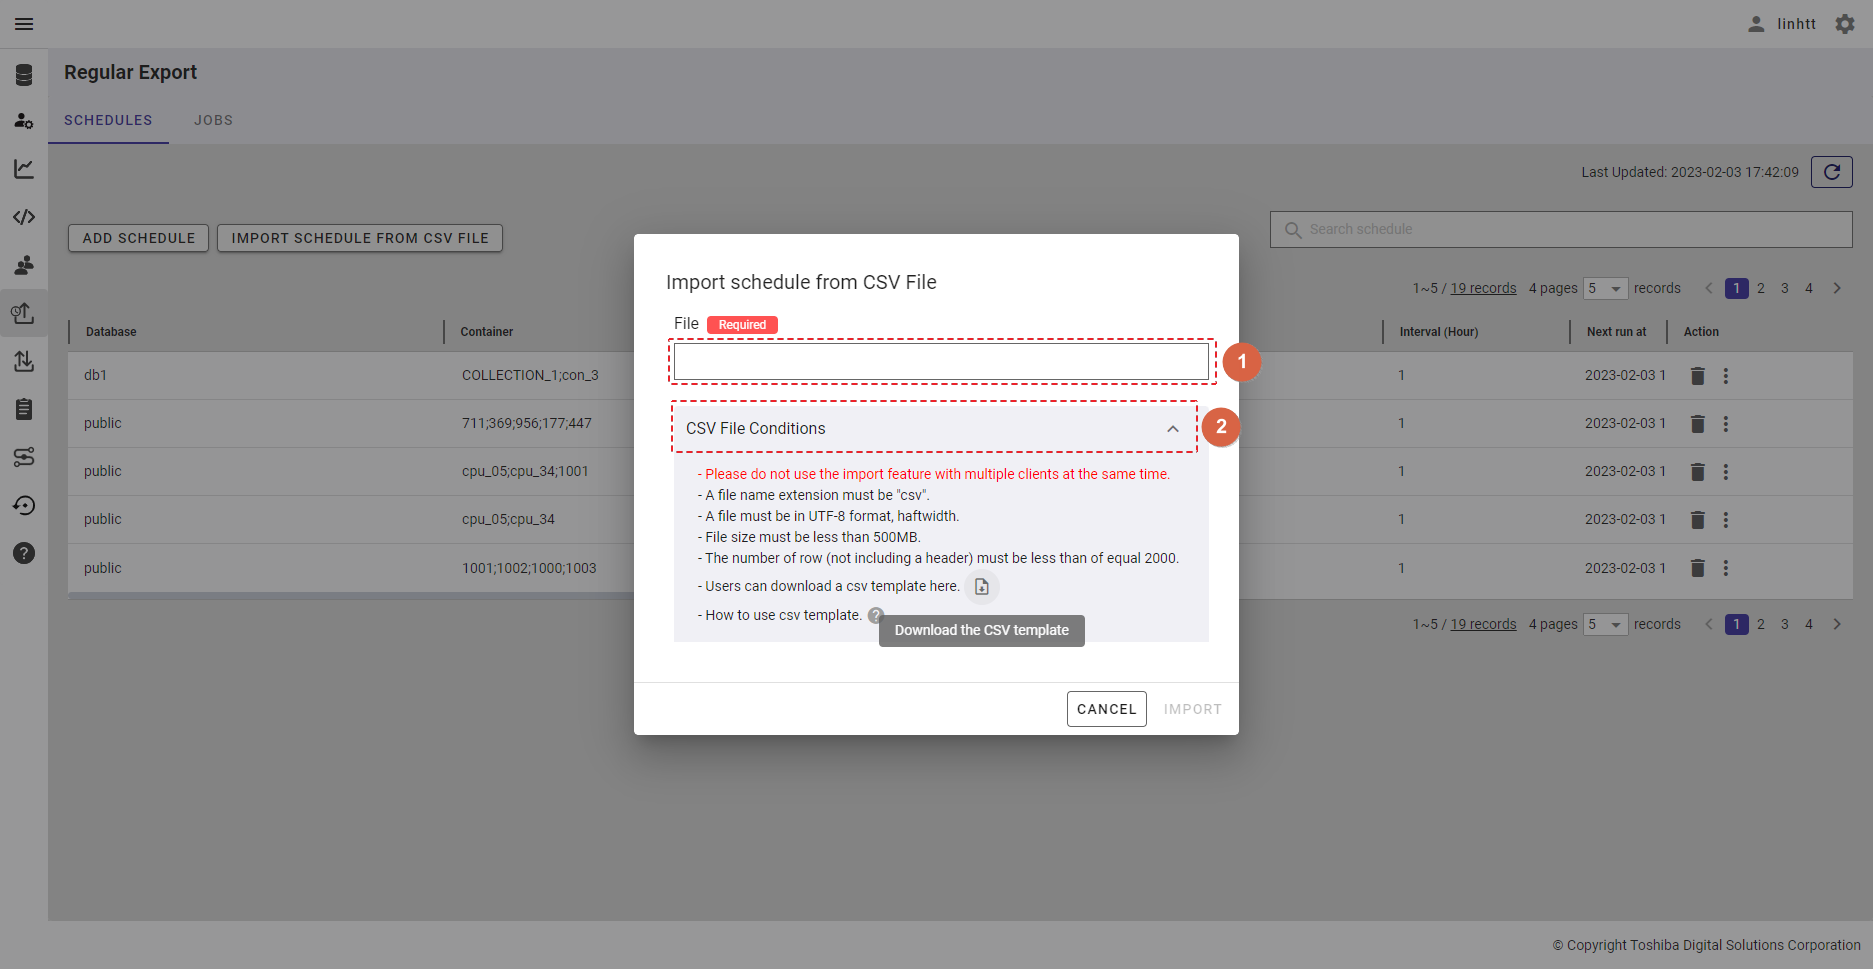
Step 3: Then, click the [IMPORT] button to import a schedule from a CSV file. If you do not want to import a schedule from a CSV file, click the [CANCEL] button to close the dialog and return to the schedule list screen.
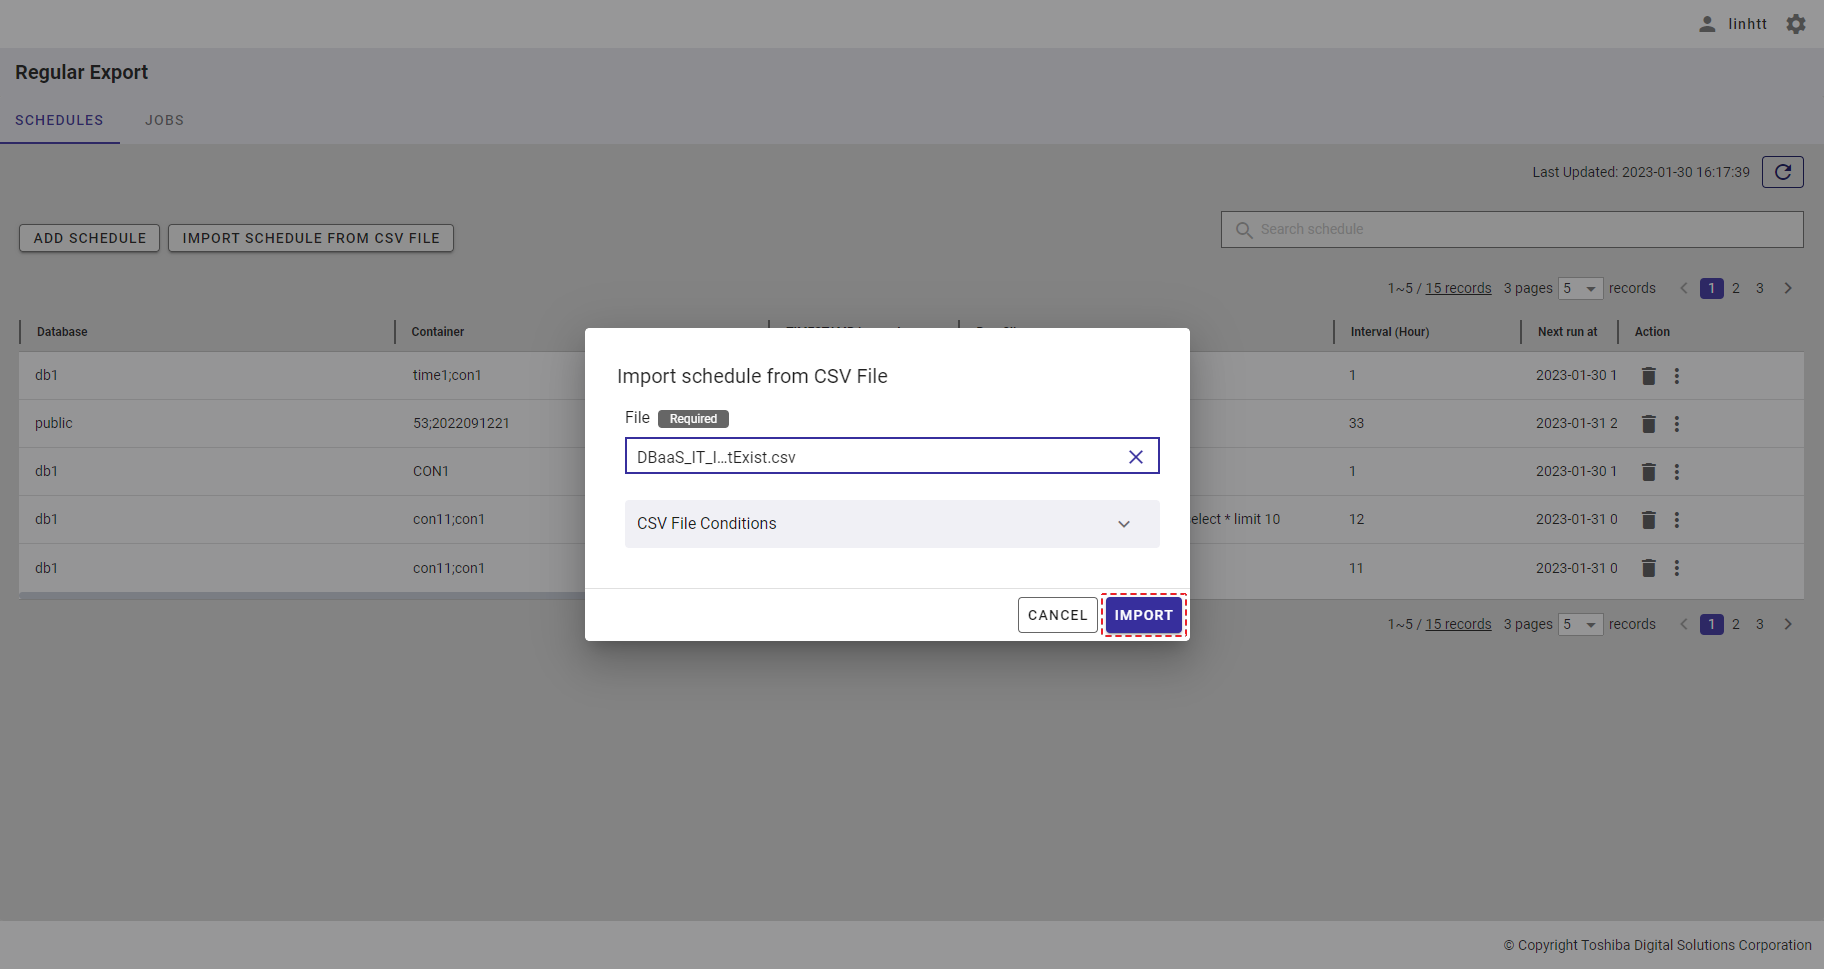
The [Import result] dialog below displays the import status after importing a schedule from a CSV file. If the status is 'Success,' the [DOWNLOAD ERROR] button will be disabled.
If the status is 'Failed,' the [DOWNLOAD ERROR] button will be enabled. Click the [DOWNLOAD ERROR] button to download a csv file detailing the causes of the failure.
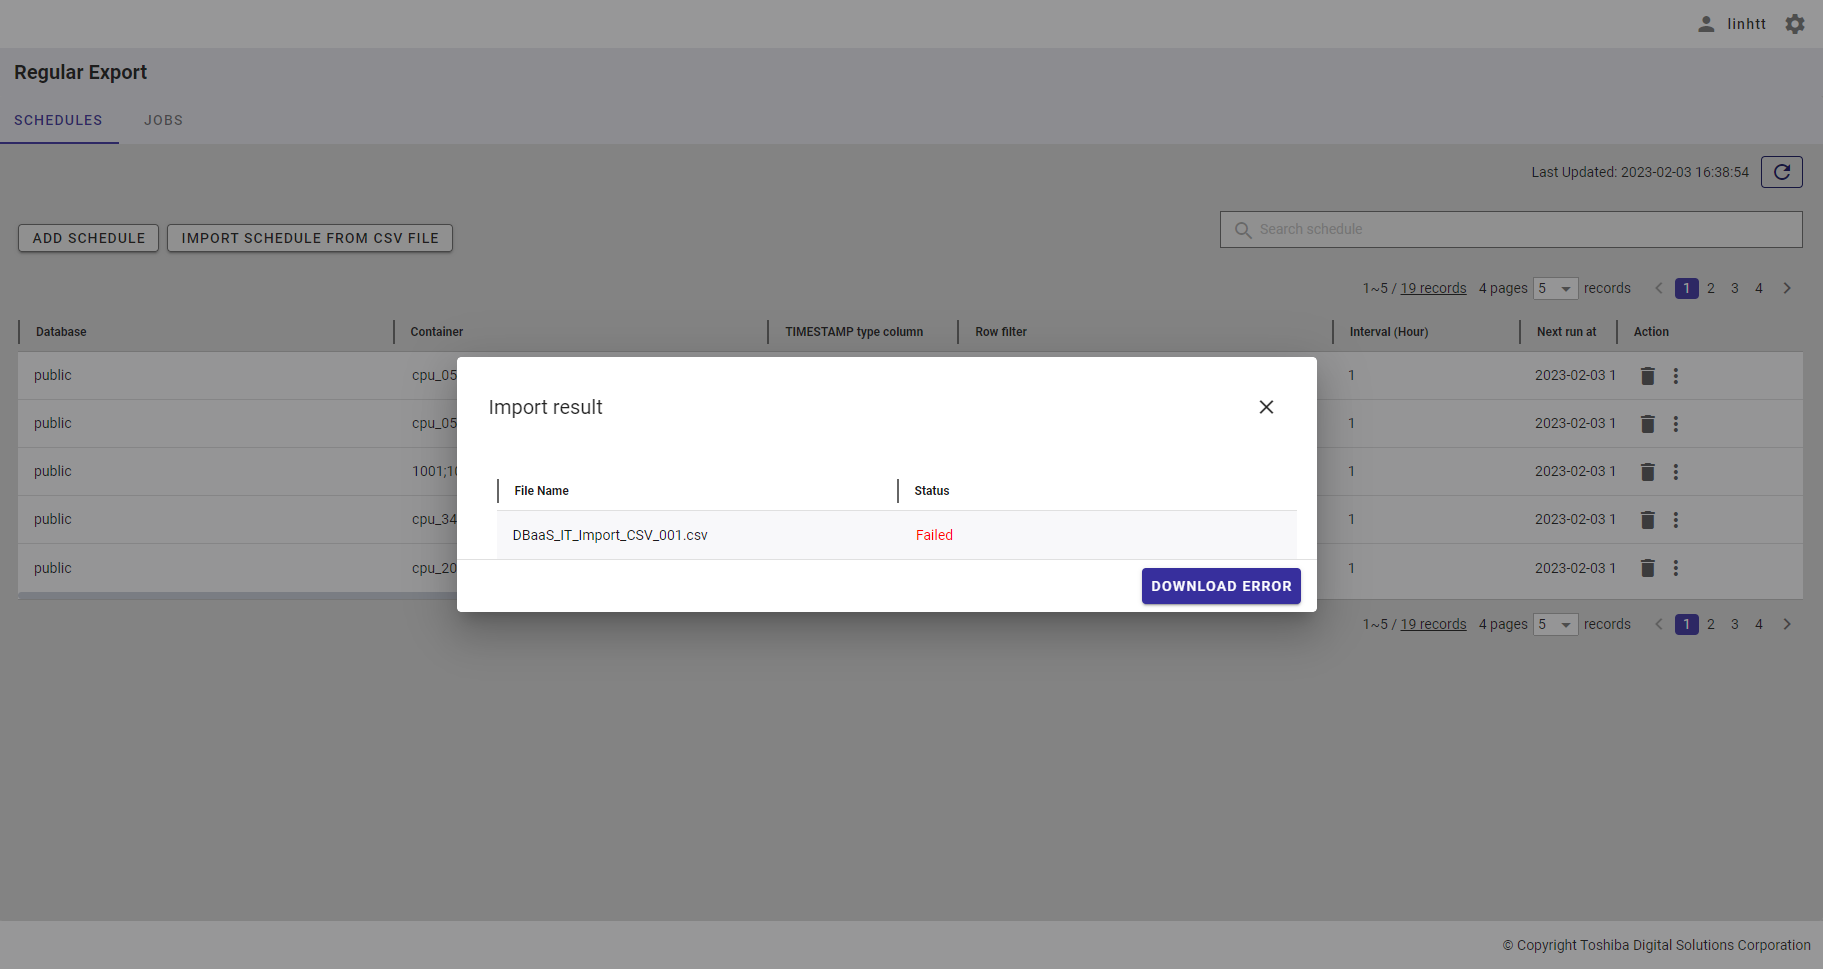
4.14.5 Deleting regular export schedules
This function deletes regular export schedules.
Step 1: To delete a regular export schedule, click the [DELETE] button on the right of the regular export schedule item.
Step 2: Once the confirmation dialog is displayed, click the [YES] button to continue to delete the regular export schedule. Or click the [NO] button to go back to the regular export schedule screen without deleting the regular export schedule.
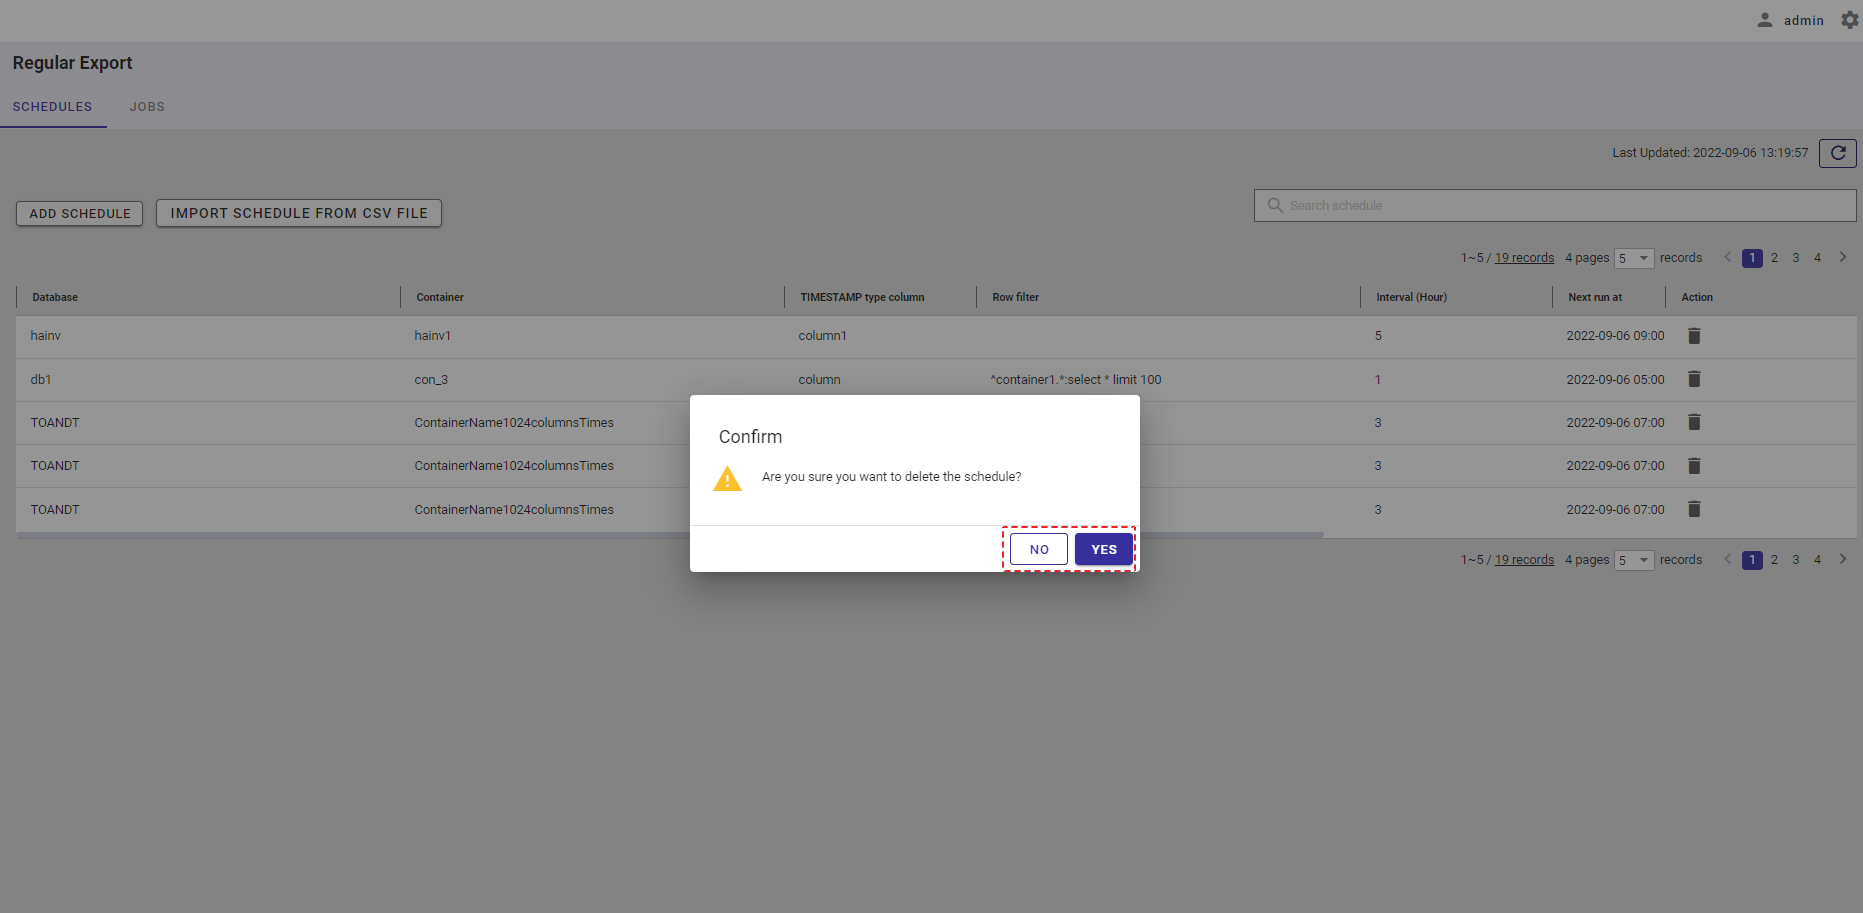
When the regular export schedule is successfully deleted, the system will go back to the regular export schedule screen where the deleted regular export schedule is not found.
4.14.6 Viewing schedule detail
Step 1: To view the detail of a schedule, click the three vertical dots (①) in the 'More Options' menu and then click the [View detail] button (②) on the right of the schedule item.
Step 2: The [View row data detail] screen will appear.
You can choose the number of records displayed on one page by selecting the number from [5, 10, 15, All] (①) at the top or bottom of the page. Click the [Next] button (②) or the [Back] button (③), or click the page number (④) to view another page.
You can sort the list of row data by container, by TIMESTAMP type column, by row filter, or by export method, by clicking the header (⑤) of each column.
You can adjust the column size by dragging and dropping the vertical bar "|" on the header.
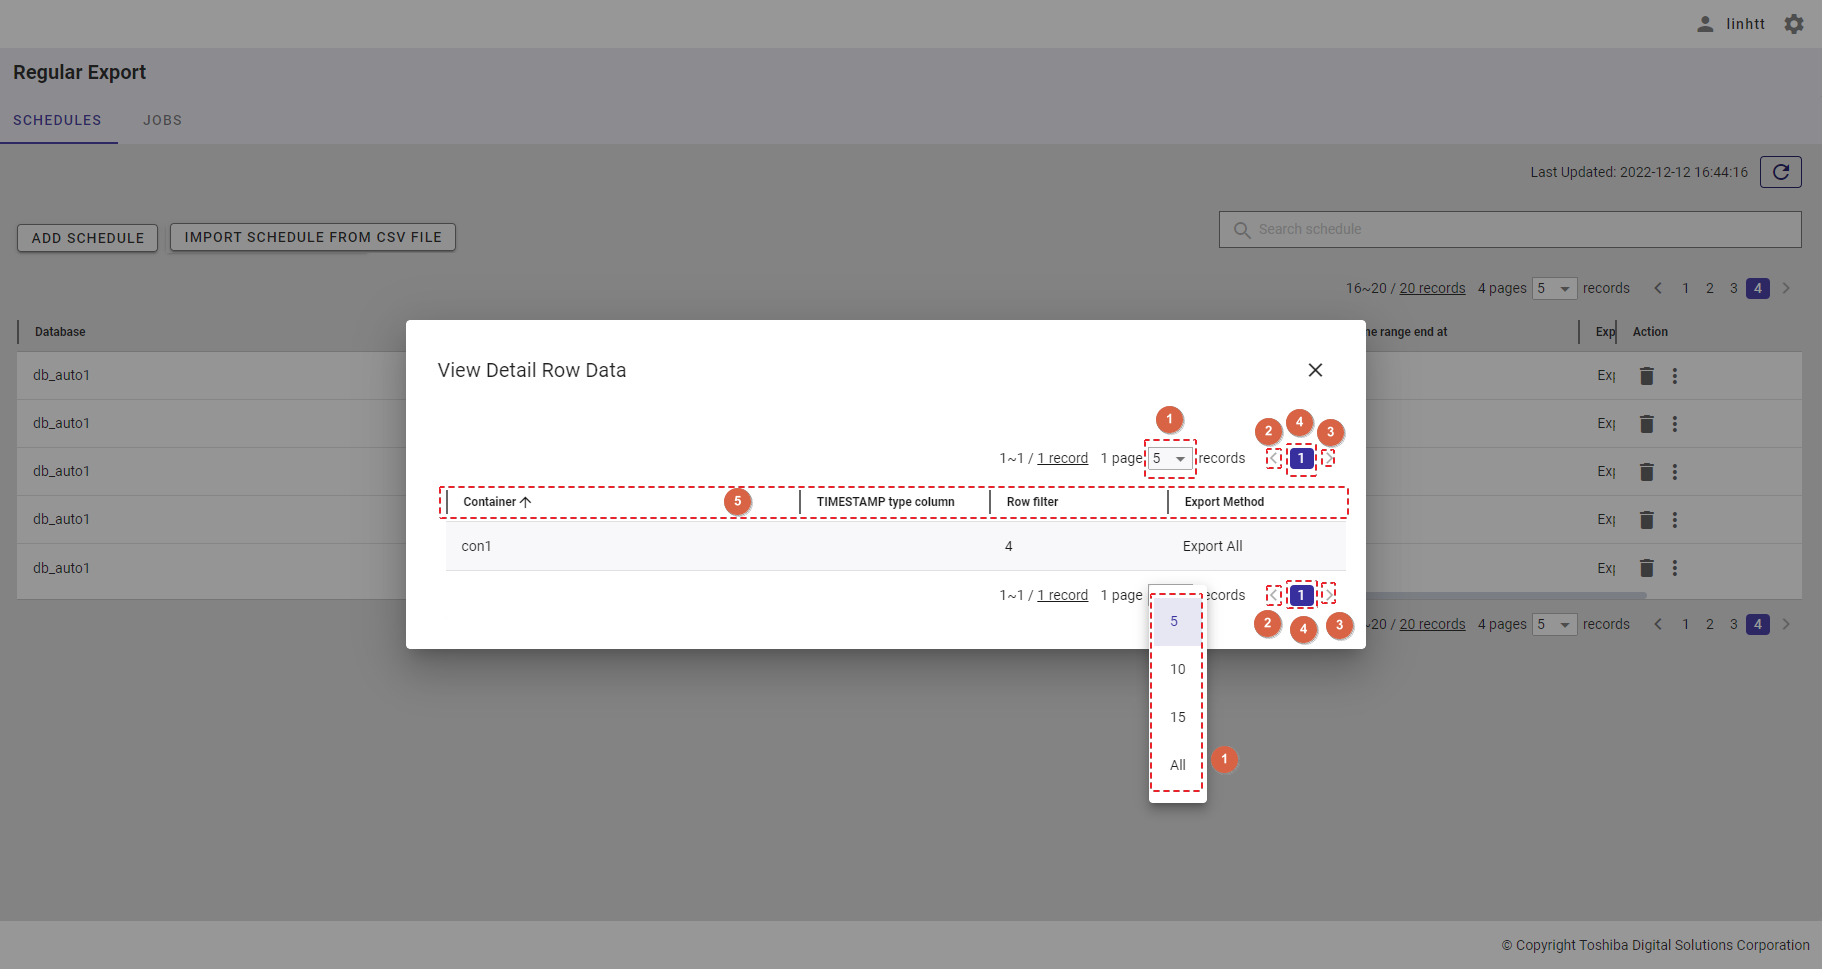
4.15 Regular export job function
This function is used for managing regular export jobs. Jobs are created automatically according to a specified export schedule; they can also be created manually using this function.
4.15.1 Available roles
In the table below, the role with a plus sign (+) can use the function on the left.
| No. | Function | General user | Administrator user |
|---|---|---|---|
| 1 | Display a list of regular export jobs | + | + |
| 2 | Set the expiration period | + | + |
| 3 | Add a job | + | + |
| 4 | Delete a job | + | + |
| 5 | Delete multiple jobs | + | + |
| 6 | Retry a job | + | + |
| 7 | Stop a job | + | + |
| 8 | View results | + | + |
| 9 | View job detail | + | + |
| 10 | Storage access information | + | + |
4.15.2 Displaying a list of regular export jobs
This function displays a list of regular export jobs.
To access the Regular Export Jobs screen, first you must log in to the system and then click the item [Regular Export] (①) in the left panel.
Then click the [JOBS] tab at the top of the screen.
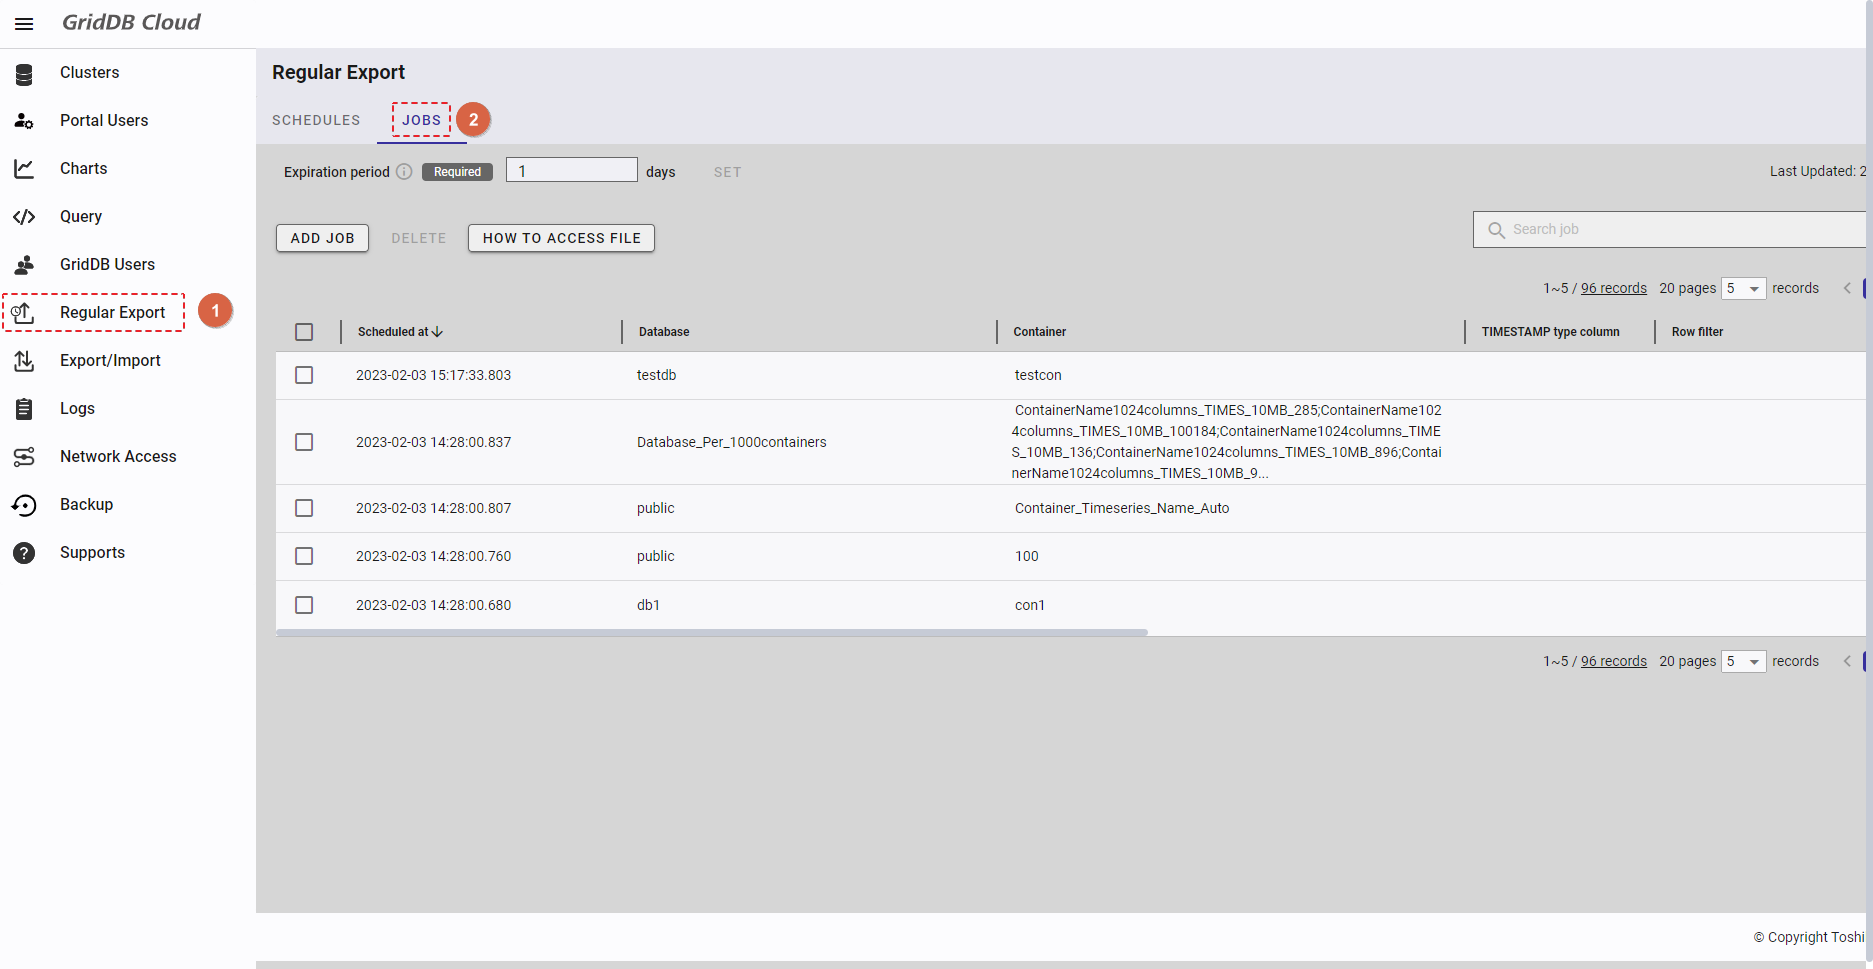
- You can choose the number of job records displayed on one page by selecting the number from [5, 10, 15, All] (④) at the top or bottom of the page. Click the [Next] button (⑤) or the [Back] button (⑥), or click the page number (⑧) to view another page.
- To search for a specific job record, type the name of the job record in the search bar (③).
- To refresh the list of regular export jobs and get the latest information about the list, click the [Refresh] button (②) on the top of the right panel.
- You can order the list by scheduled date, by database, by container, by TIMESTAMP type column, by row filter, by 'export time range starts at', by 'export time range ends at', by 'export started at', by 'export completed at', by export method, or by status, or by export type, by clicking the header (⑦) of each column.
- You can adjust the column size by dragging and dropping the vertical bar "|" on the header.
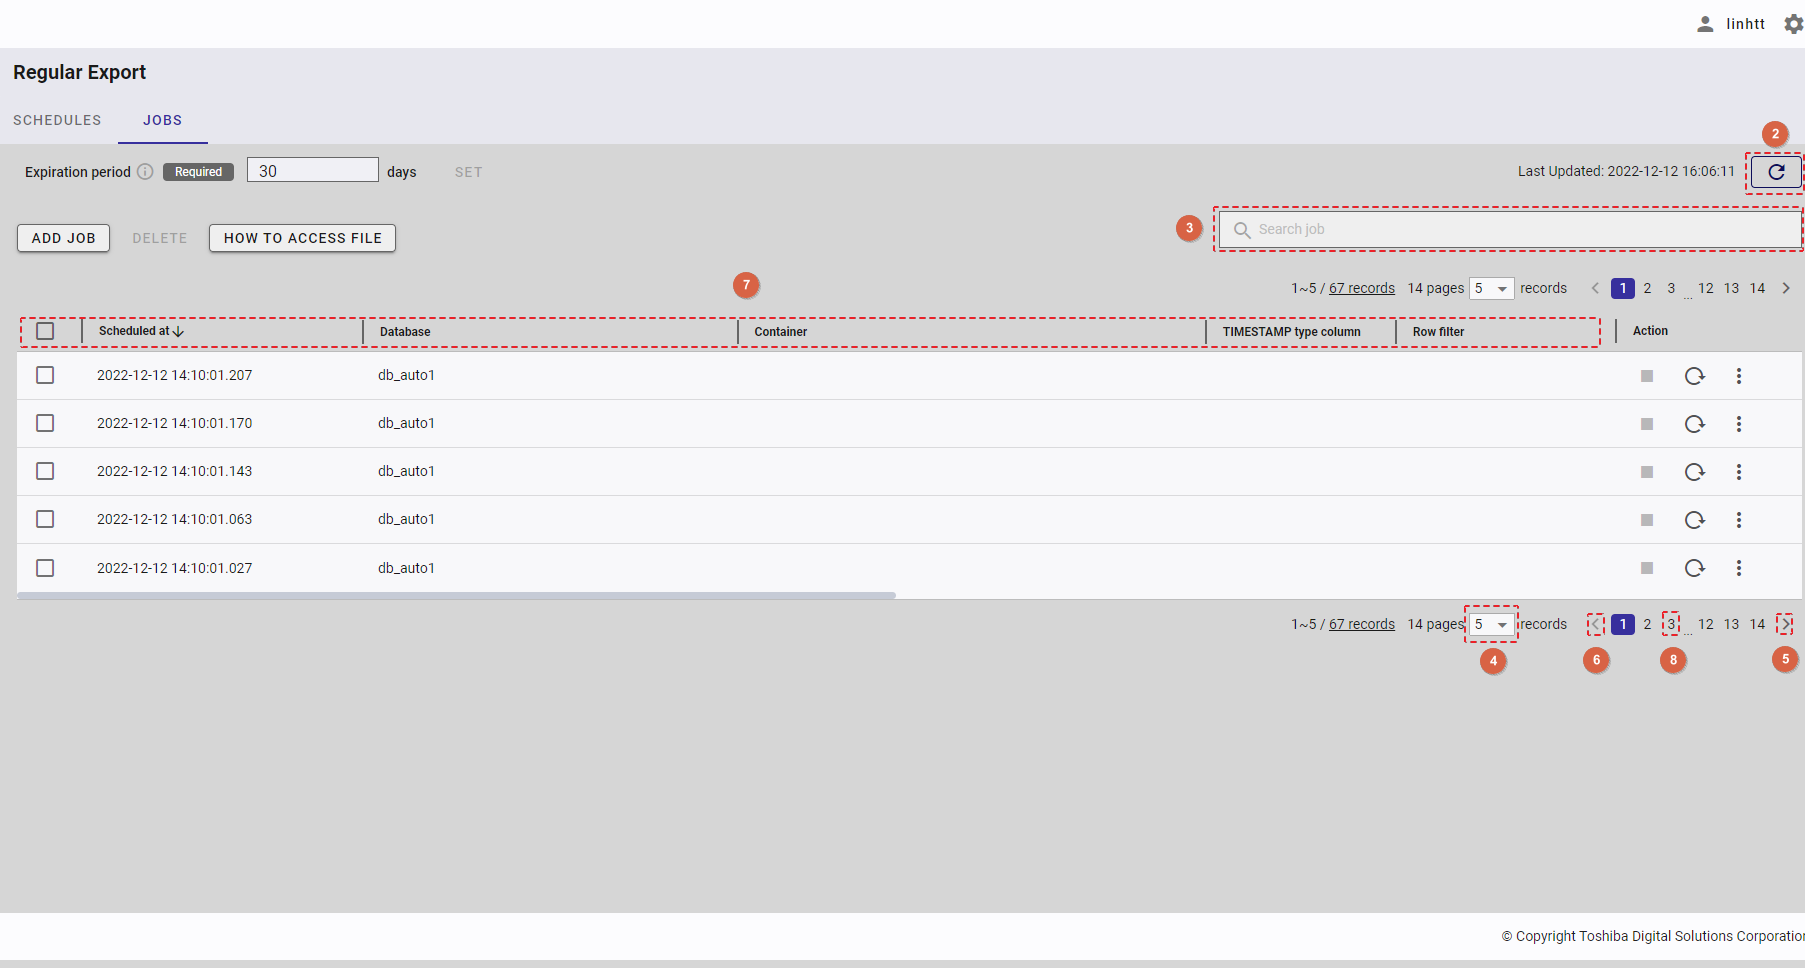
4.15.3 Setting the expiration period
This function sets the expiration period for a job history and files corresponding to the job history. It takes more time to list job history as the number of job history increases. The maximum size of storage in which files are saved is 100 GB. A job fails if the file size exceeds the maximum. For this reason, it is recommended to delete the expiration period to delete job history and files regularly.
Step 1: To set the expiration period, enter a value in the [days] text field (①) and click the [SET] button (②).
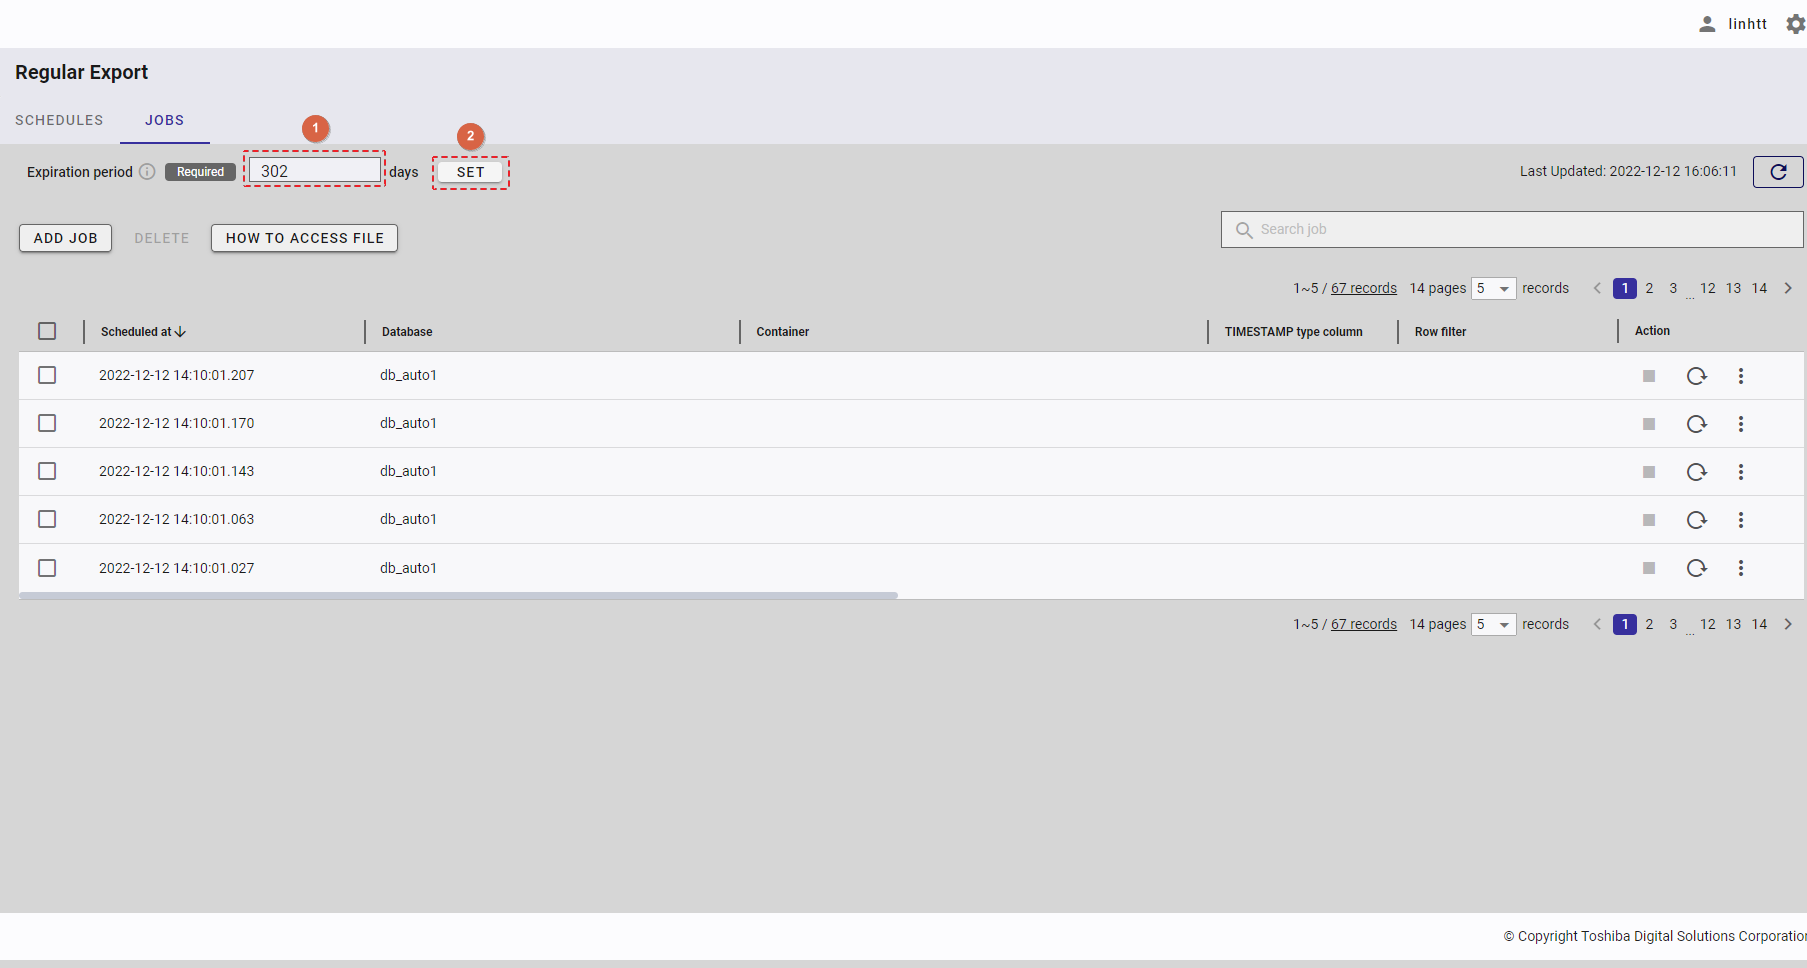
Step 2: Click the [YES] button to save the expiration period, or click the [NO] button to close the confirm dialog.
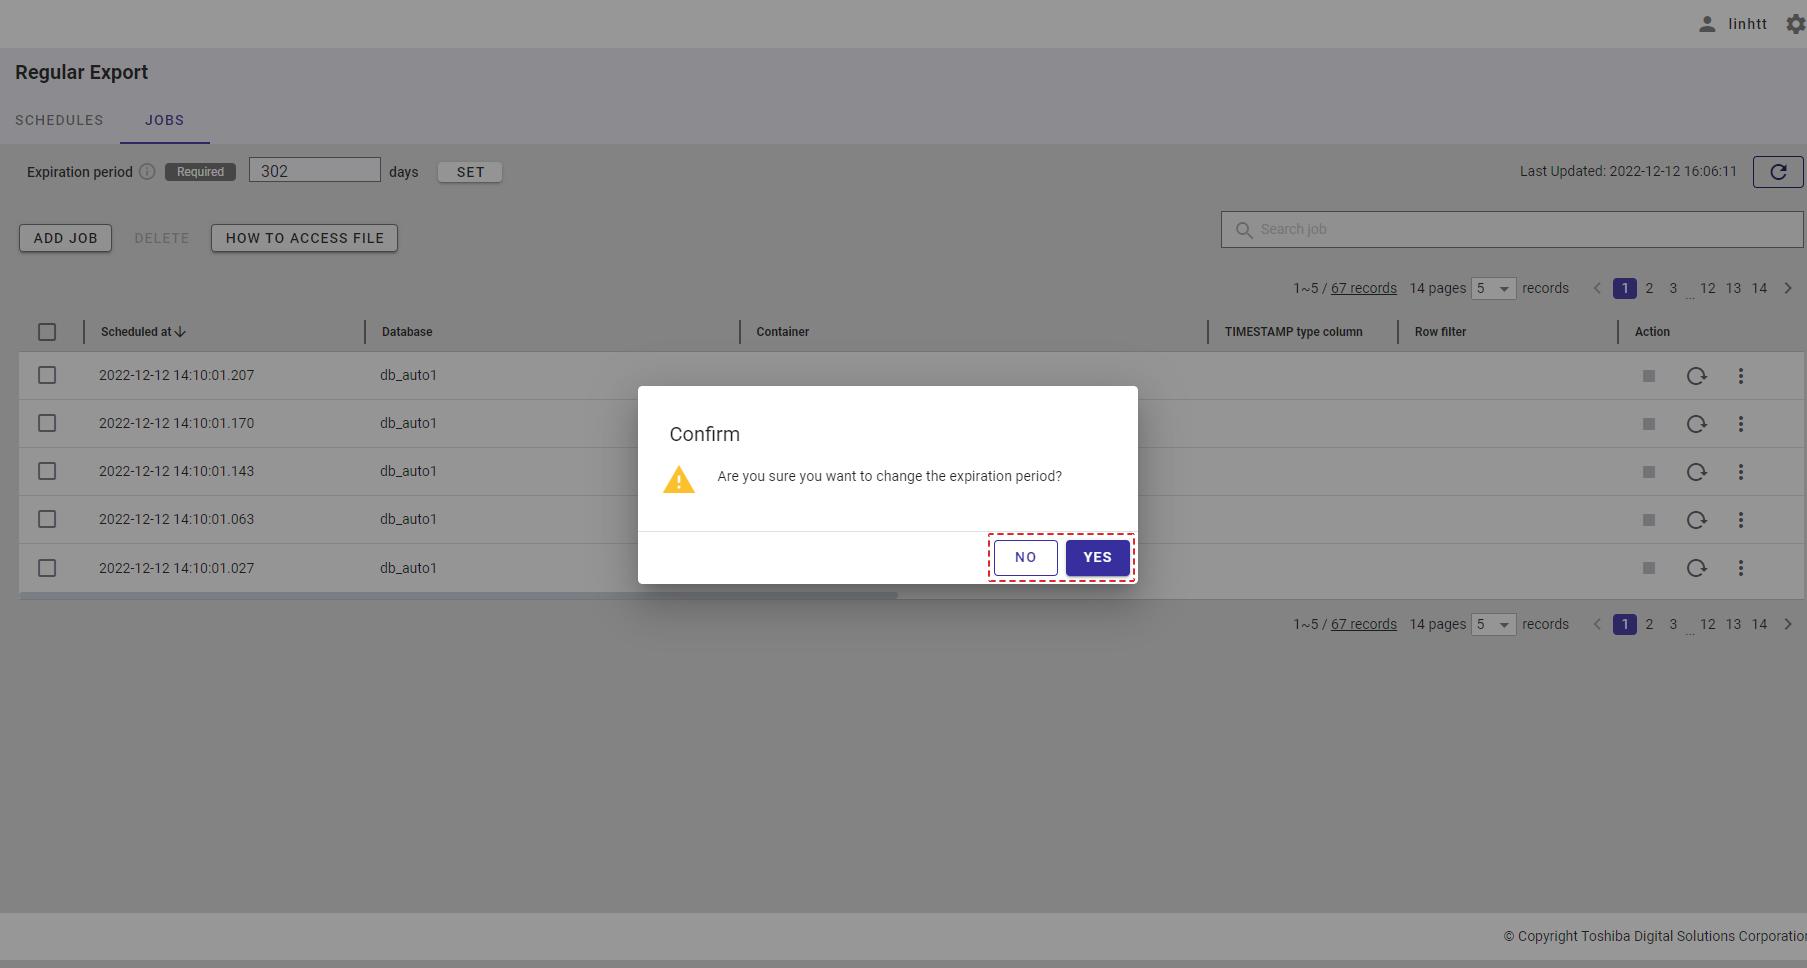
[Note]: If the value of the expiration period is set to 0, the regular export records will not be deleted and will not expire.
If the value of the expiration period is set to n (where n is an integer greater than 0), the regular export records will be kept for n days preceding the current day.
The records created before the n-day period will be deleted.
4.15.4 Adding a job
This function manually adds a job to export data.
- Select the [Specify Time Range] radio button to export data in a specified time range as a csv file. You need to specify a timeseries container or a collection with timestamp columns to use this option.
- Select the [Export All] radio button to export all data in a container.
4.15.4.1 Adding a job by specifying the time range
Step 1: To add a job, click the [ADD JOB] button.
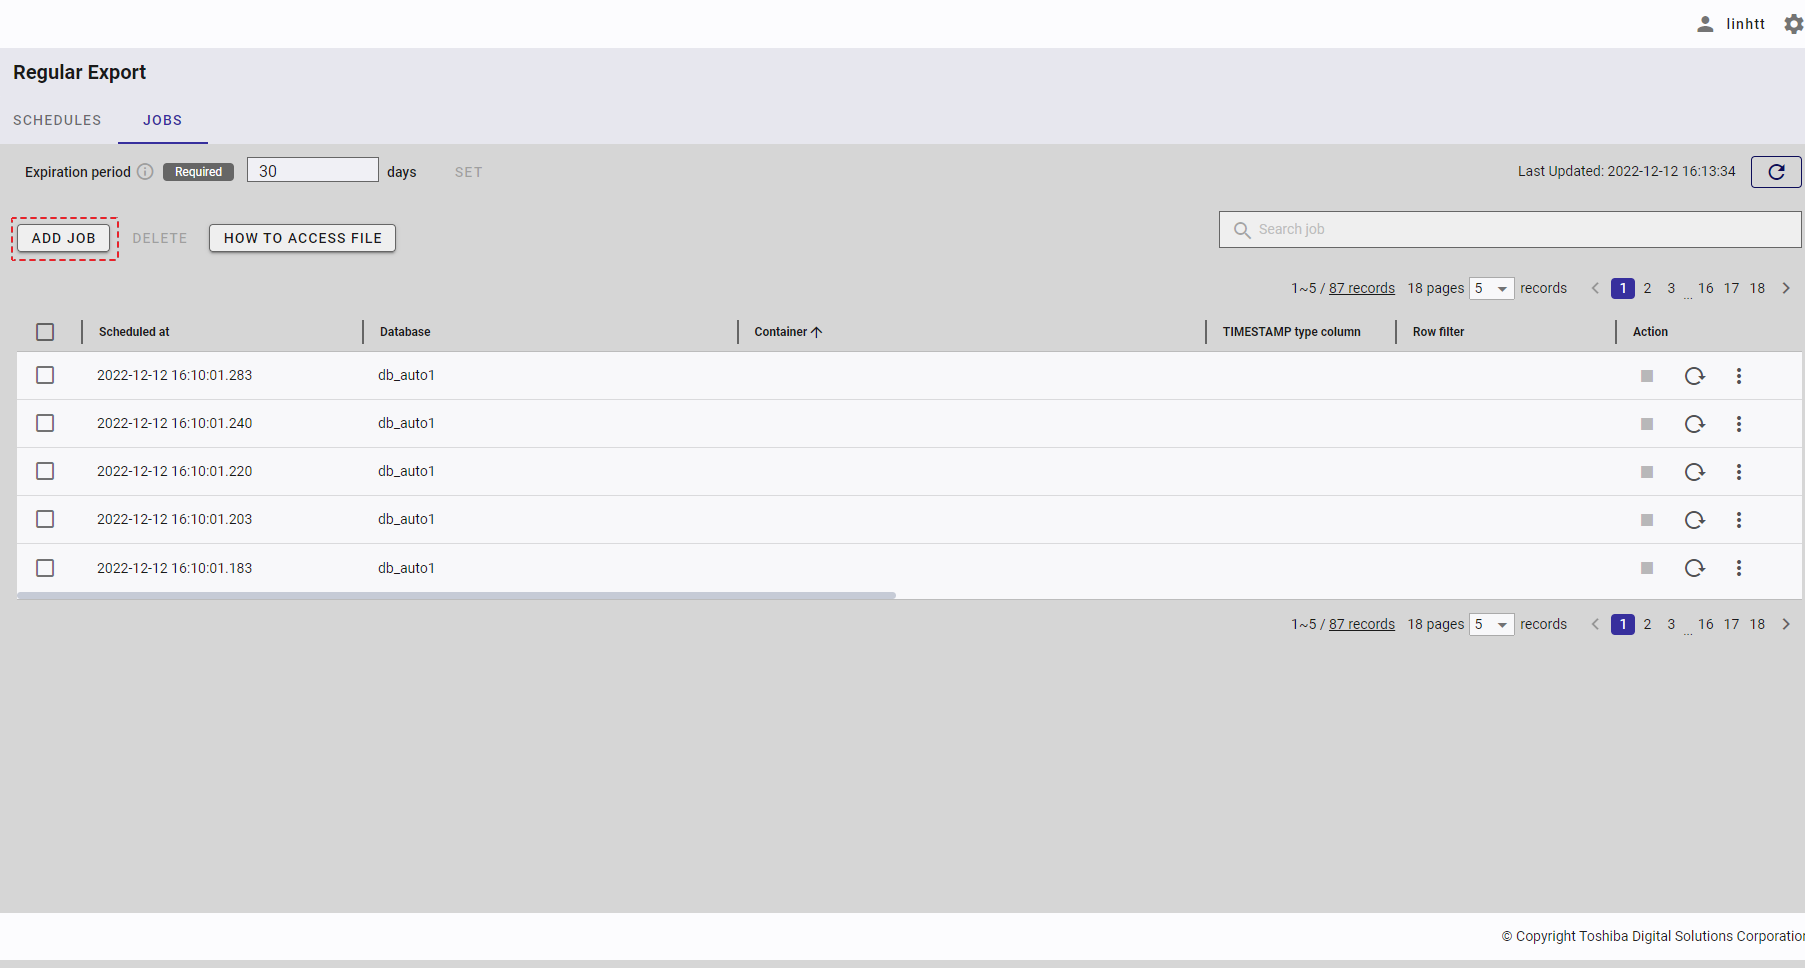
Step 2: Select the [Specify Time Range] radio button (①). Then, select a database that includes containers to export from the [Database] drop-down list (②). Only one database can be selected. You can also enter the database name in the text box to search for a database name you want to select.
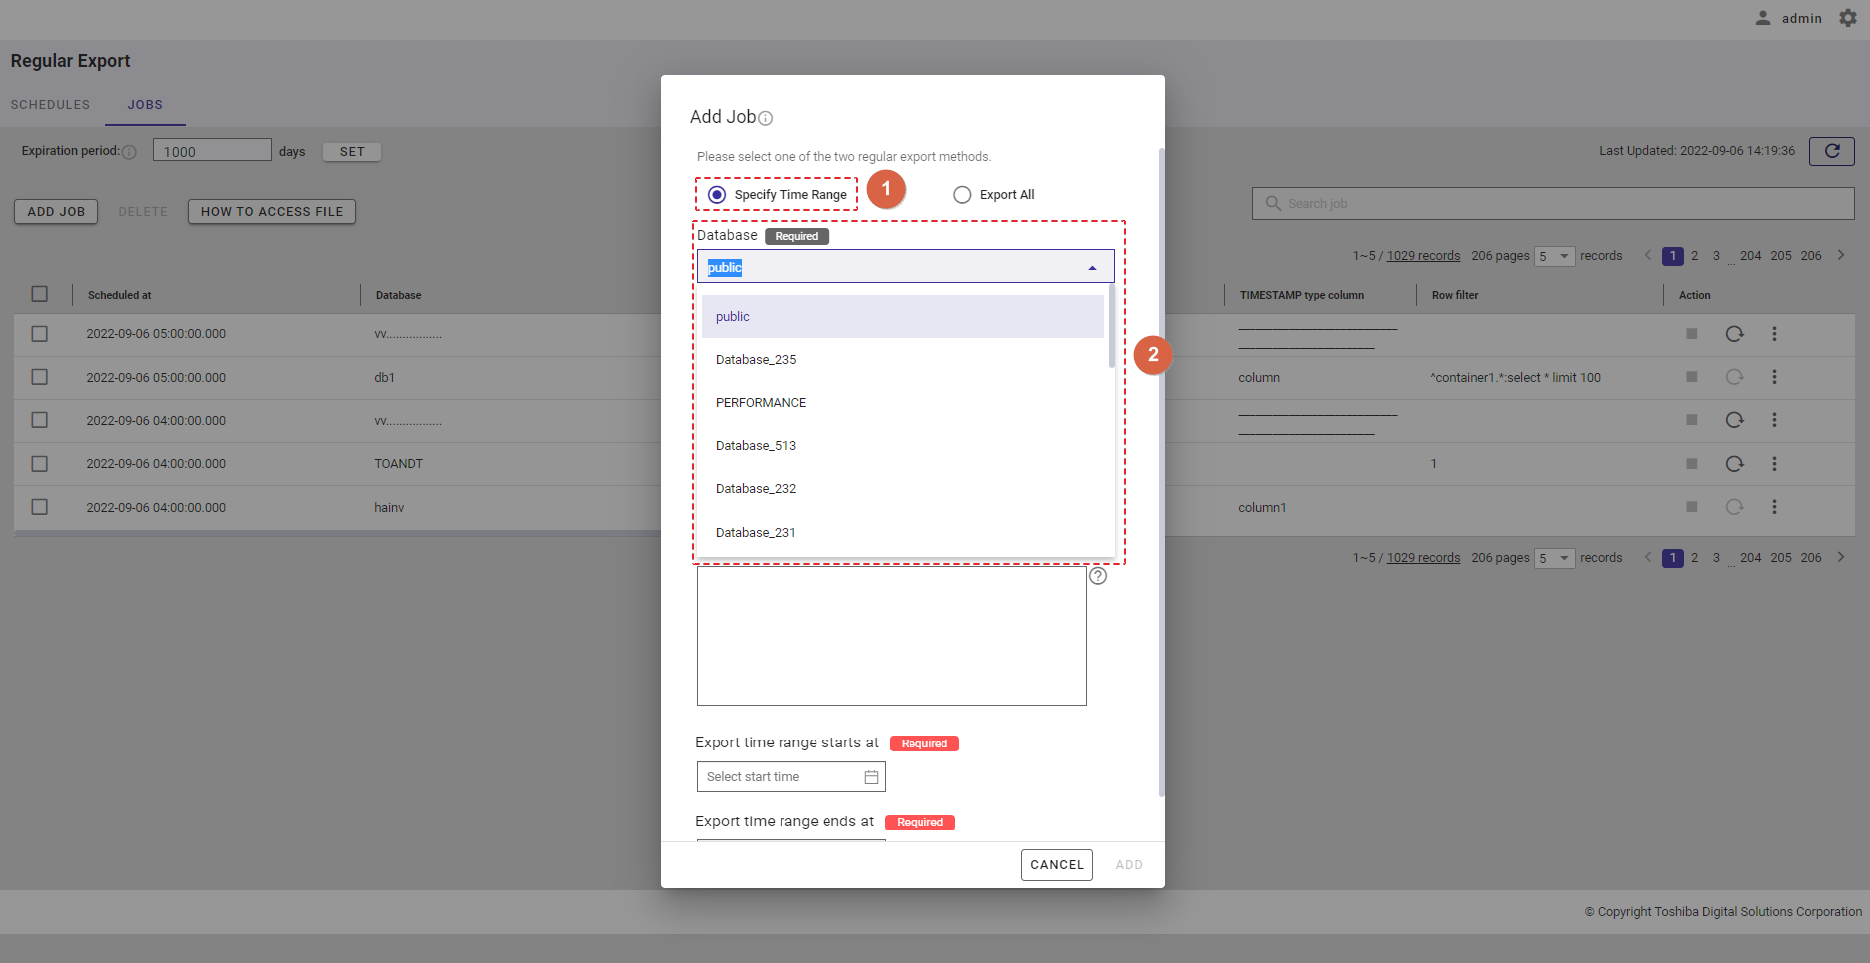
Step 3: Select a container type by selecting the [TIMESERIES] radio button (④) or the [COLLECTION] radio button (⑤). Then, select a container to export from the [Container] drop-down list (③). Only one container can be selected. You can also enter the container name in the text box to search for a container name you want to select.
Type of container
Container type Note TIMESERIES For this container type, select a container that has a TIMESERIES data type. COLLECTION For this container type, select a container that has a COLLECTION data type.
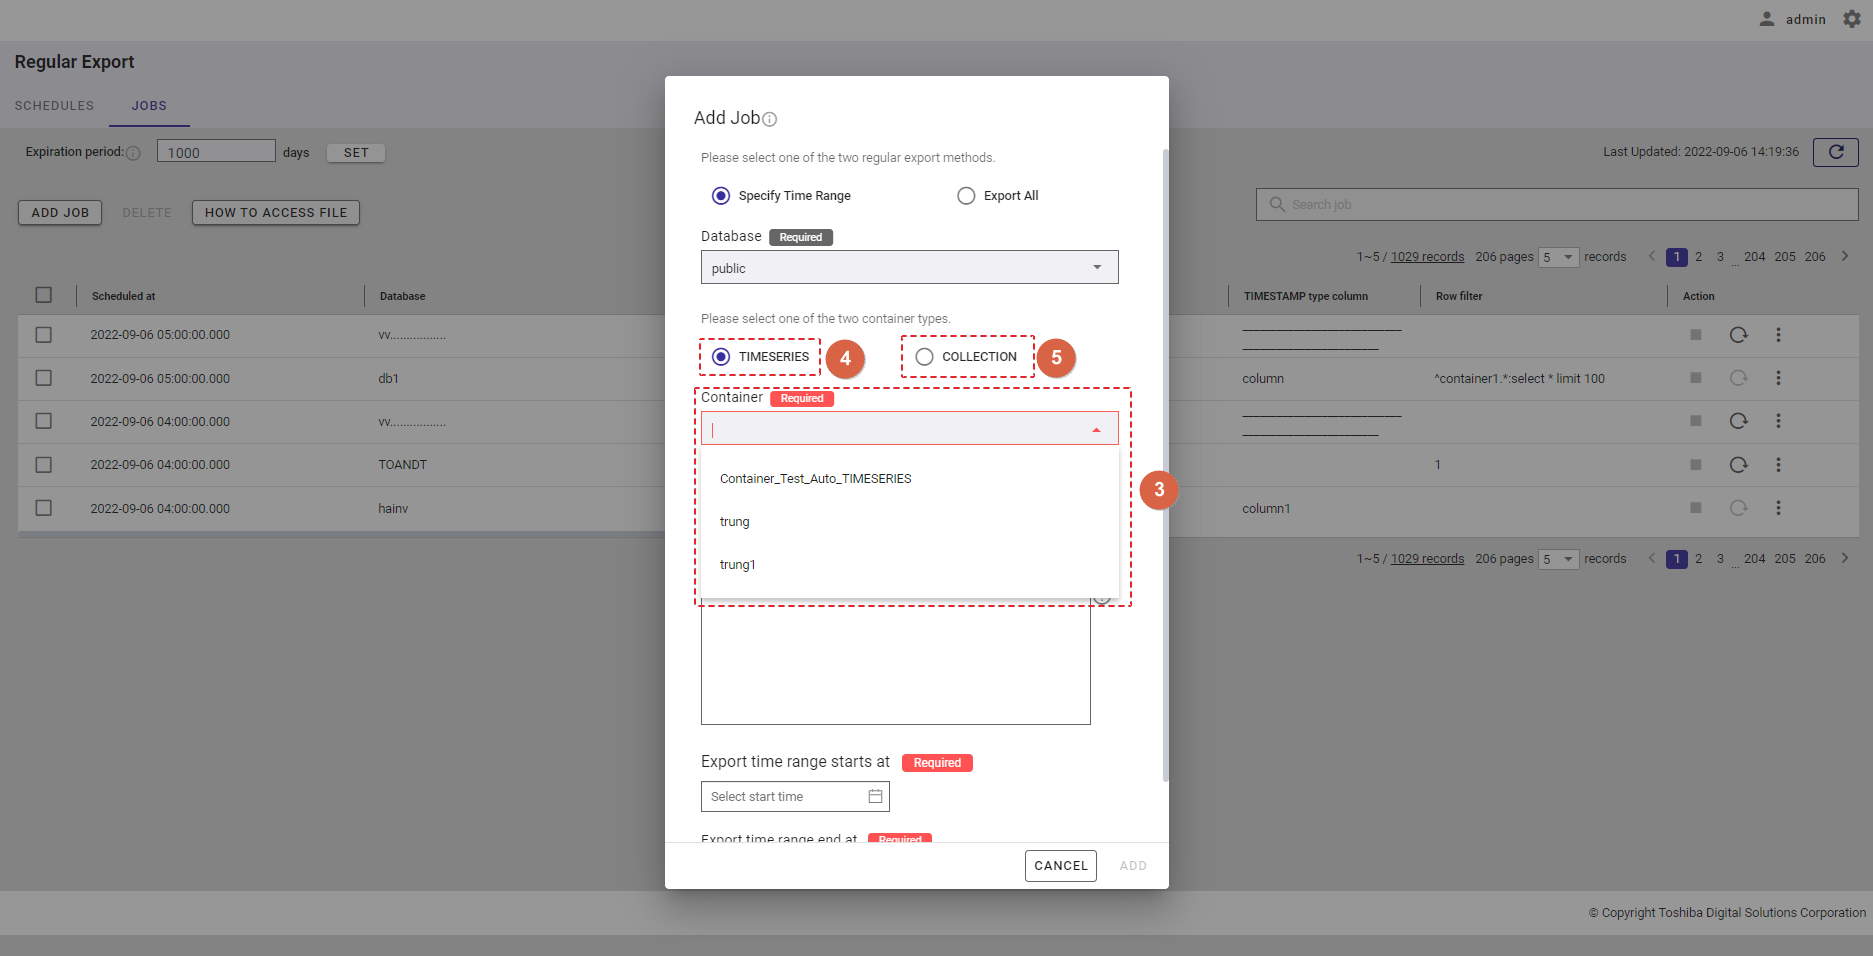
Step 4: Select the timestamp type column from the [TIMESTAMP type column] drop-down list.
| Container type | Note |
|---|---|
| TIMESERIES | If the container type TIMESERIES is selected, the first column will automatically be a TIMESTAMP type column (⑦); you cannot choose any other column. |
| COLLECTION | If the container type COLLECTION is selected, select a TIMESTAMP type column from the [TIMESTAMP type column] drop-down list (⑥). |
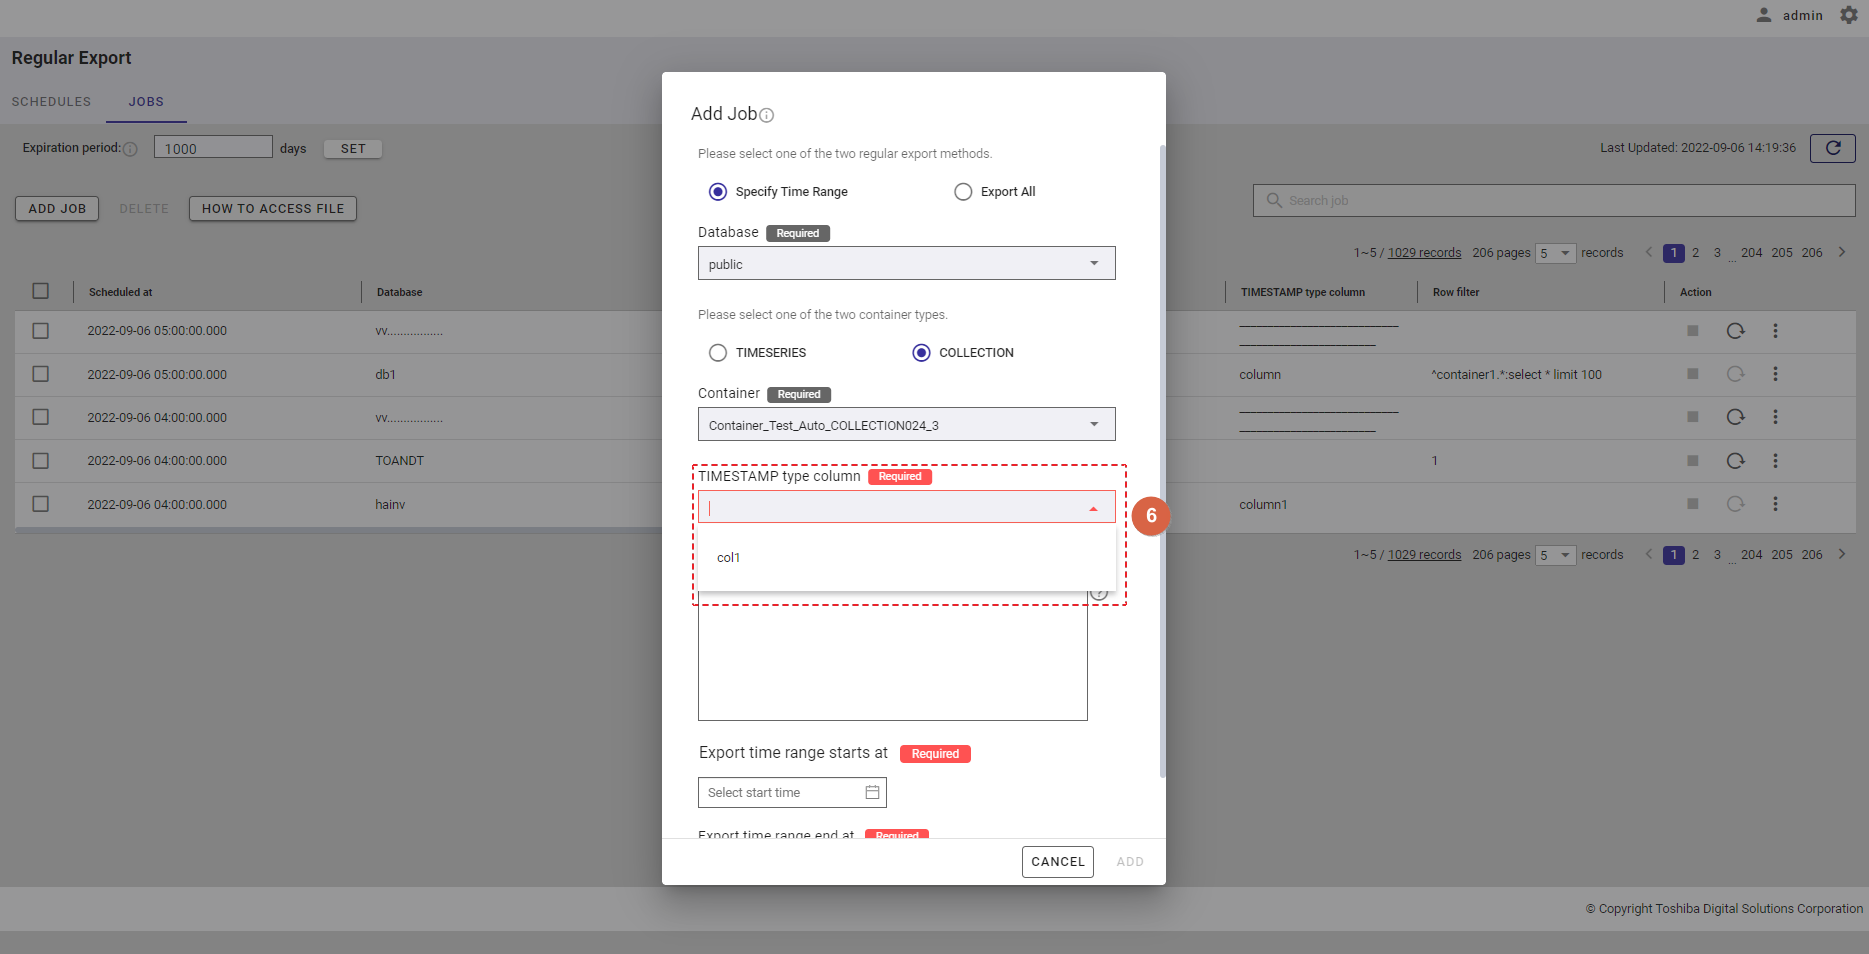
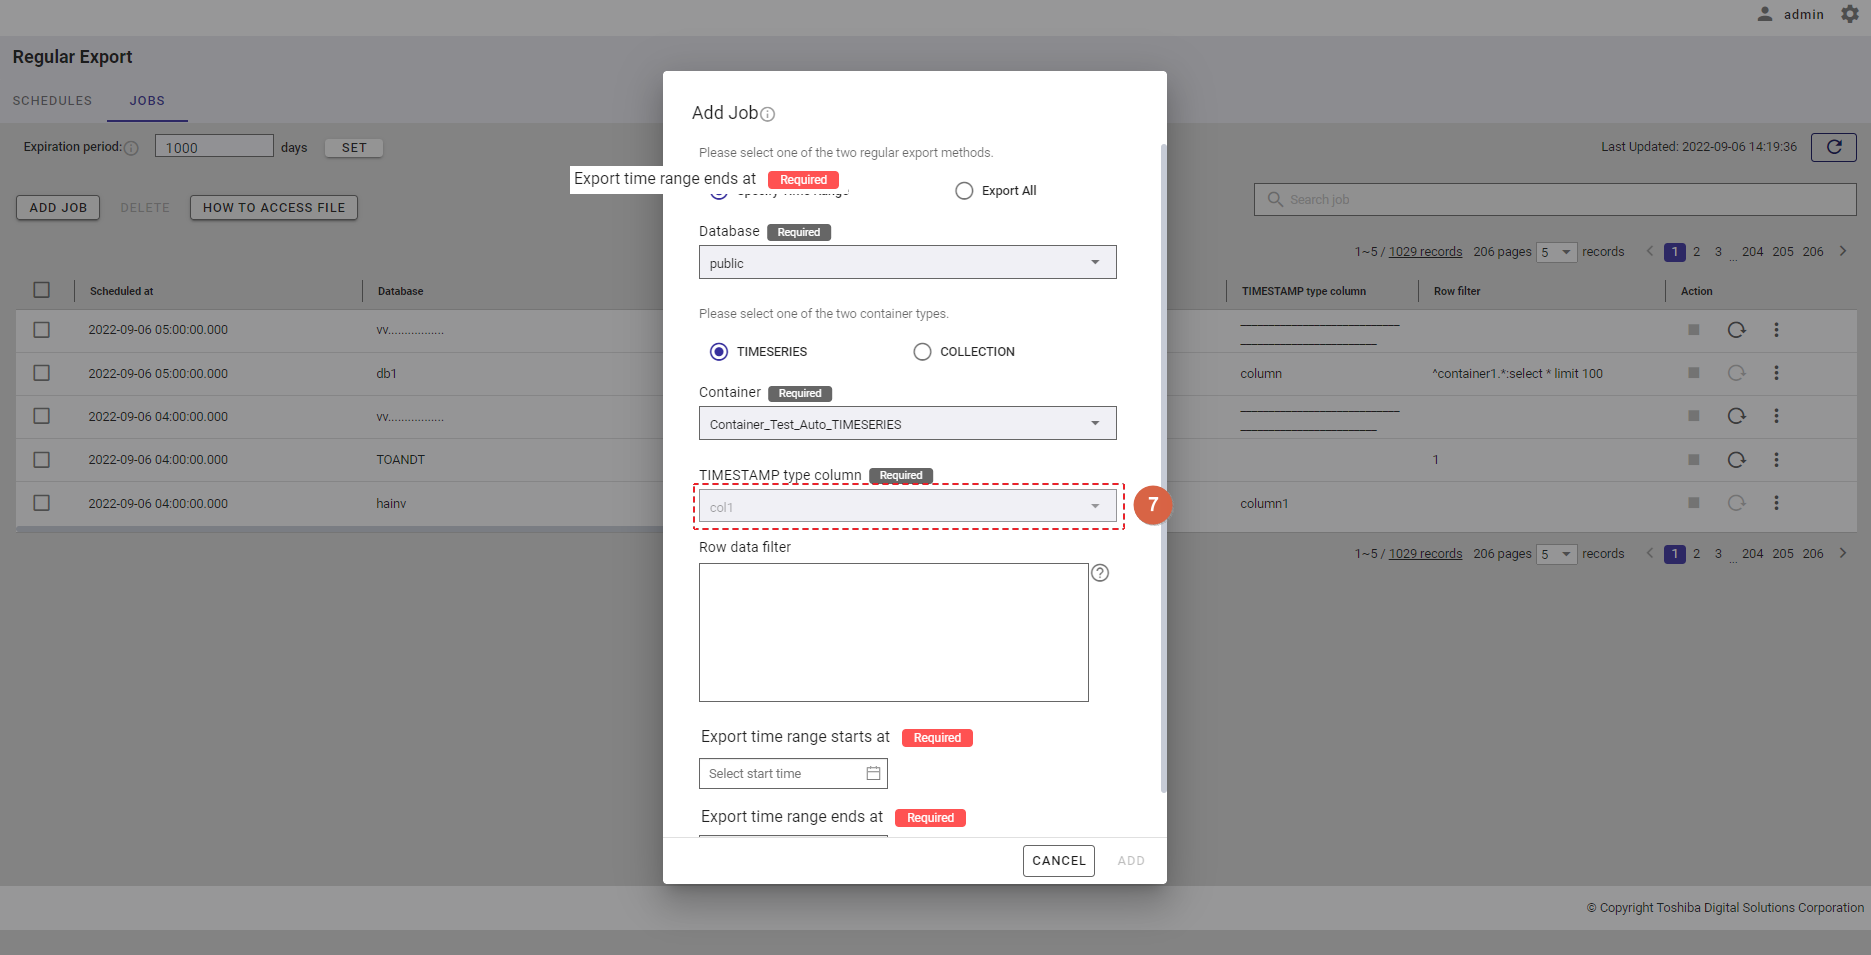
Step 5: In the [Row data filter] text field (④), specify a syntax used for filtering. The row data extracted using the filter will be exported.
Rows located by a search query can be exported by specifying a search query to remove rows from a container. All rows stored in a container that has not been specified in the search query will be exported.
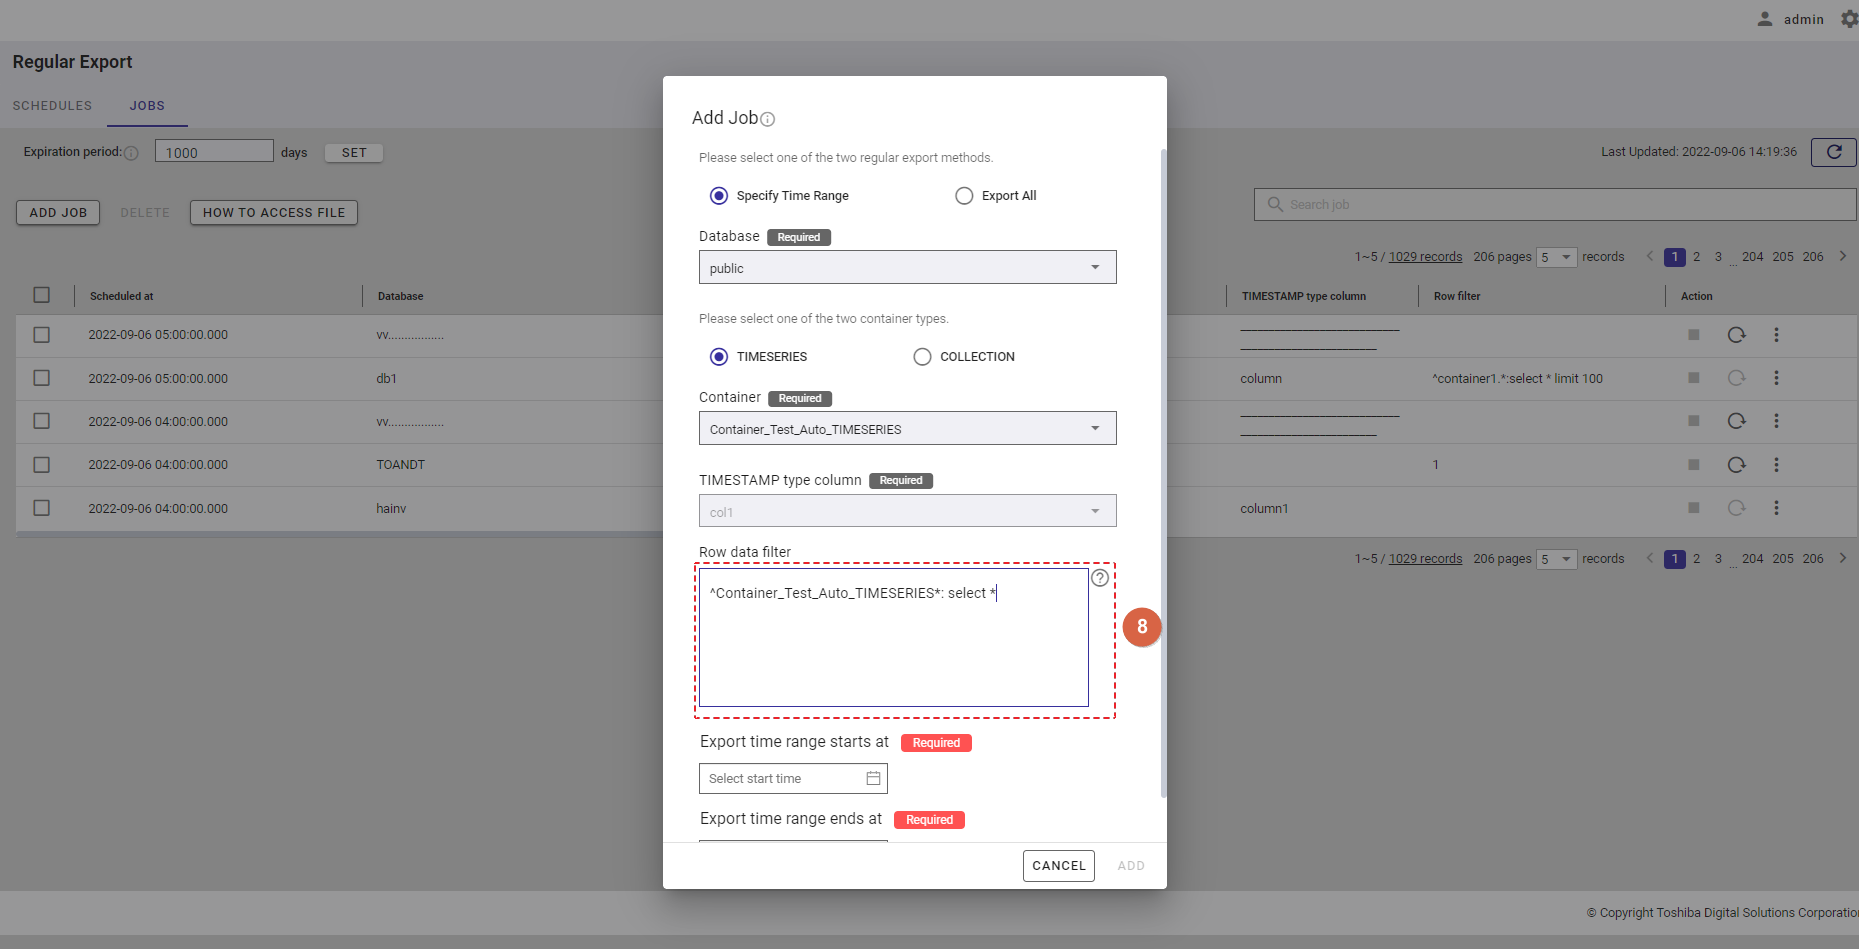
[Note]: For more details, refer to the section on how to specify a row in the GridDB Operation Tools Reference, or you can hover the mouse pointer over the [HELP] icon (①) to get an example.
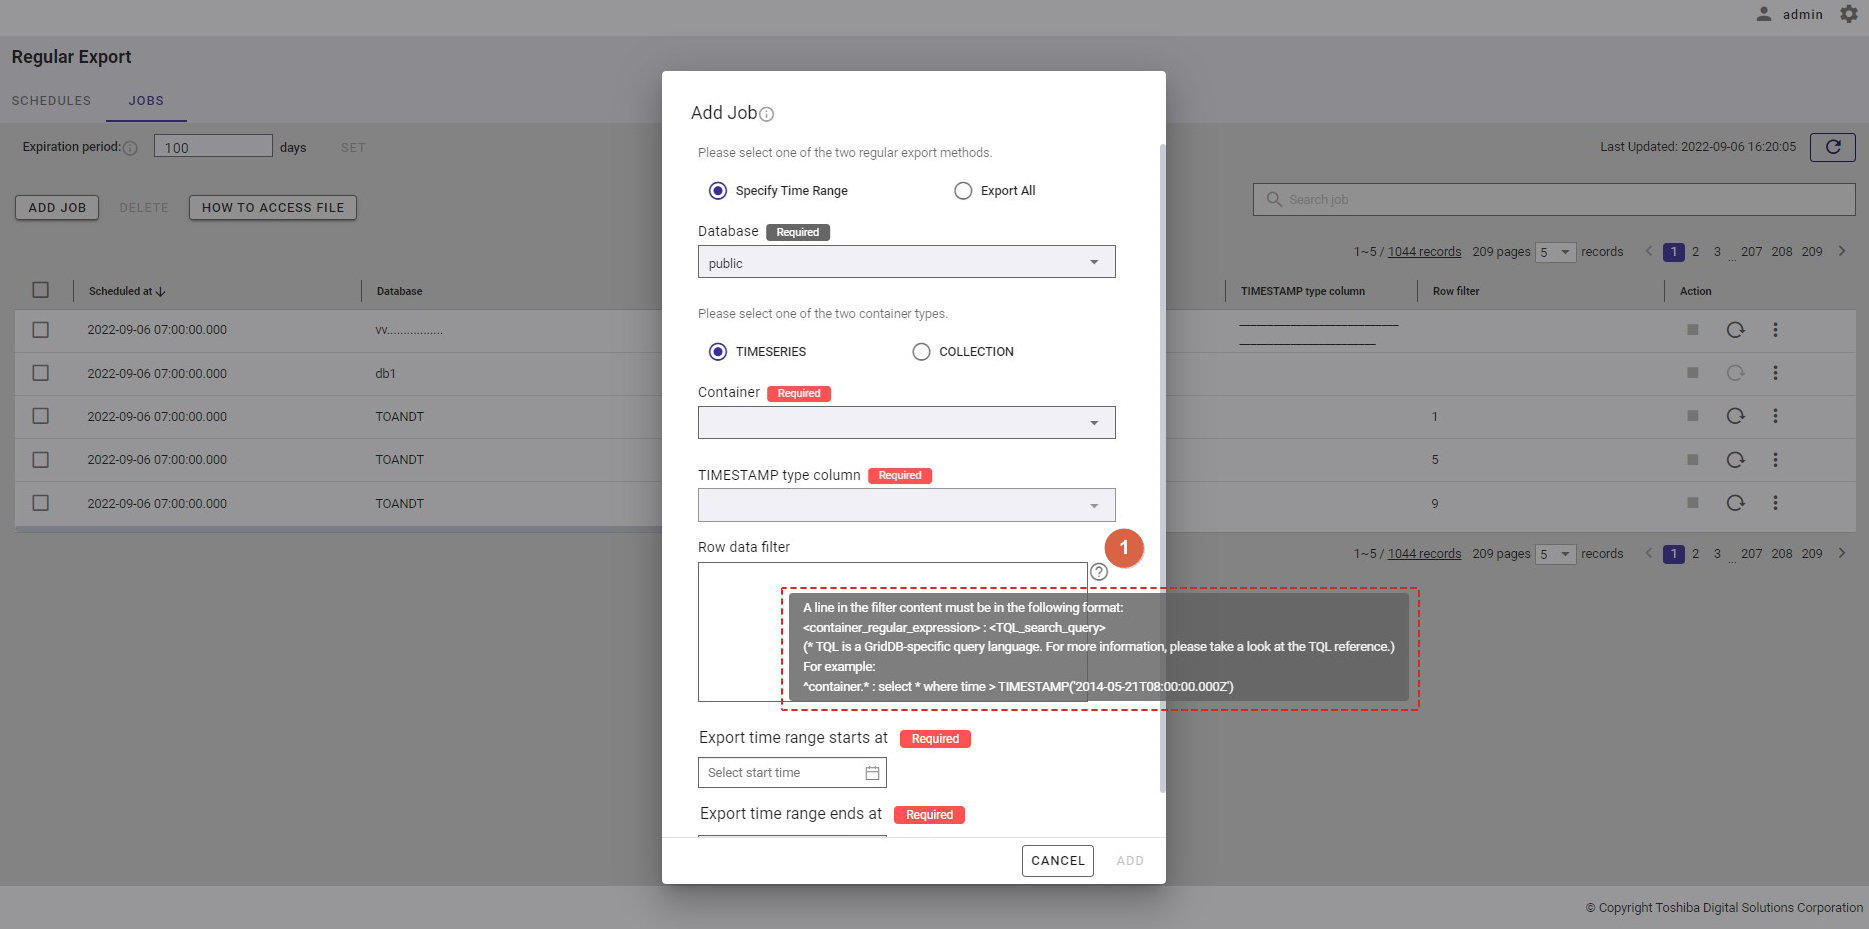
Step 6: Select time in the [Export time range starts at] date field (⑨) and in the [Export time range ends at] date field (⑩). The data will be exported for the specified export time range.
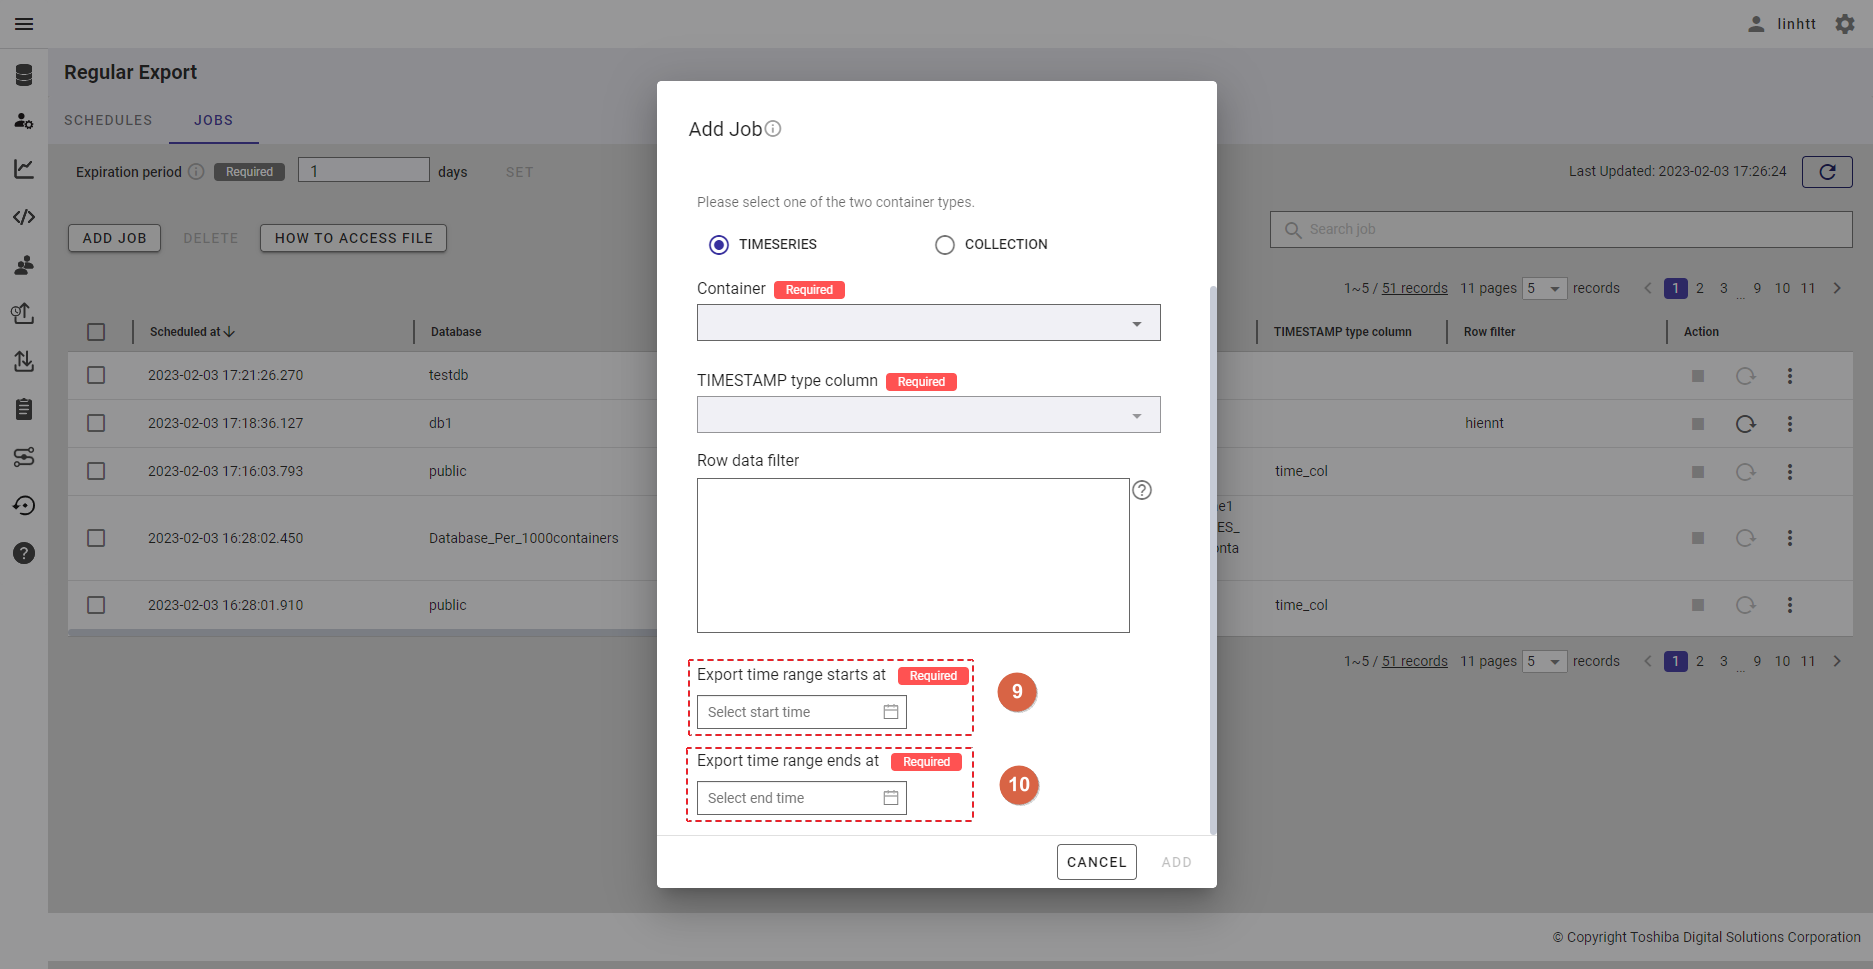
Step 7: Click the [ADD] button to add a job. Or click the [CANCEL] button to close the Add Job dialog.
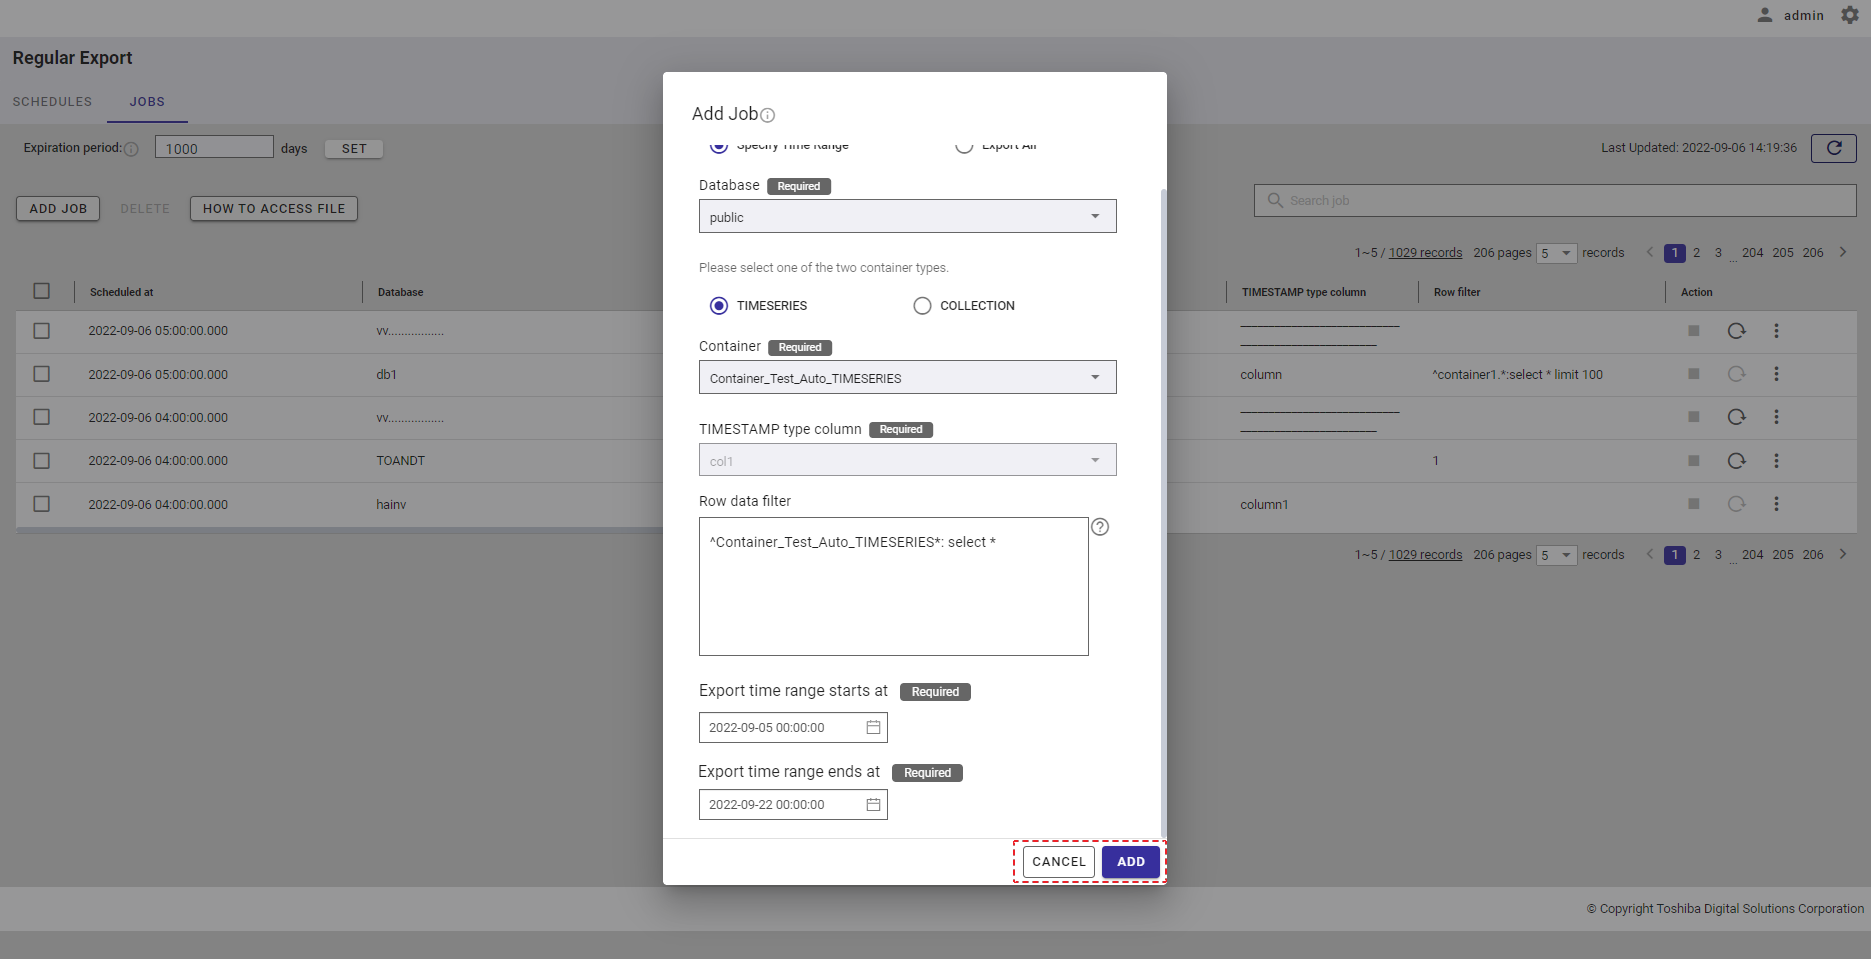
- After it is successfully added, the job goes into waiting status and then into running status.
- if the job is successfully executed, the status changes to 'Success.'
- If the job execution fails, the status changes to 'Failed.'
4.15.4.2 Adding a job to export all
Step 1: To add a job, click the [ADD JOB] button.
Step 2: Select the [Export All] radio button (①). Then, select a database that includes containers to export from the [Database] drop-down list (②). Only one database can be selected. You can also enter the database name in the text box to search for database name you want to select.
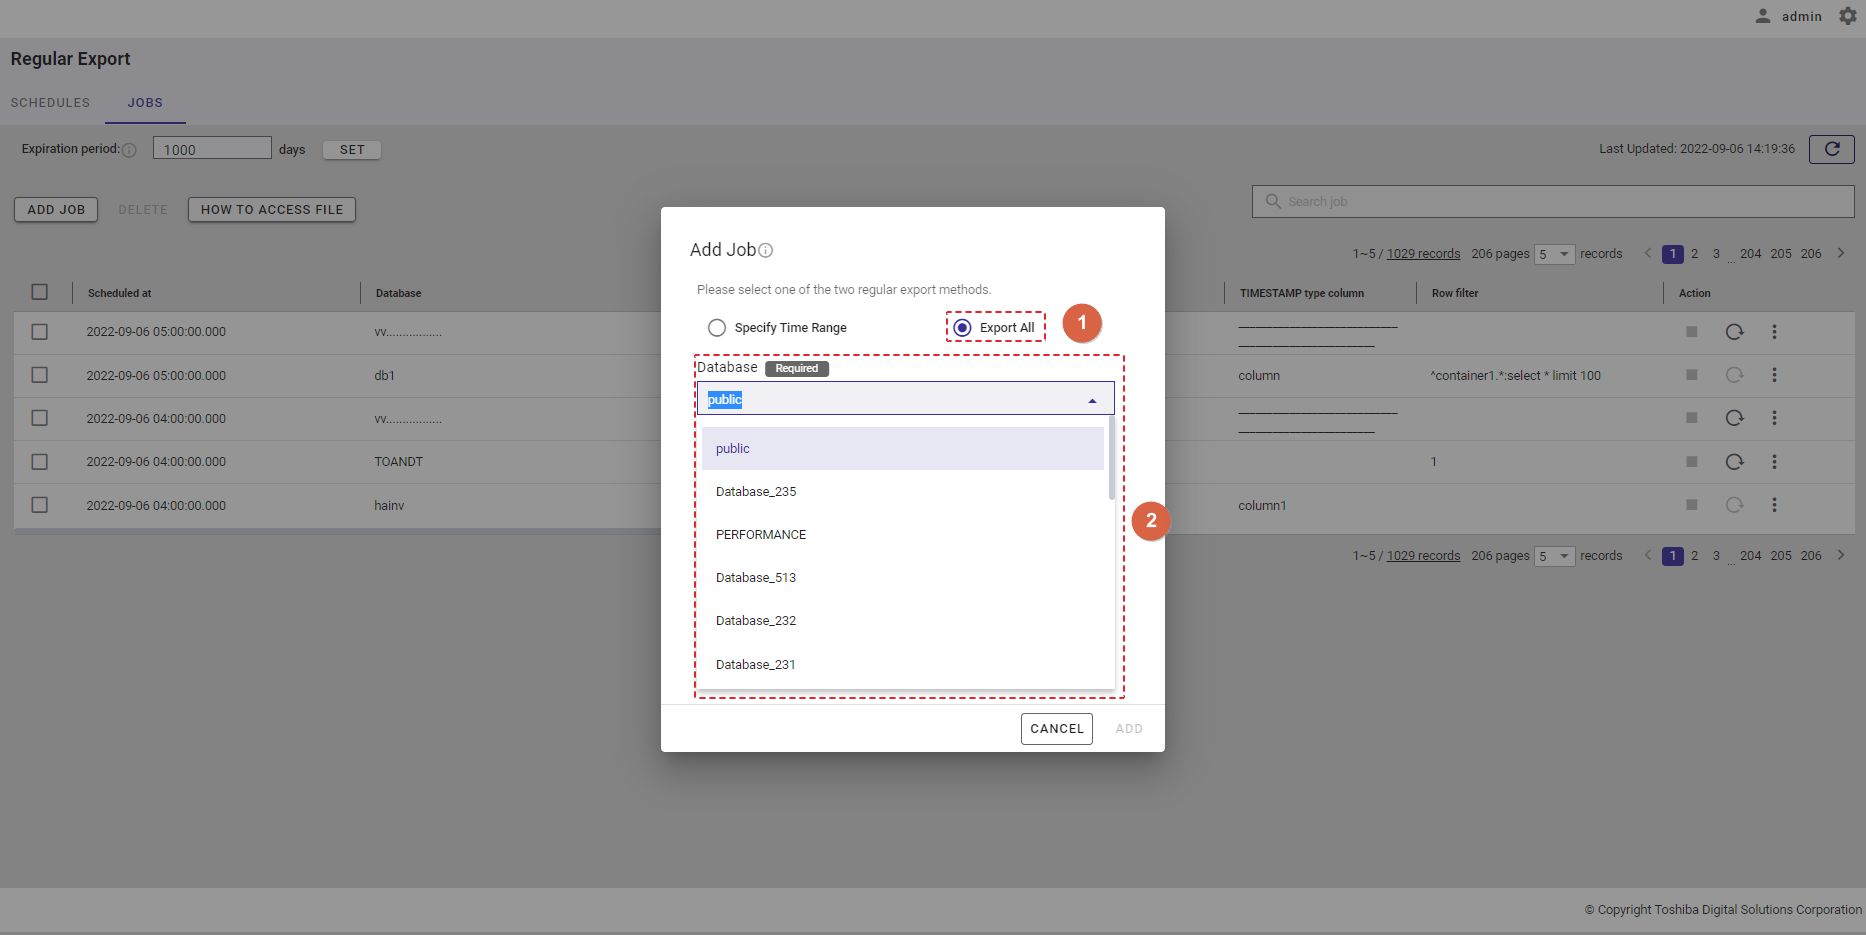
Step 3: Select a container from the [Container] drop-down list (③). Then, select a container to export from the [Container] drop-down list (③). Only one container can be selected. You can also enter the container name in the text box to search for a container name you want to select.
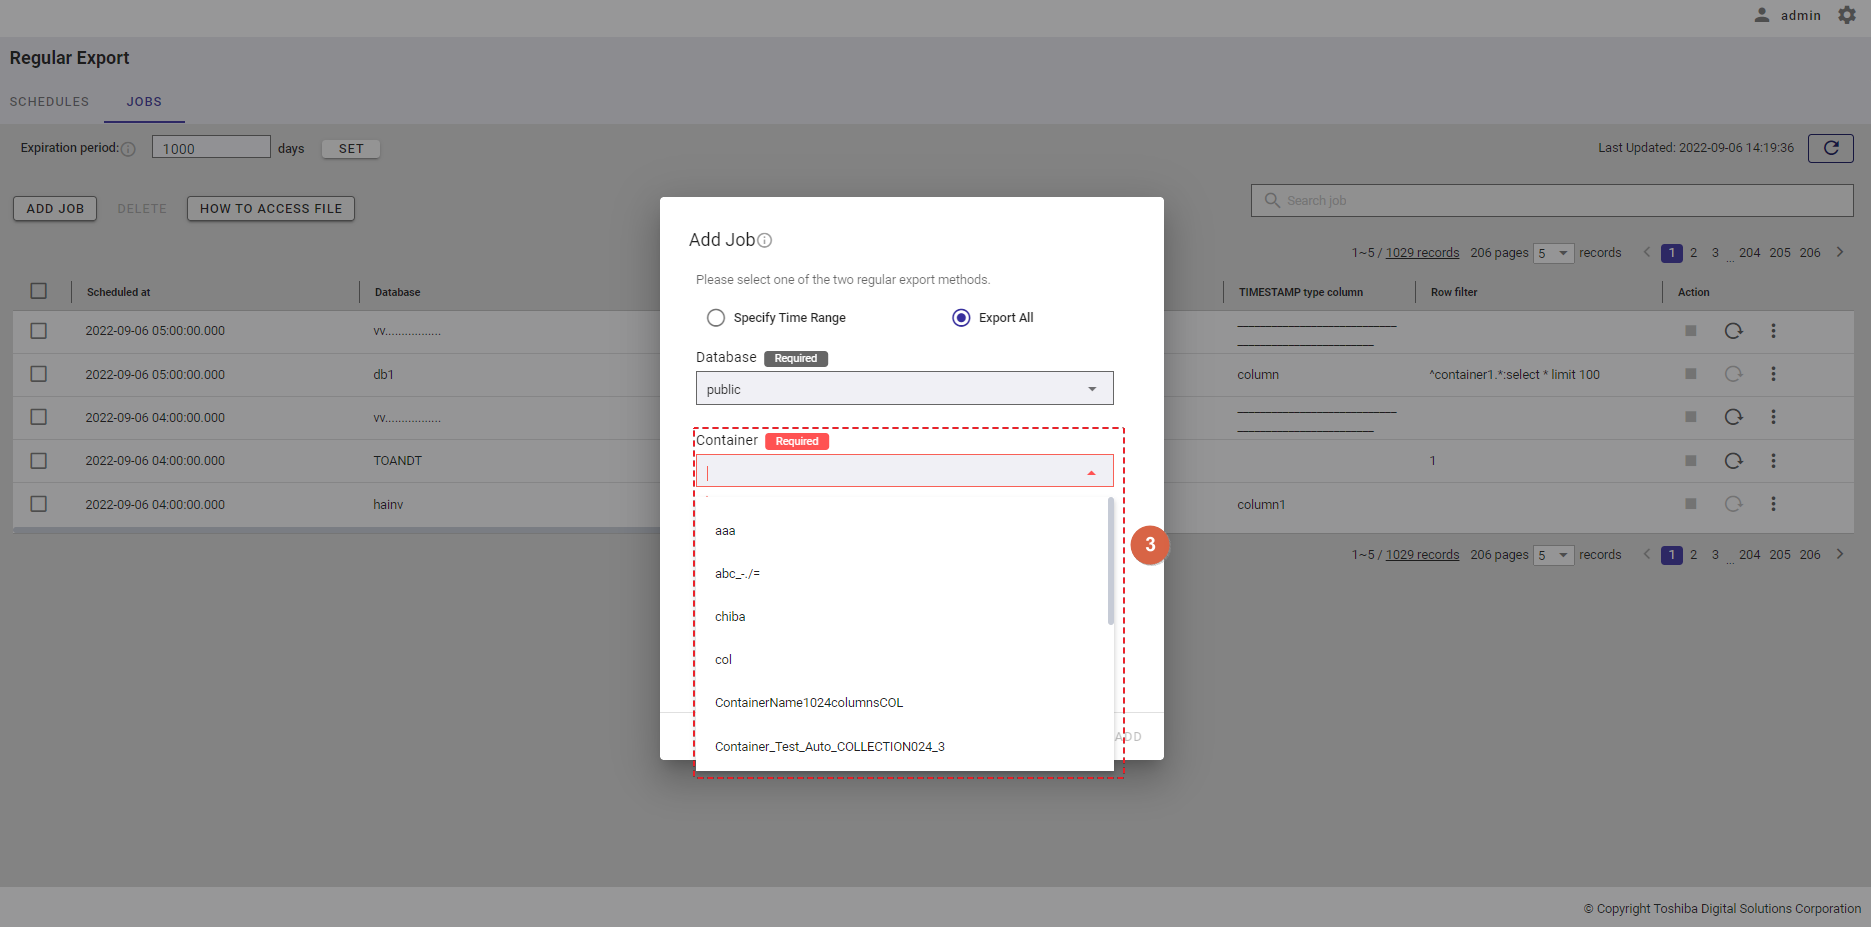
Step 4: In the [Row data filter] text field (④), specify a syntax used for filtering. The specified row data will be excluded from export using the filter.
Rows located by a search query can be exported by specifying a search query to remove rows from a container. All rows stored in a container that has not been specified in the search query will be exported.
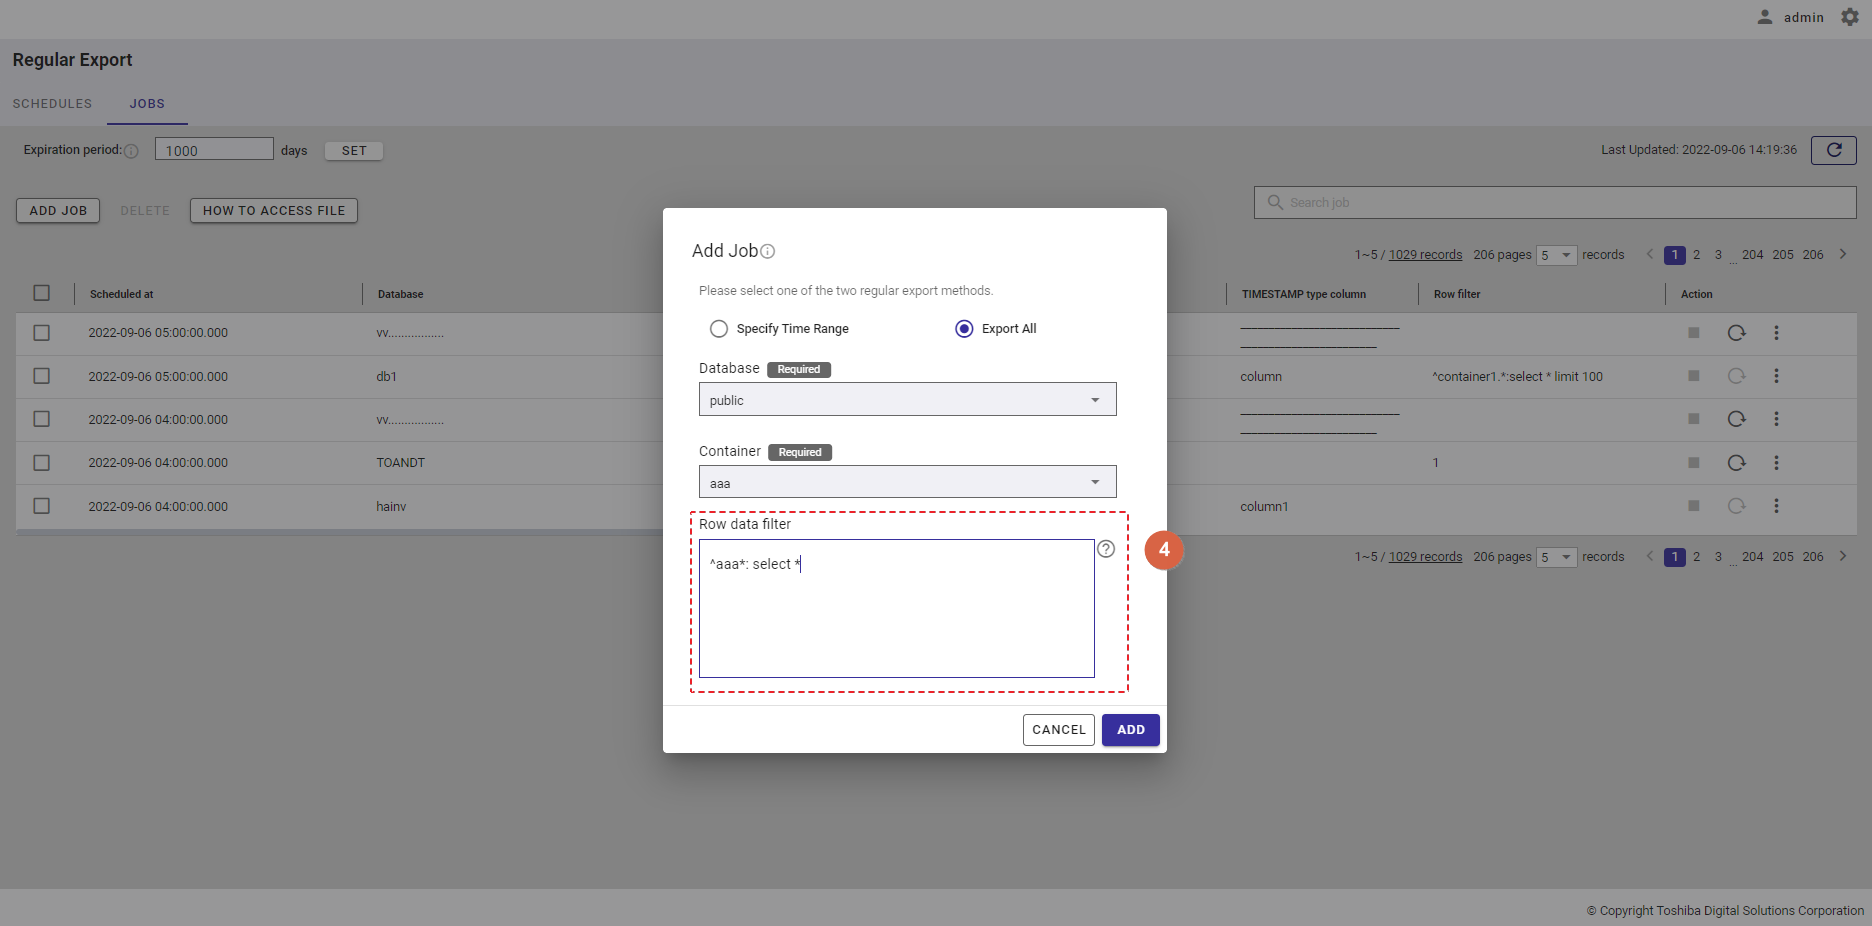
[Note]: For more details, refer to the section on how to specify a row in the GridDB Operation Tools Reference, or you can hover the mouse pointer over the [HELP] icon (①) to get an example.
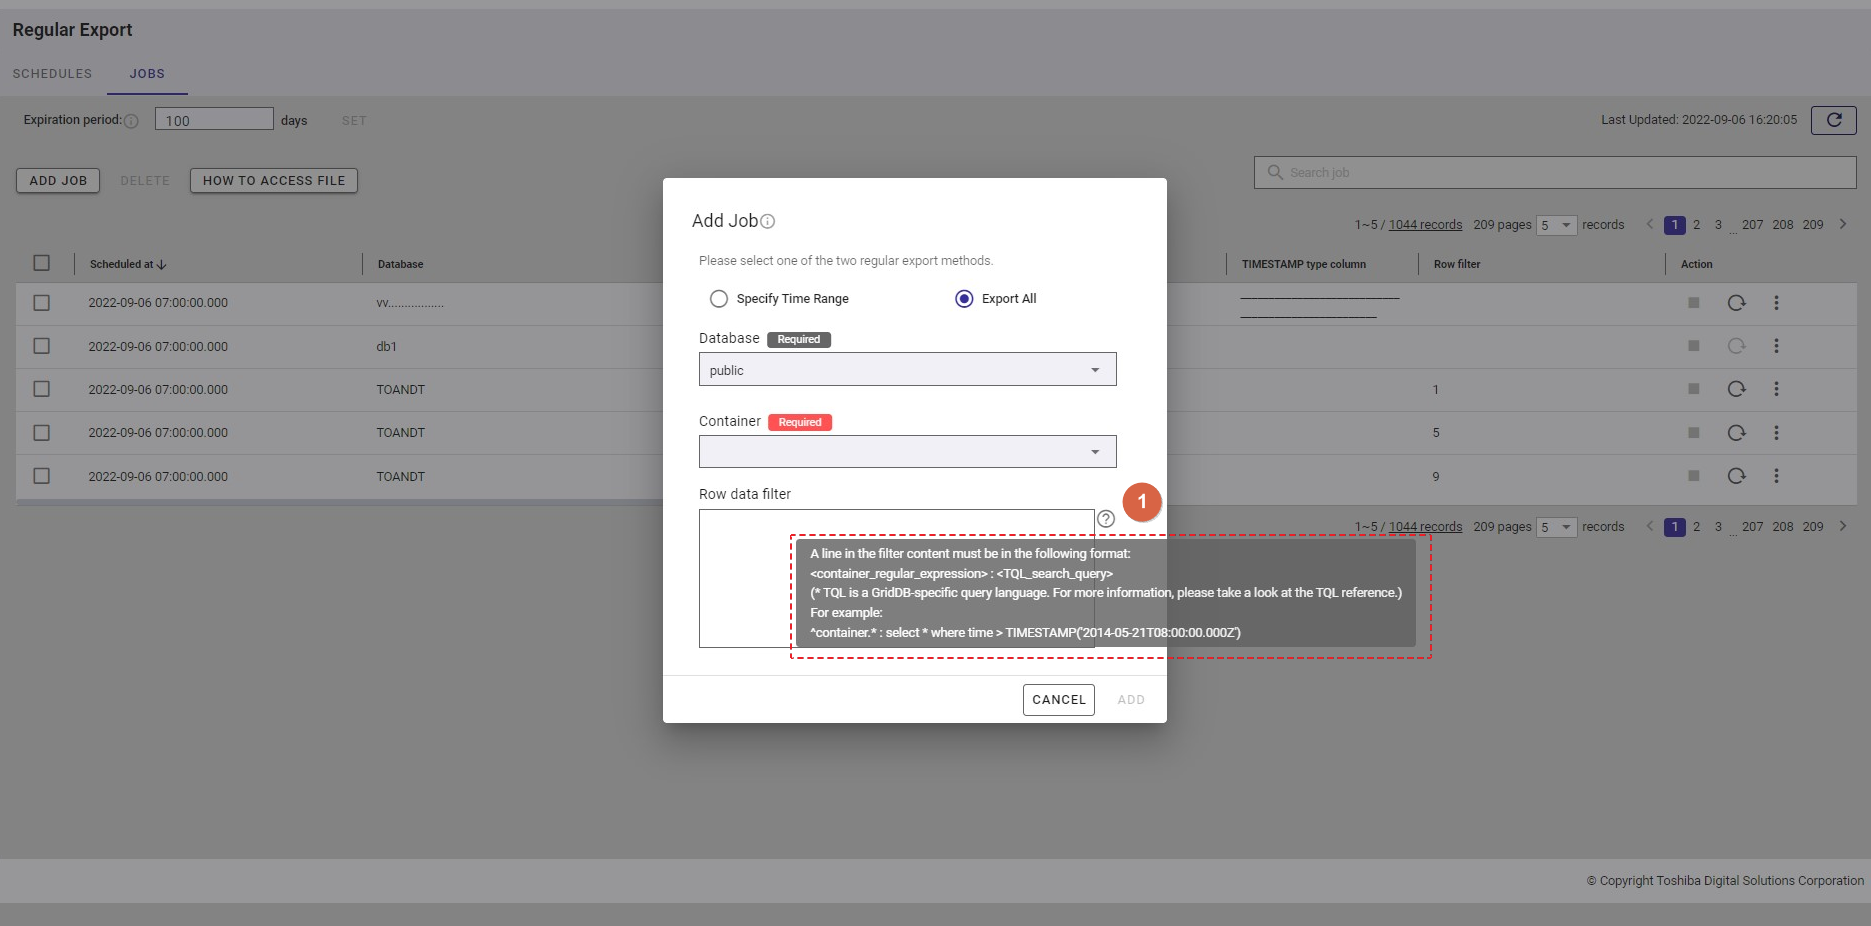
Step 5: Click the [ADD] button to add a schedule. Or click the [CANCEL] button to close the Add Job dialog.
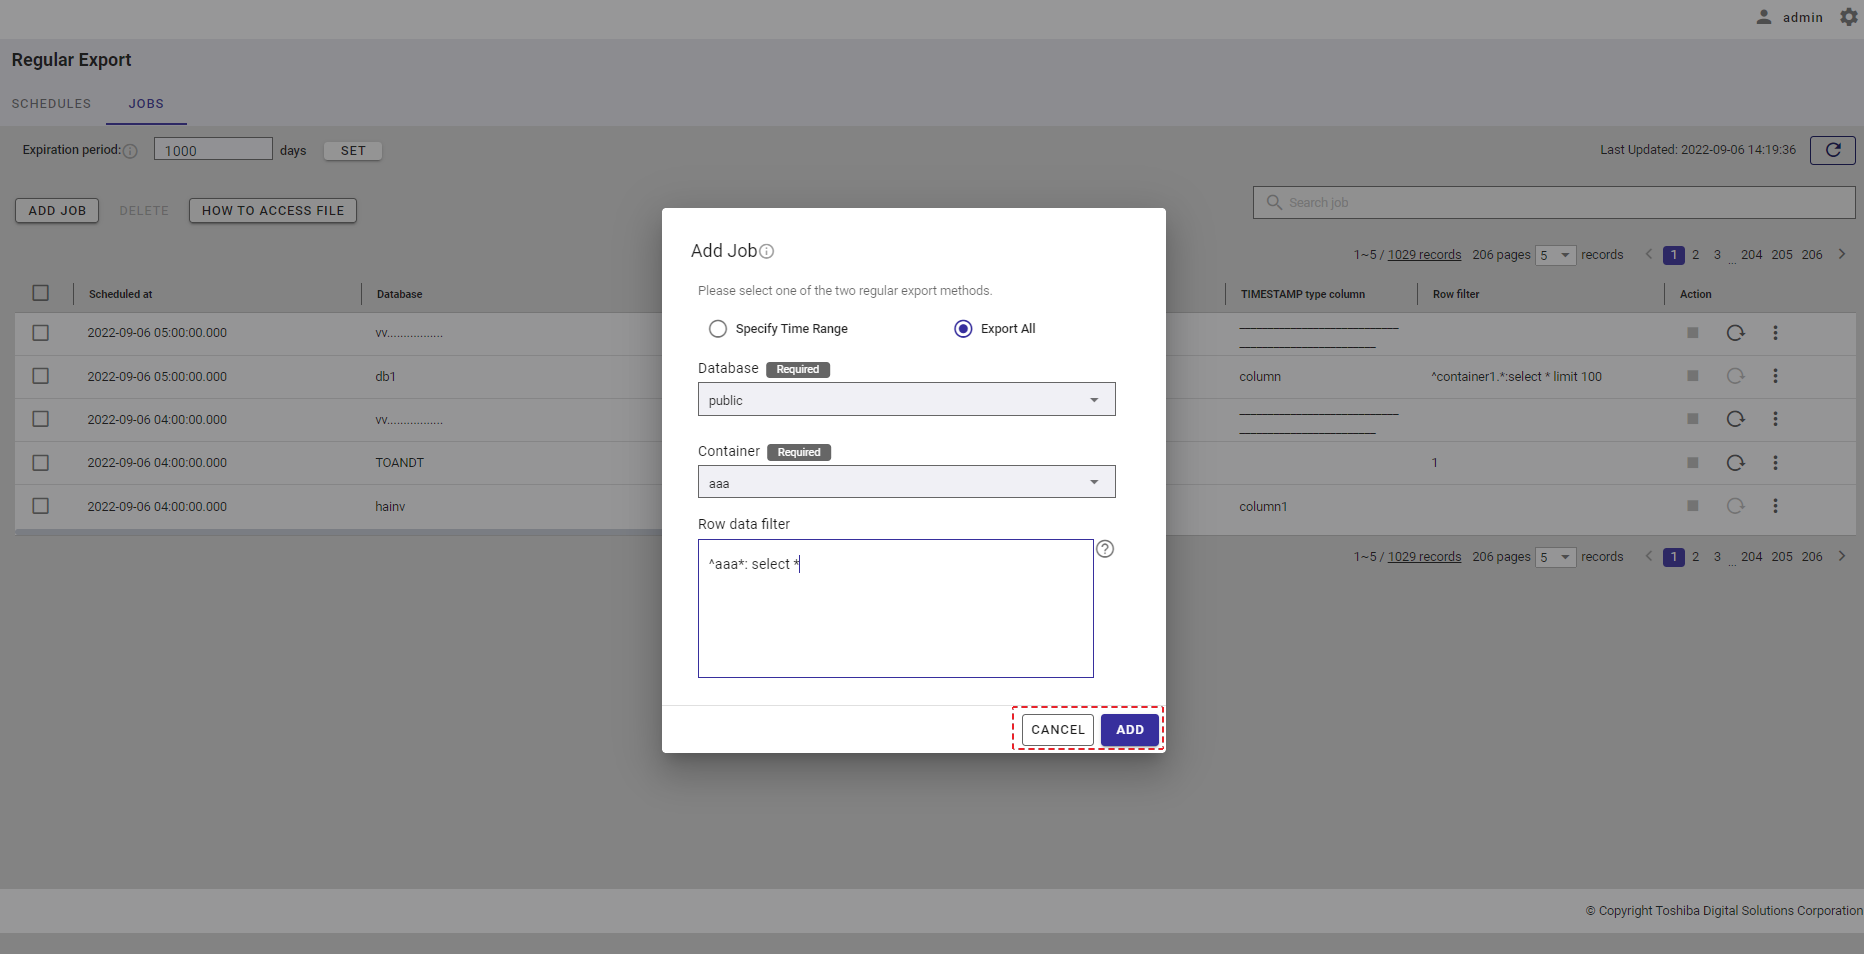
- After it is successfully added, the job goes into waiting status and then into running status.
- if the job is successfully executed, the status changes to 'Success.'
- If the job execution fails, the status changes to 'Failed.'
4.15.5 Deleting a job
This function deletes a job record.
Step 1: To delete a job and a corresponding exported file, click the three vertical dots (①) in the 'More Options' menu on the right of the job item and then click the [Delete] button (②).
[Note]: Jobs that are currently running cannot be deleted using the delete job command.
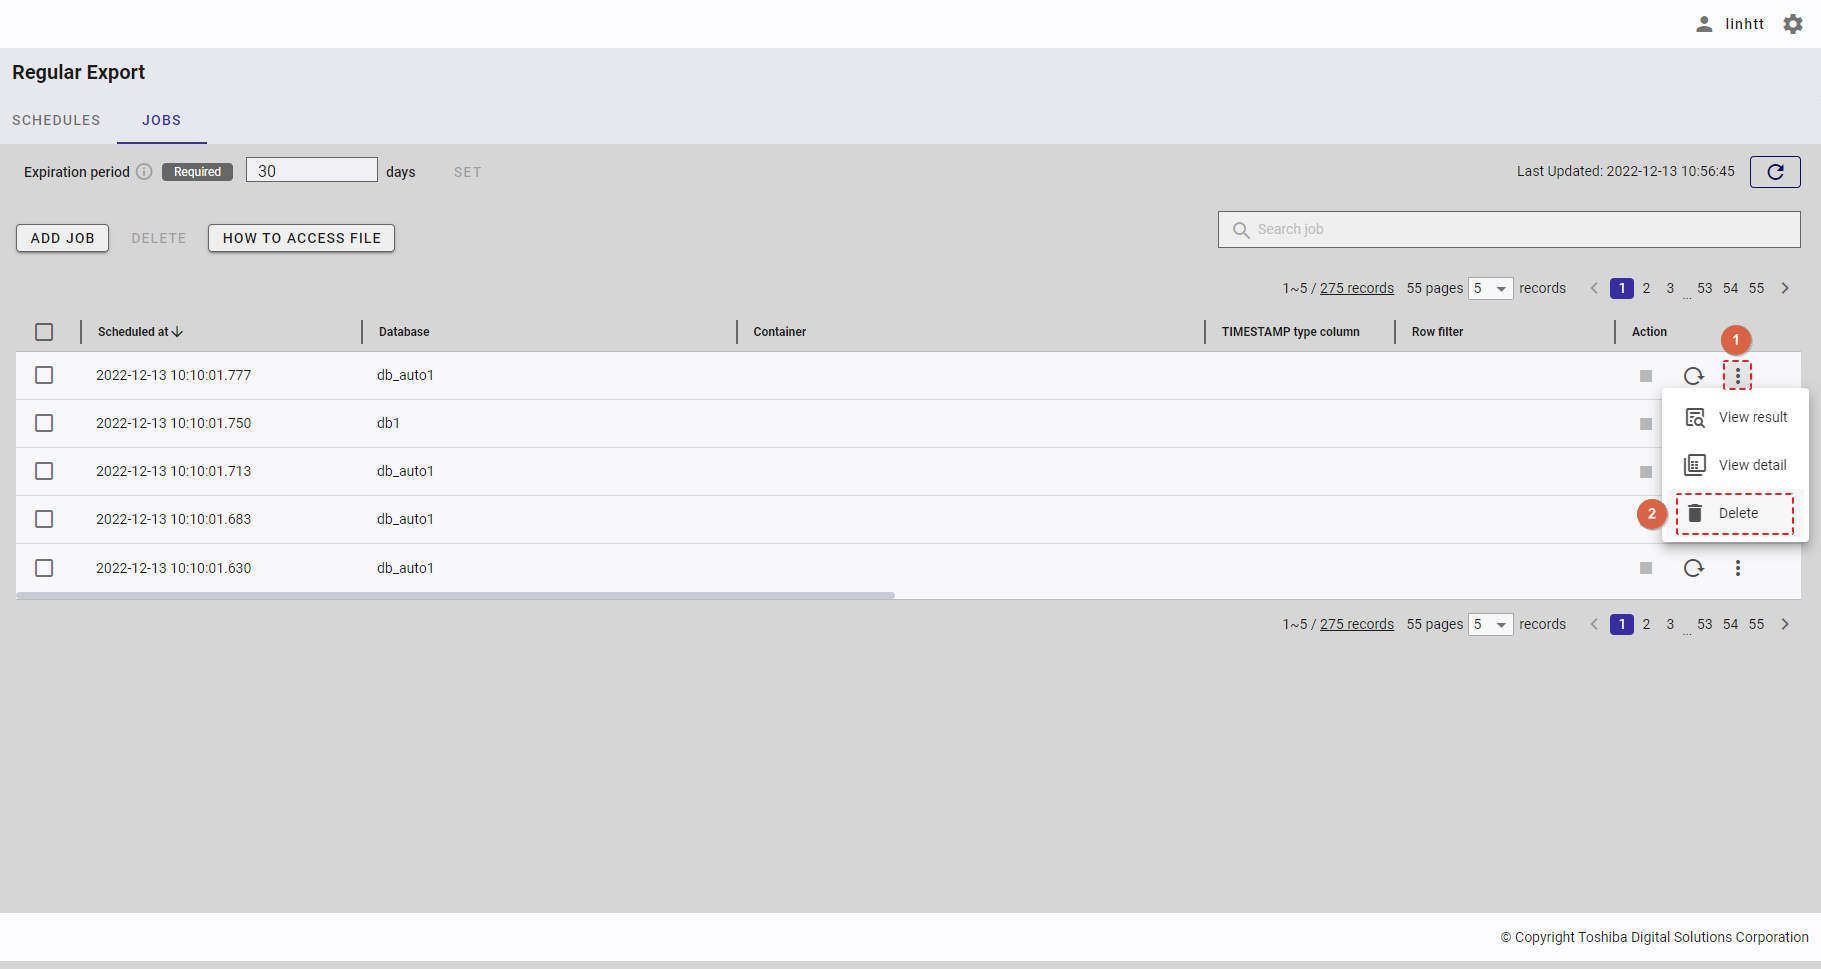
Step 2: Once the confirmation dialog is displayed, click the [YES] button to continue to delete the job record. Or click the [NO] button to go back to the Regular Export Jobs screen without deleting the job record.
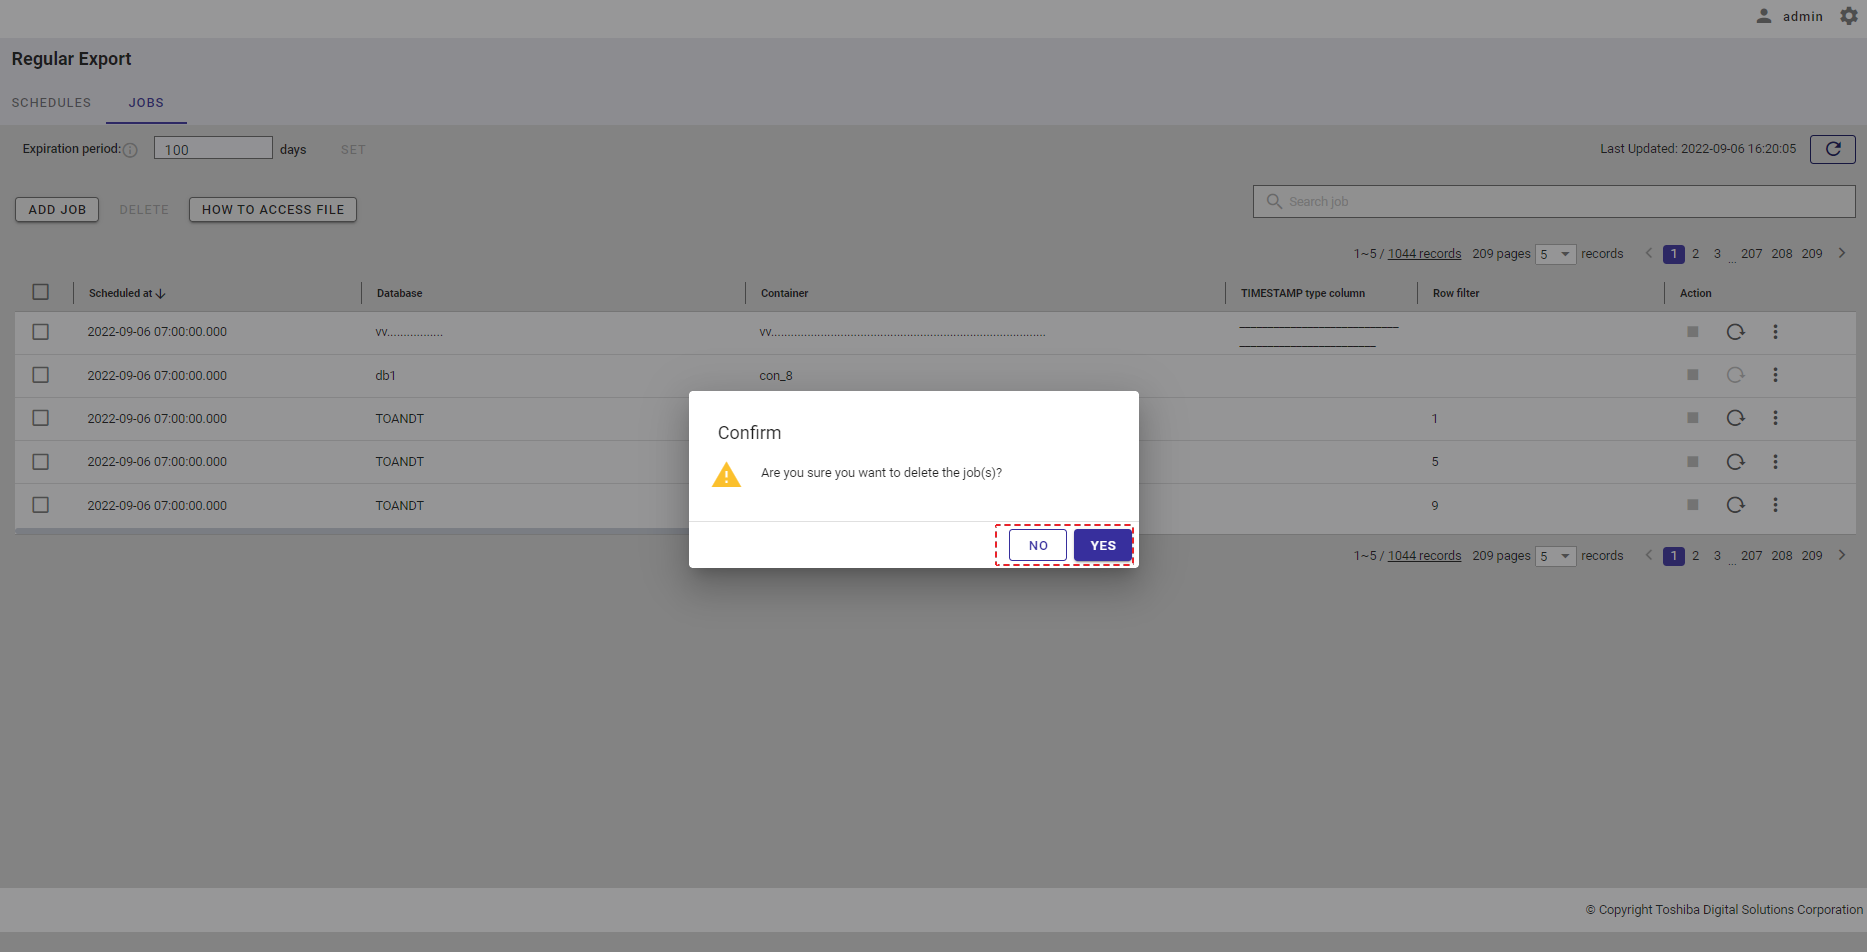
When the job record is successfully deleted, the system will go back to the Regular Export Jobs screen where the deleted job record is not found.
4.15.6 Deleting multiple jobs
Step 1: To delete multiple jobs and their corresponding exported files, check the checkbox for the job records to delete on the left of each job record (①). Or click the top checkbox (②) on the left to select all the job records on the same page.
Click the [DELETE] button (③). To validate the button, at least one job record must be selected.
[Note]: Jobs that are currently running cannot be deleted using the delete job command.
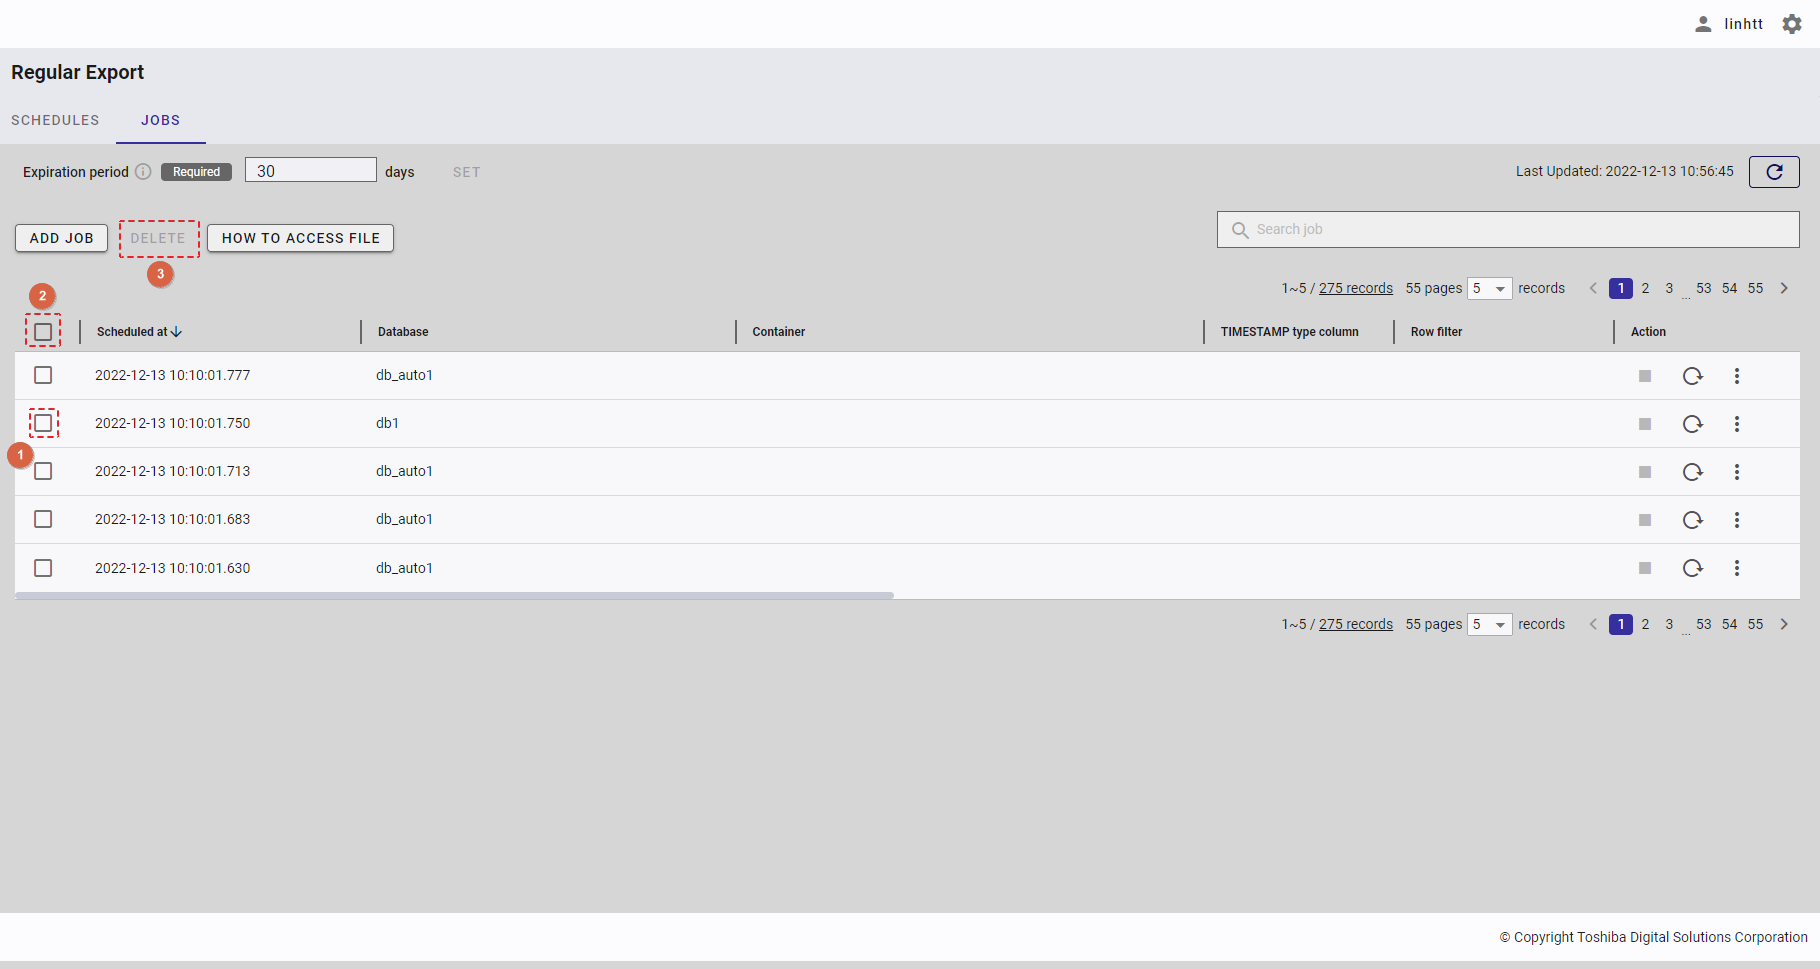
Step 2: Once the confirmation dialog is displayed, click the [YES] button to continue to delete the job records. Or click the [NO] button to go back to the Regular Export Jobs screen without deleting the job records.
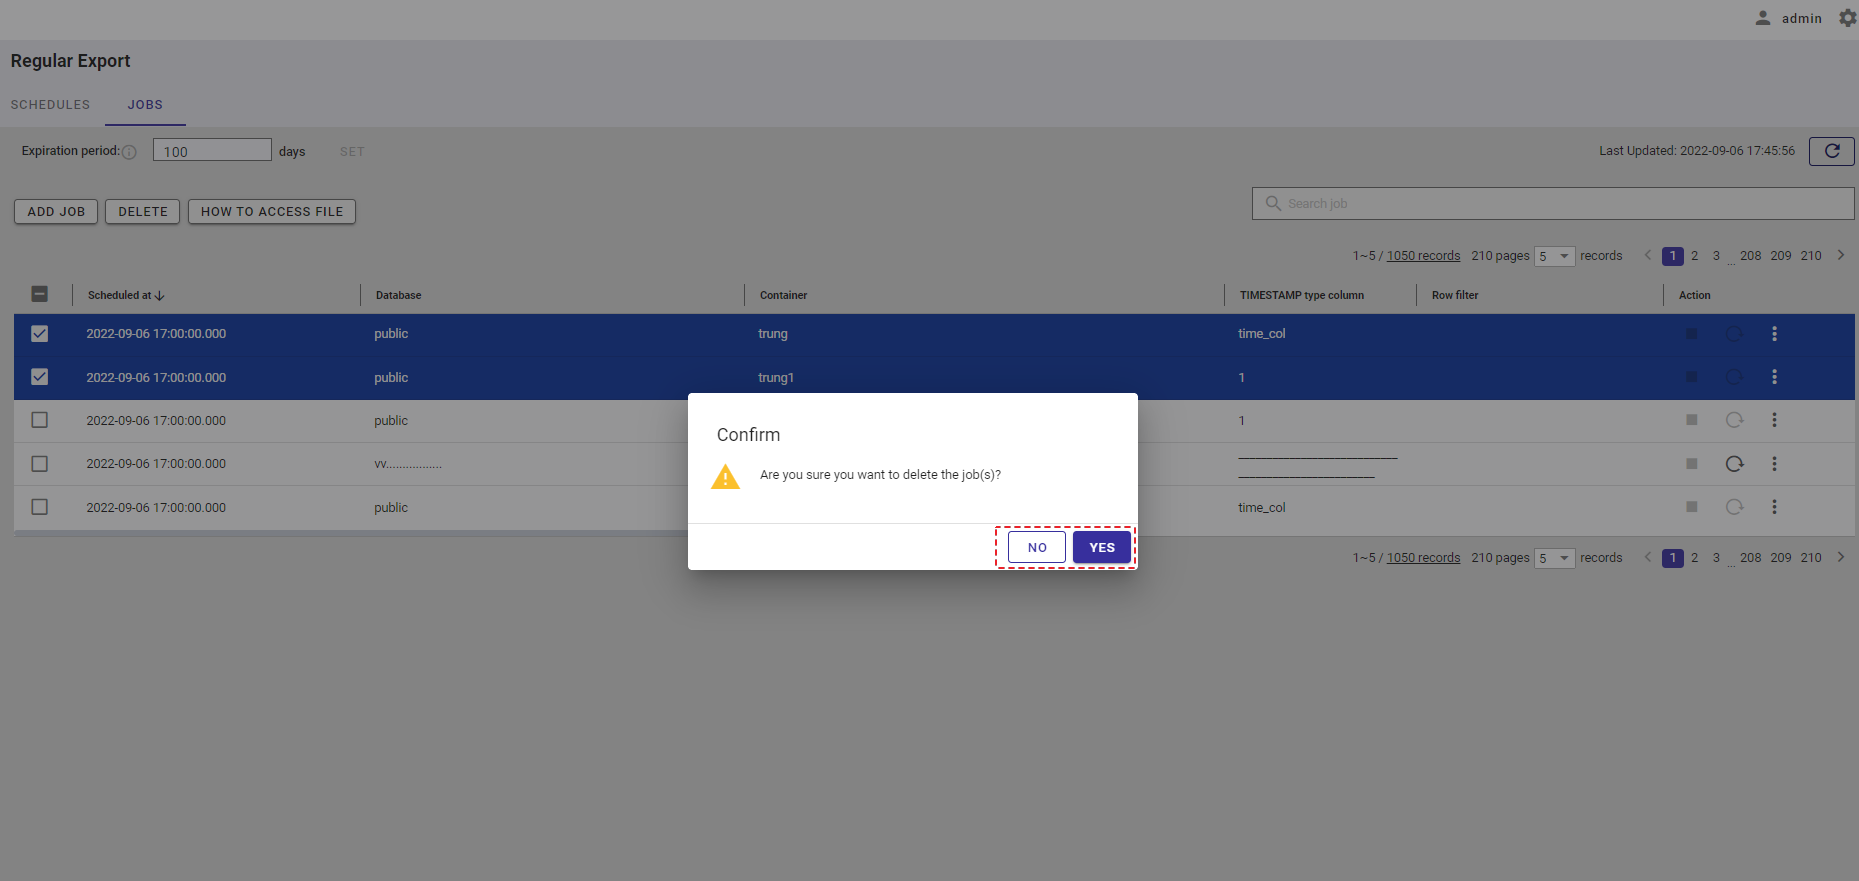
When the job records are successfully deleted, the system will go back to the regular export jobs screen where deleted jobs records are not found.
4.15.7 Retrying a job
You can retry the execution of a failed job.
Step 1: To retry a job, click the [Retry] icon (①) on the right of the job record. The icon is activated when a job fails.
Step 2: Once the confirmation dialog is displayed, click the [YES] button to continue to retry the job. Or click the [NO] button to close the confirmation dialog and go back to the Regular Export Jobs screen.
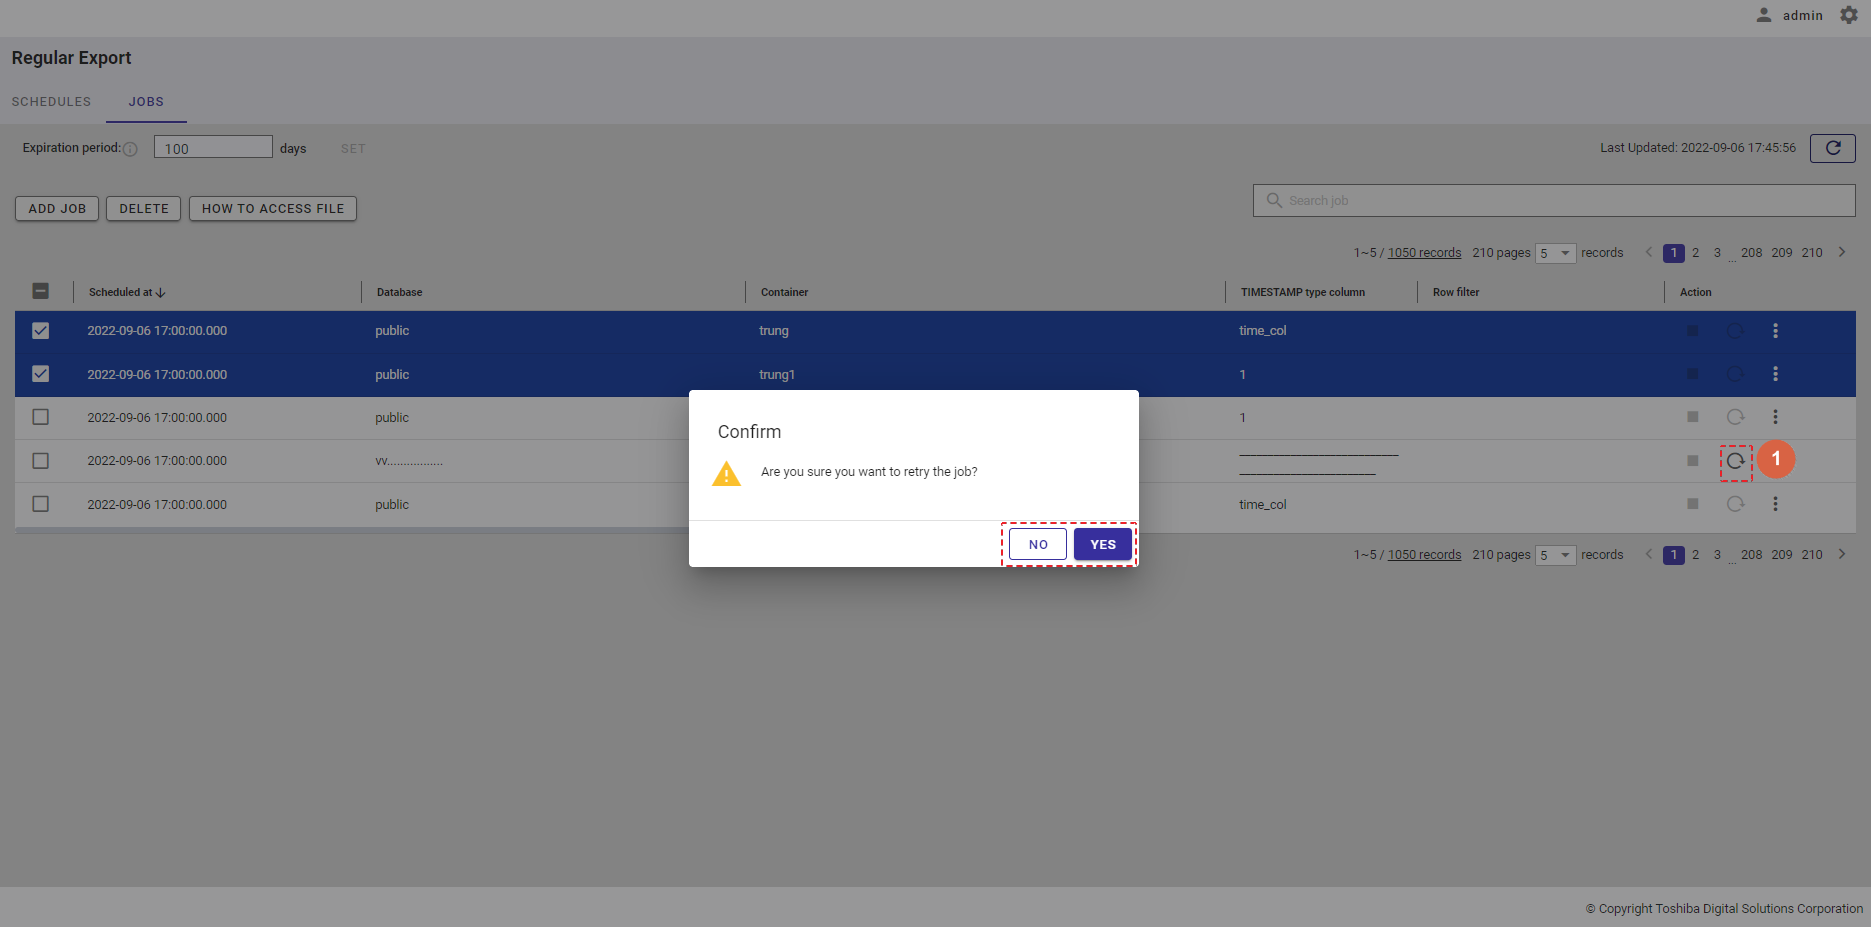
4.15.8 Stopping a job
A job can be stopped while it is running.
Step 1: To stop a job, click the red [Stop] icon (①) on the right of the job record. The icon is activated when the job status is 'Running.'
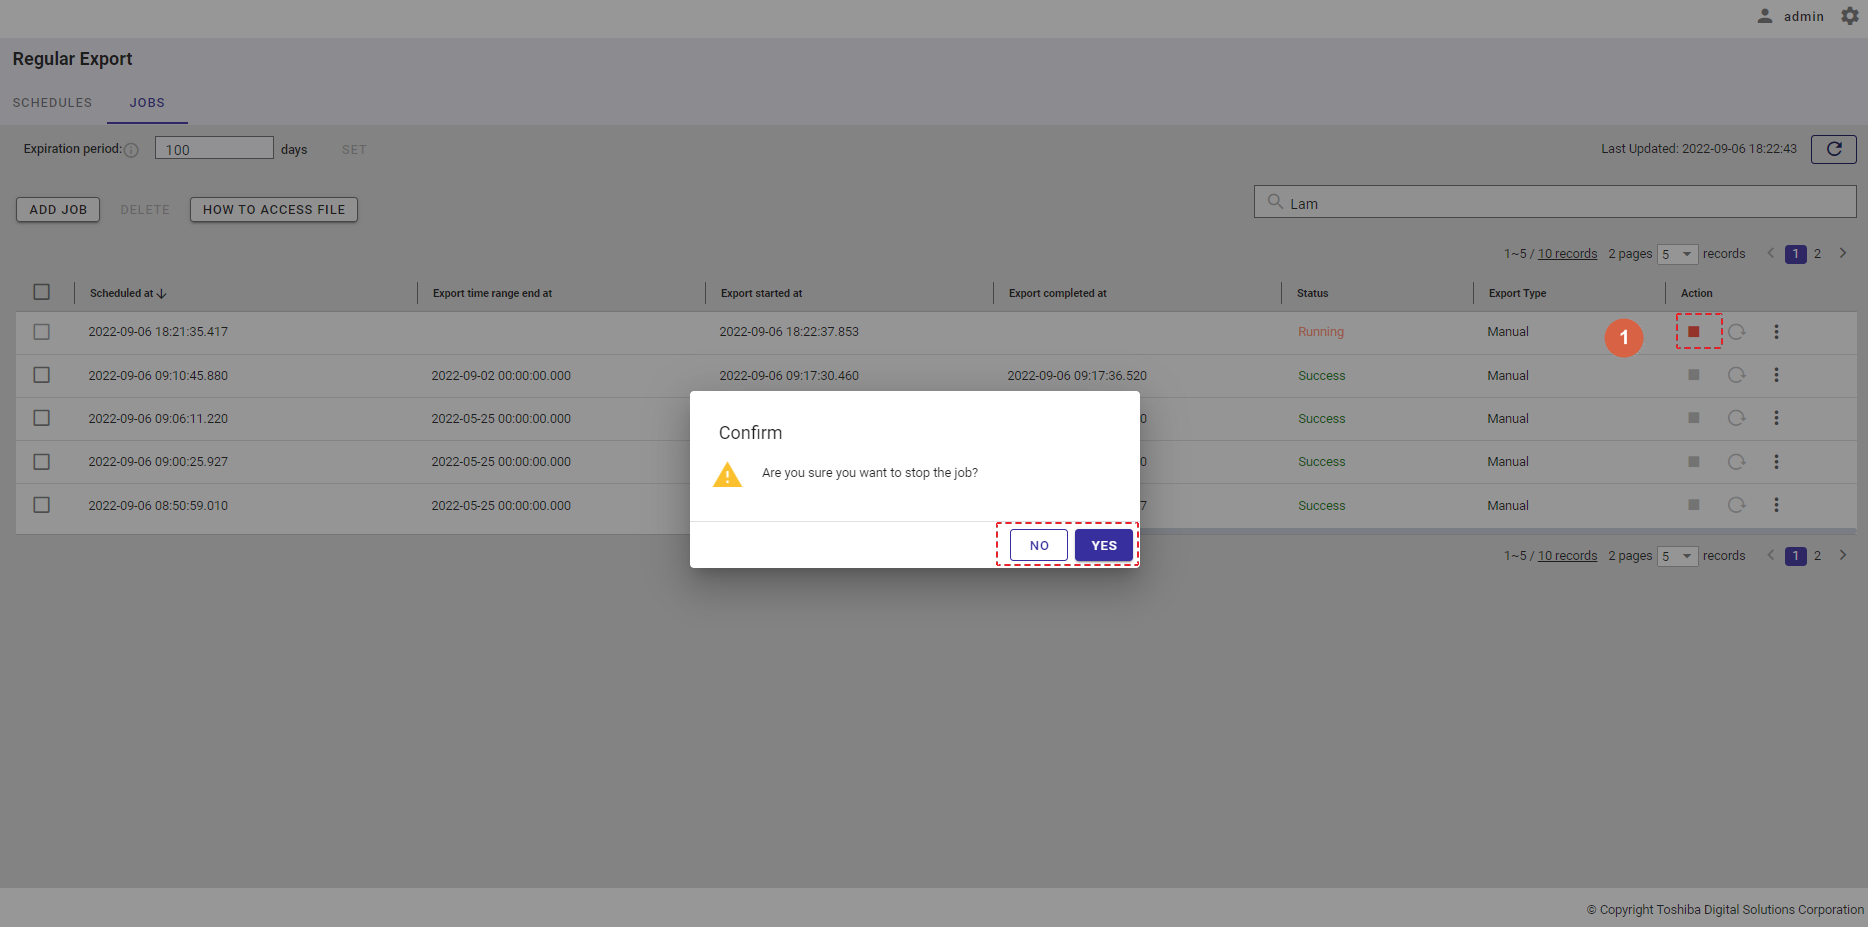
Step 2: Once the confirmation dialog is displayed, click the [YES] button to continue to stop the job. Or click the [NO] button to close the confirmation dialog and go back to the Regular Export jobs screen.
When the job is successfully stopped, the job status changes to 'Failed.'
4.15.9 Viewing results
This function displays job results after export data jobs are run.
Step 1: To view the results of a job, click the three vertical dots (①) in the 'More Options' menu and then the [View result] button (②) on the right of the job item.
Step 2: After the button is clicked, the Export result screen (③) is displayed.
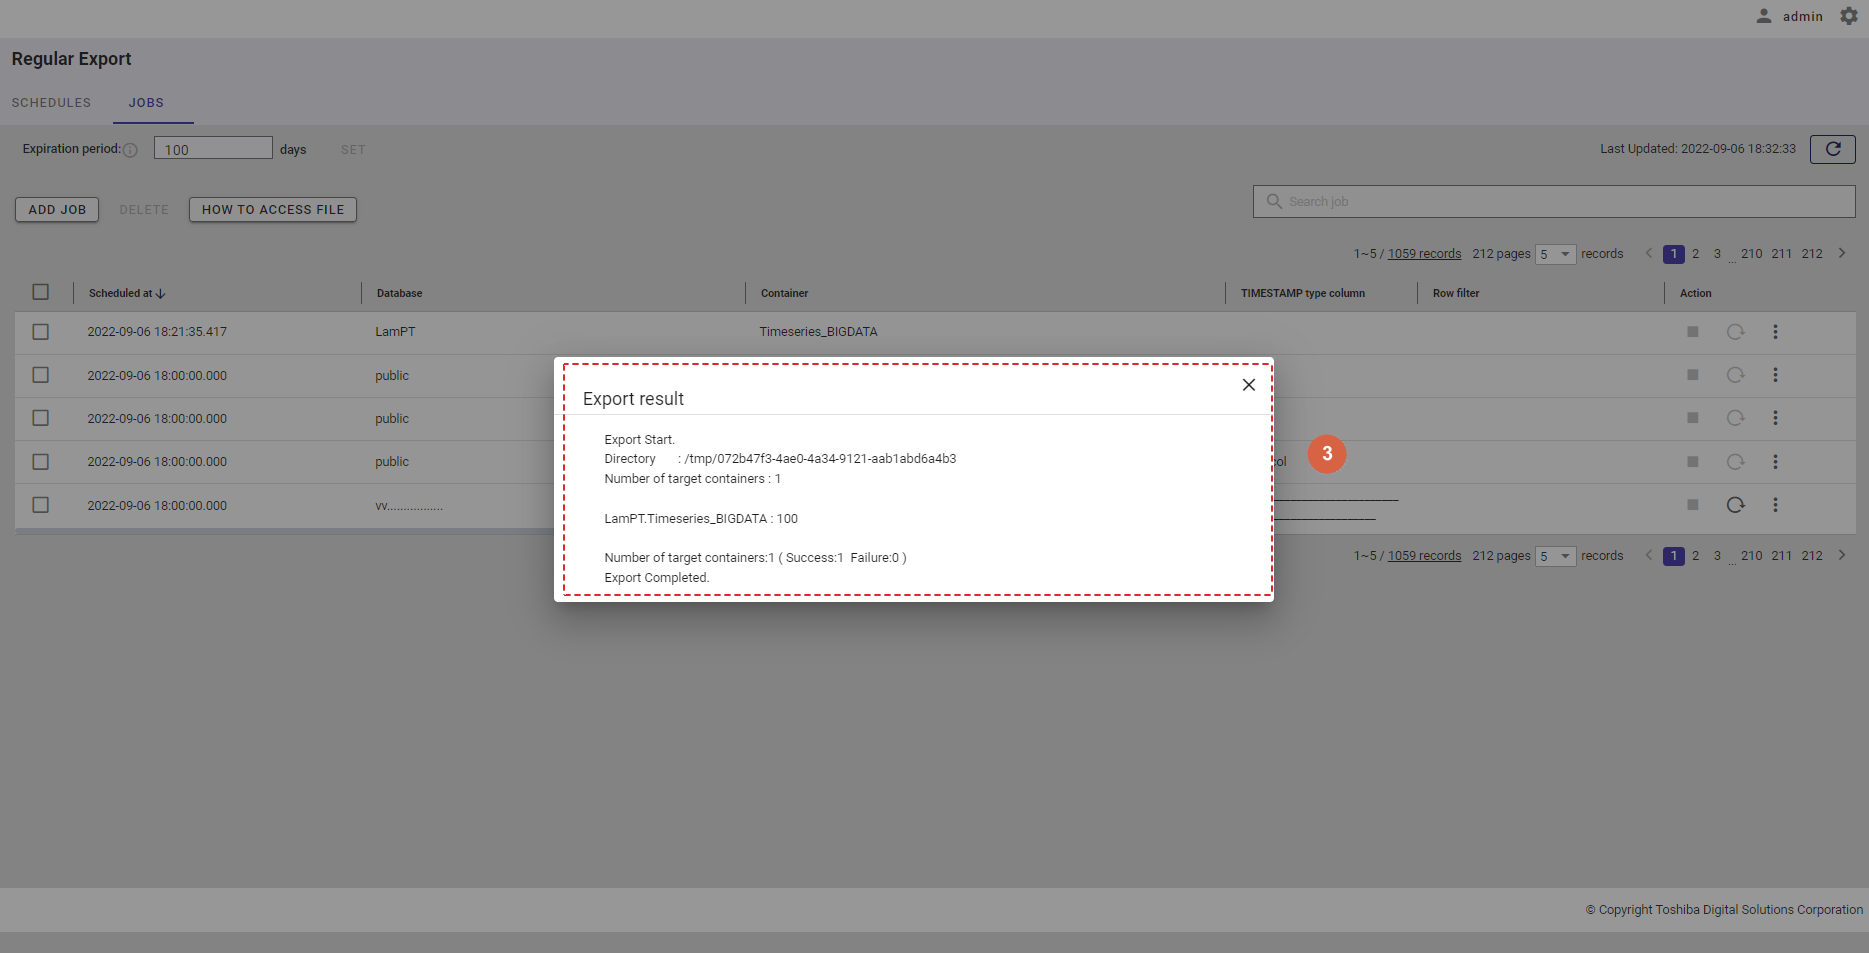
4.15.10 Viewing job detail
This function displays job detail after export data jobs are run.
Step 1: To view the detail of a job, click the three vertical dots (①) in the 'More Options' menu and then the [View detail] button (②) on the right of the job item.
Step 2: The [View row data detail] screen will appear.
You can choose the number of records displayed on one page by selecting the number from [5, 10, 15, All] (①) at the top or bottom of the page. Click the [Next] button (②) or the [Back] button (③), or click the page number (④) to view another page.
You can sort the list of row data by container, by TIMESTAMP type column, by row filter, or by export method, by clicking the header (⑤) of each column.
You can adjust the column size by drag and drop the vertical bar "|" on the header.
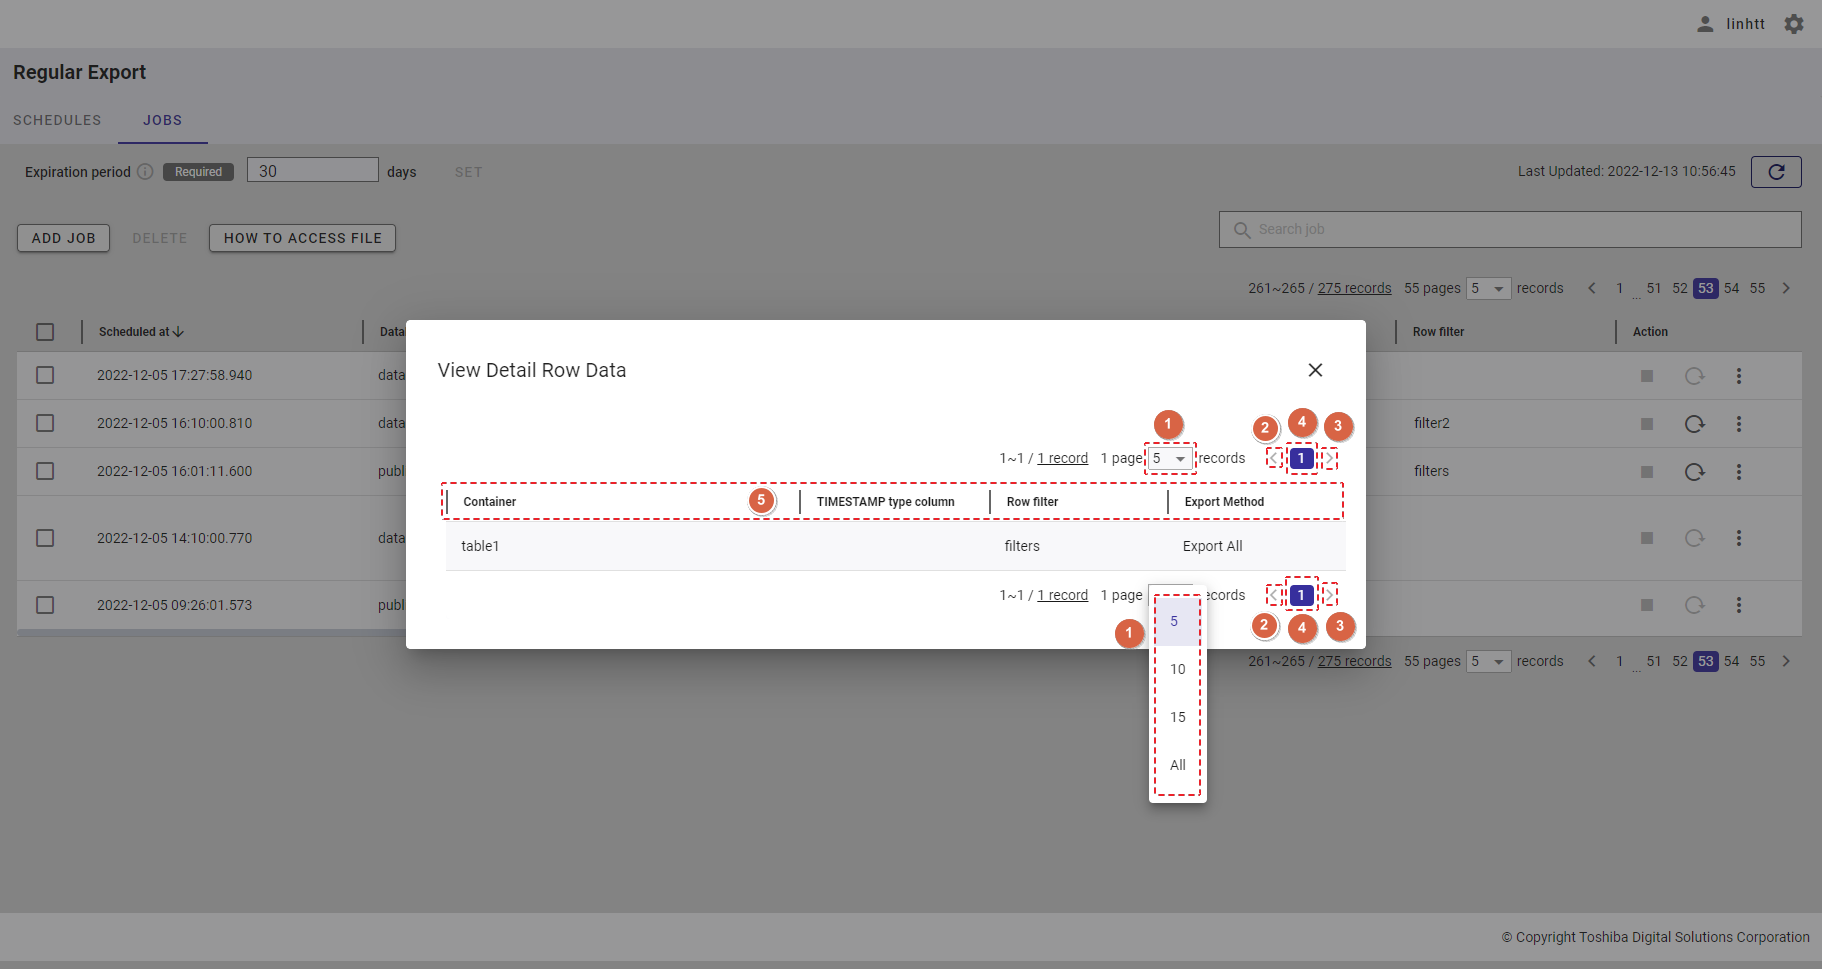
4.15.11 Storage access information
This function provides information on how to access exported files.
Step 1: Click the [HOW TO ACCESS FILE] button (①).
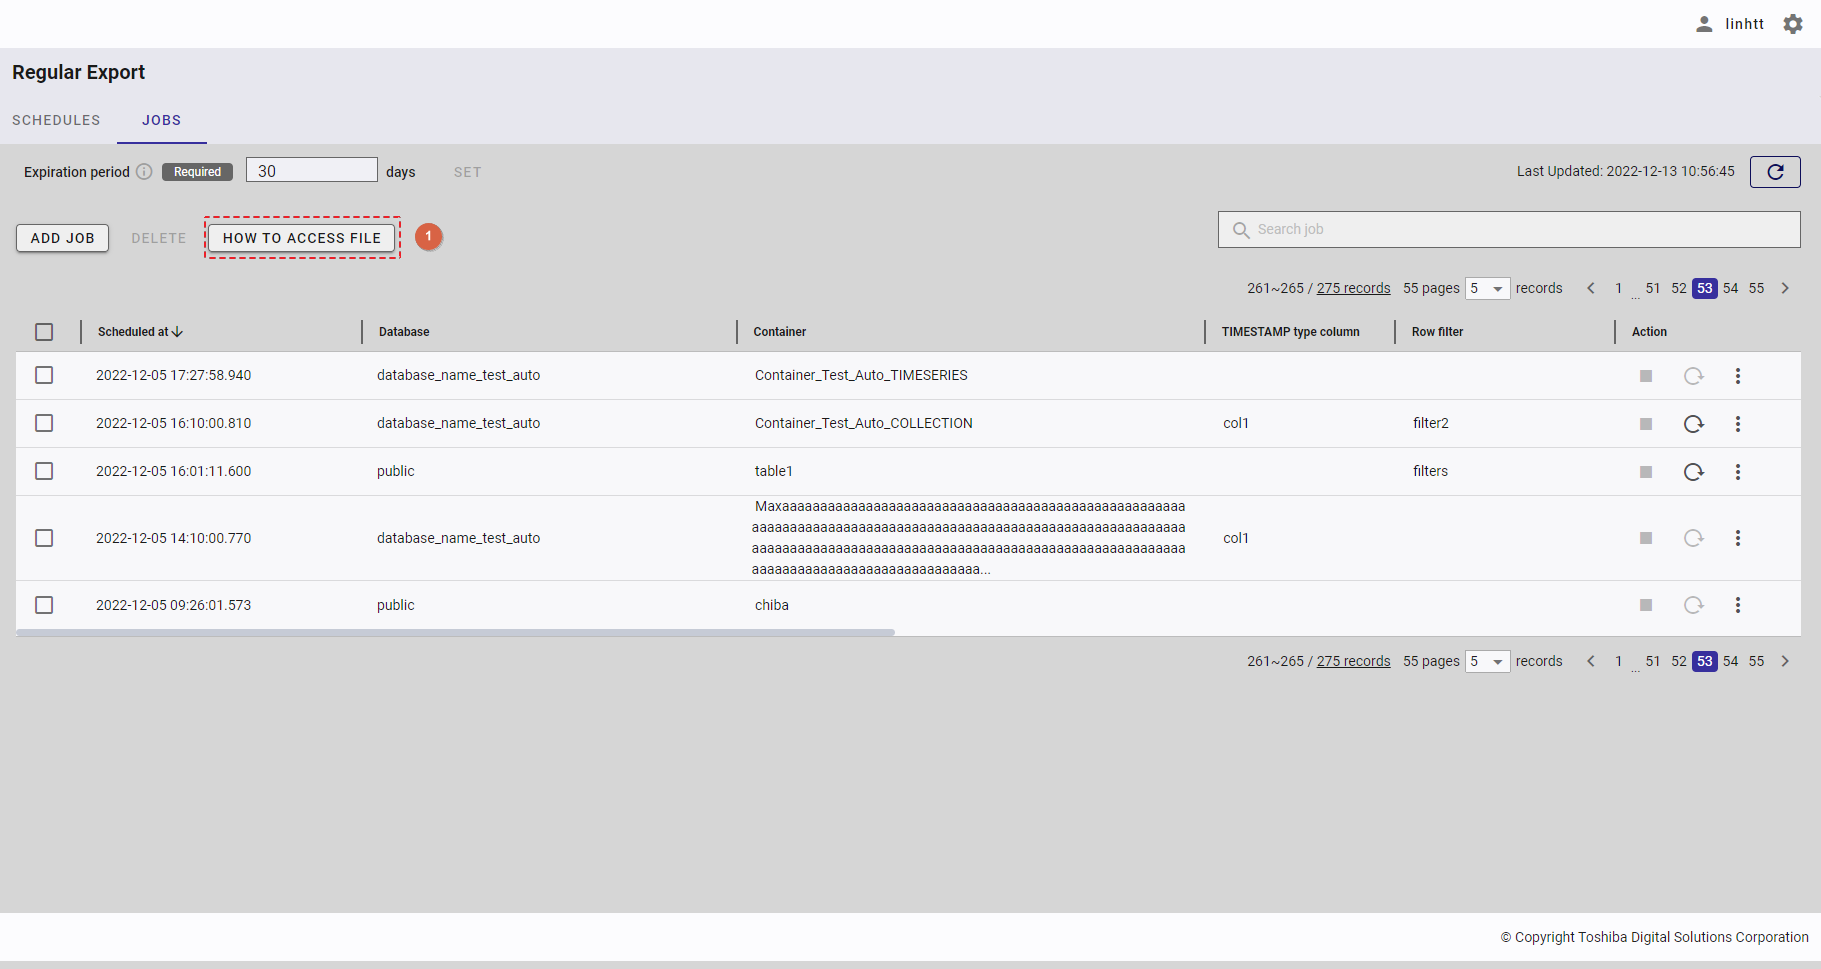
Step 2: On the 'How to access file' screen, click the first expand icon (v) to open the [Overview] tab.
The fraction (⑥) shows the ratio of the current Blob Storage usage to the maximum Blob Storage usage. If the ratio is greater than 1, export cannot be performed. Delete existing jobs to reduce the current usage.
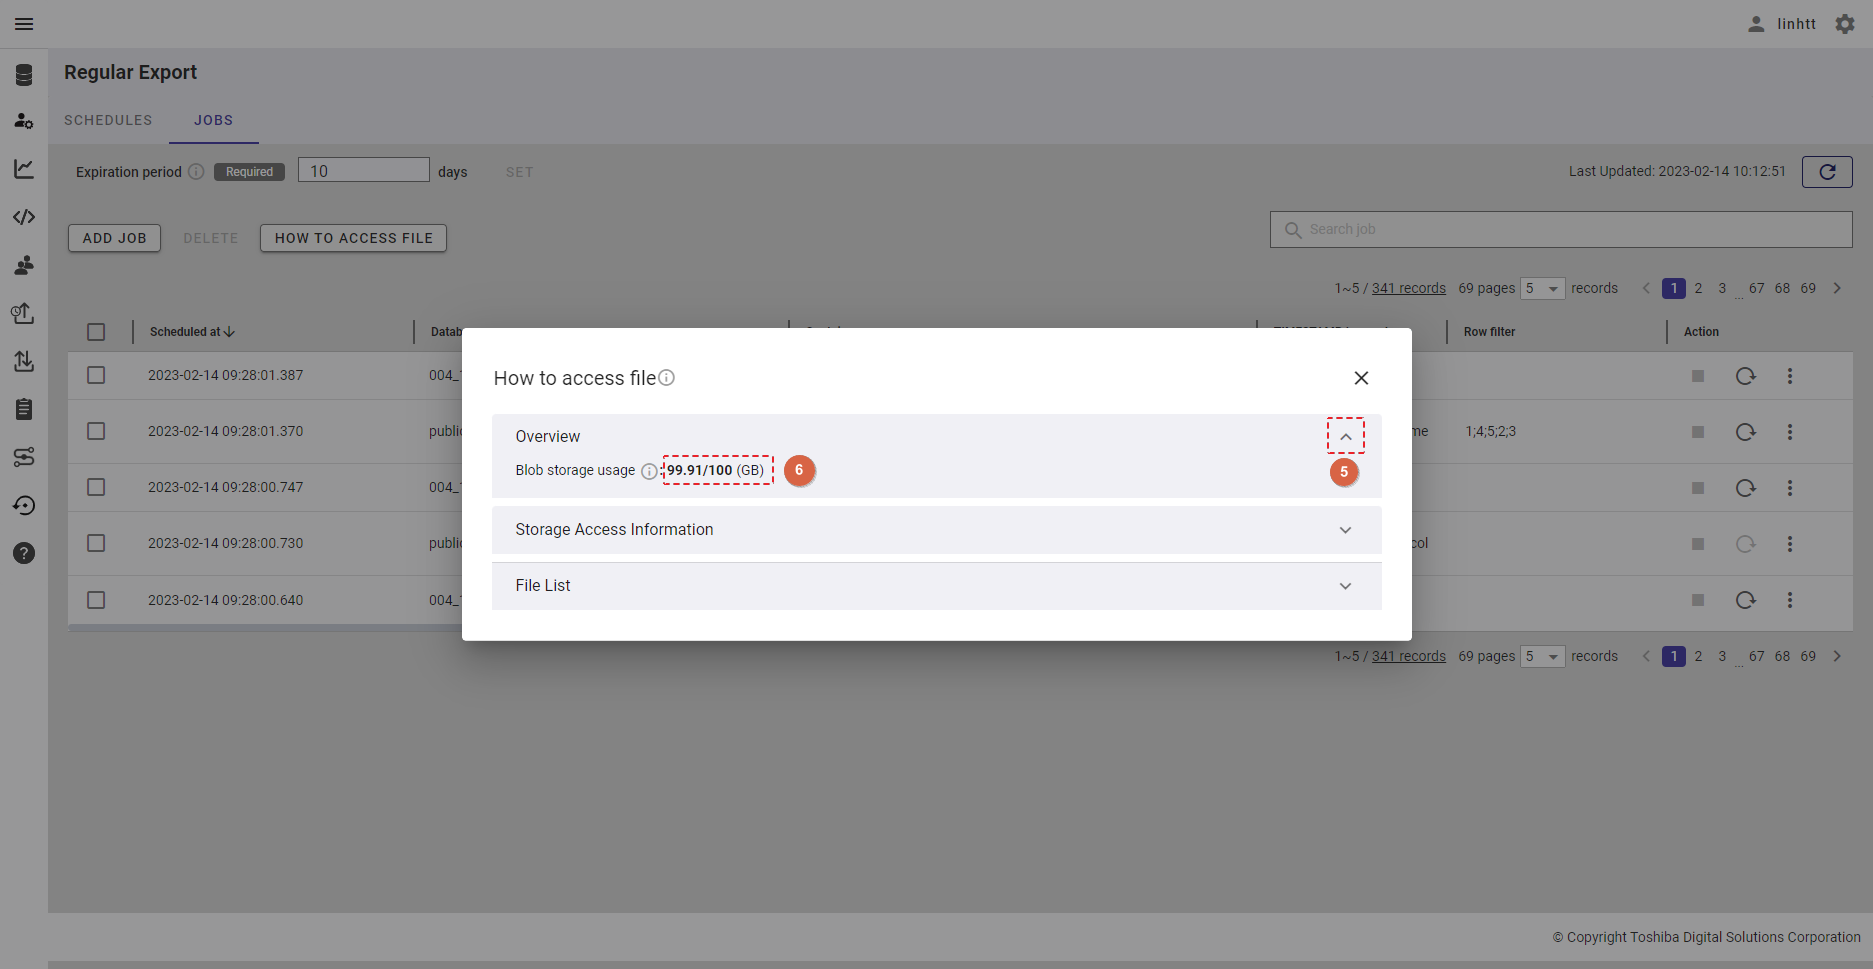
Step 3: On the 'How to access file' screen, click the second expand icon (v) (②) to open the [Storage Access Information] tab.
Step 4: The following information (Storage Account and Container Name)is displayed; note the information for future reference.
- [Storage Account] contains all of your Azure Storage data objects including blobs, file shares, queues, tables, and disks. [Storage Account] also contains the following [Container Name].
- [Container Name] is the name of an Azure container where regular export files are saved.
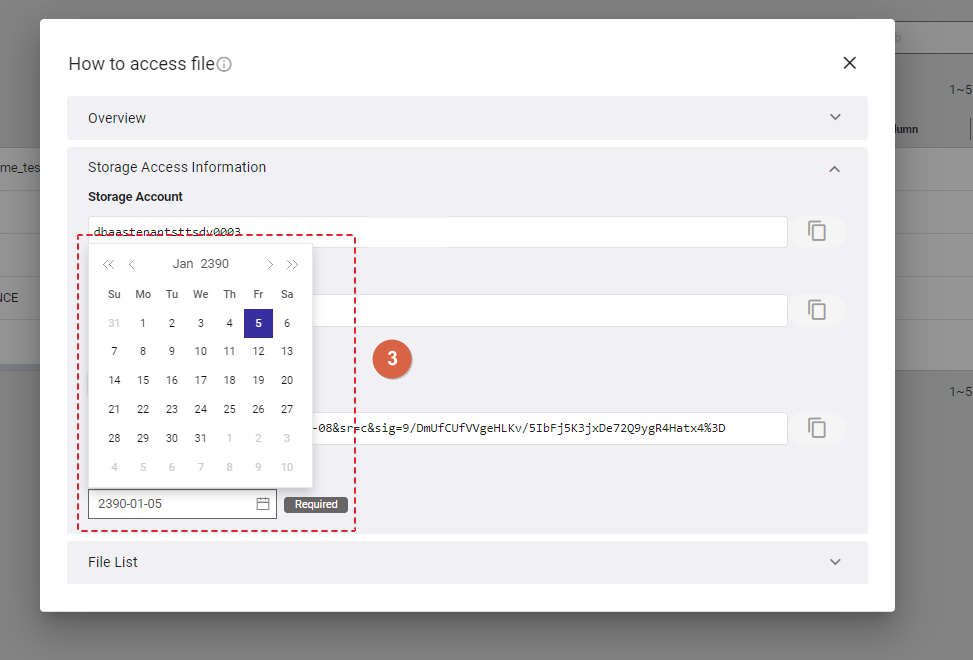
Step 5: To generate a SAS token needed for file access, enter the expiration date of this token in the [Expiry Date] date field (③) and click the [GENERATE SAS TOKEN] button (④). This token has permissions to "read and delete files" and "display a file list", but does not grant permissions to create and update files. In Azure terminology, this token is called 'Shared Access Signature (SAS)'.
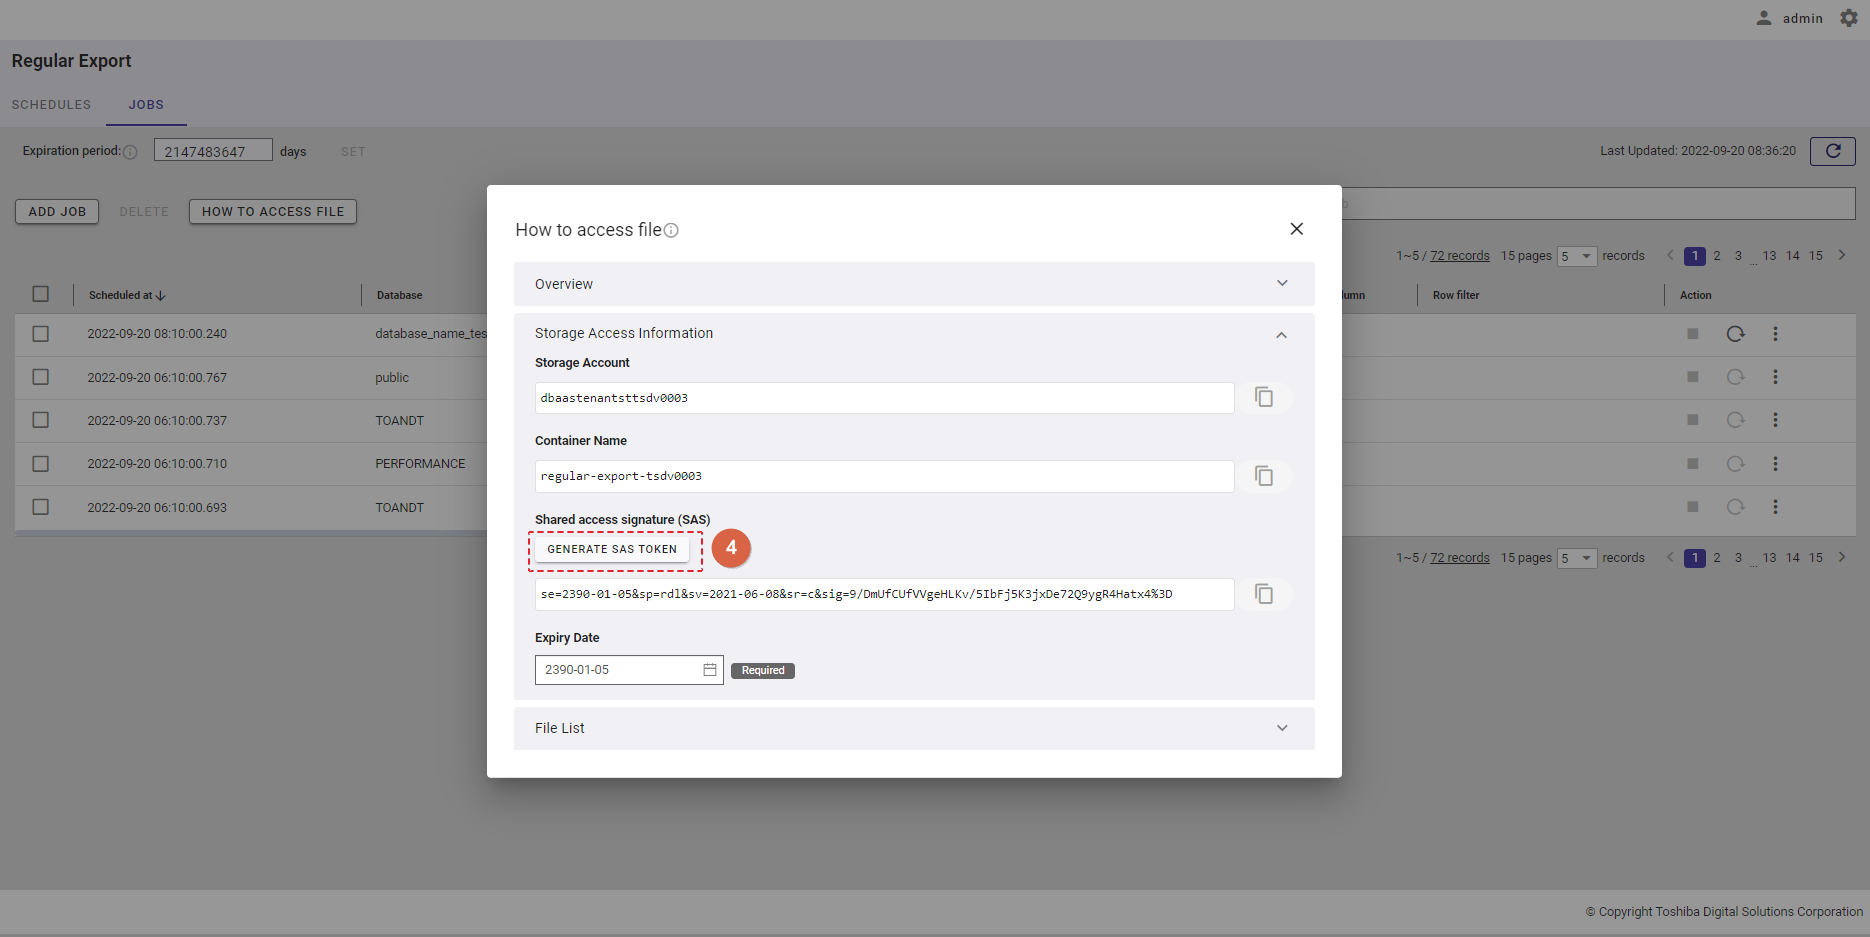
Step 6: To use services and tools to retrieve Azure Storage files, enter the information on the Storage Account, the Container Name, and the SAS in those services and tools. To manually retrieve files without using tools, proceed to the next step.
Step 7: On the 'How to access file' screen, click the third expand icon (v) (②) to open [File List] tab.
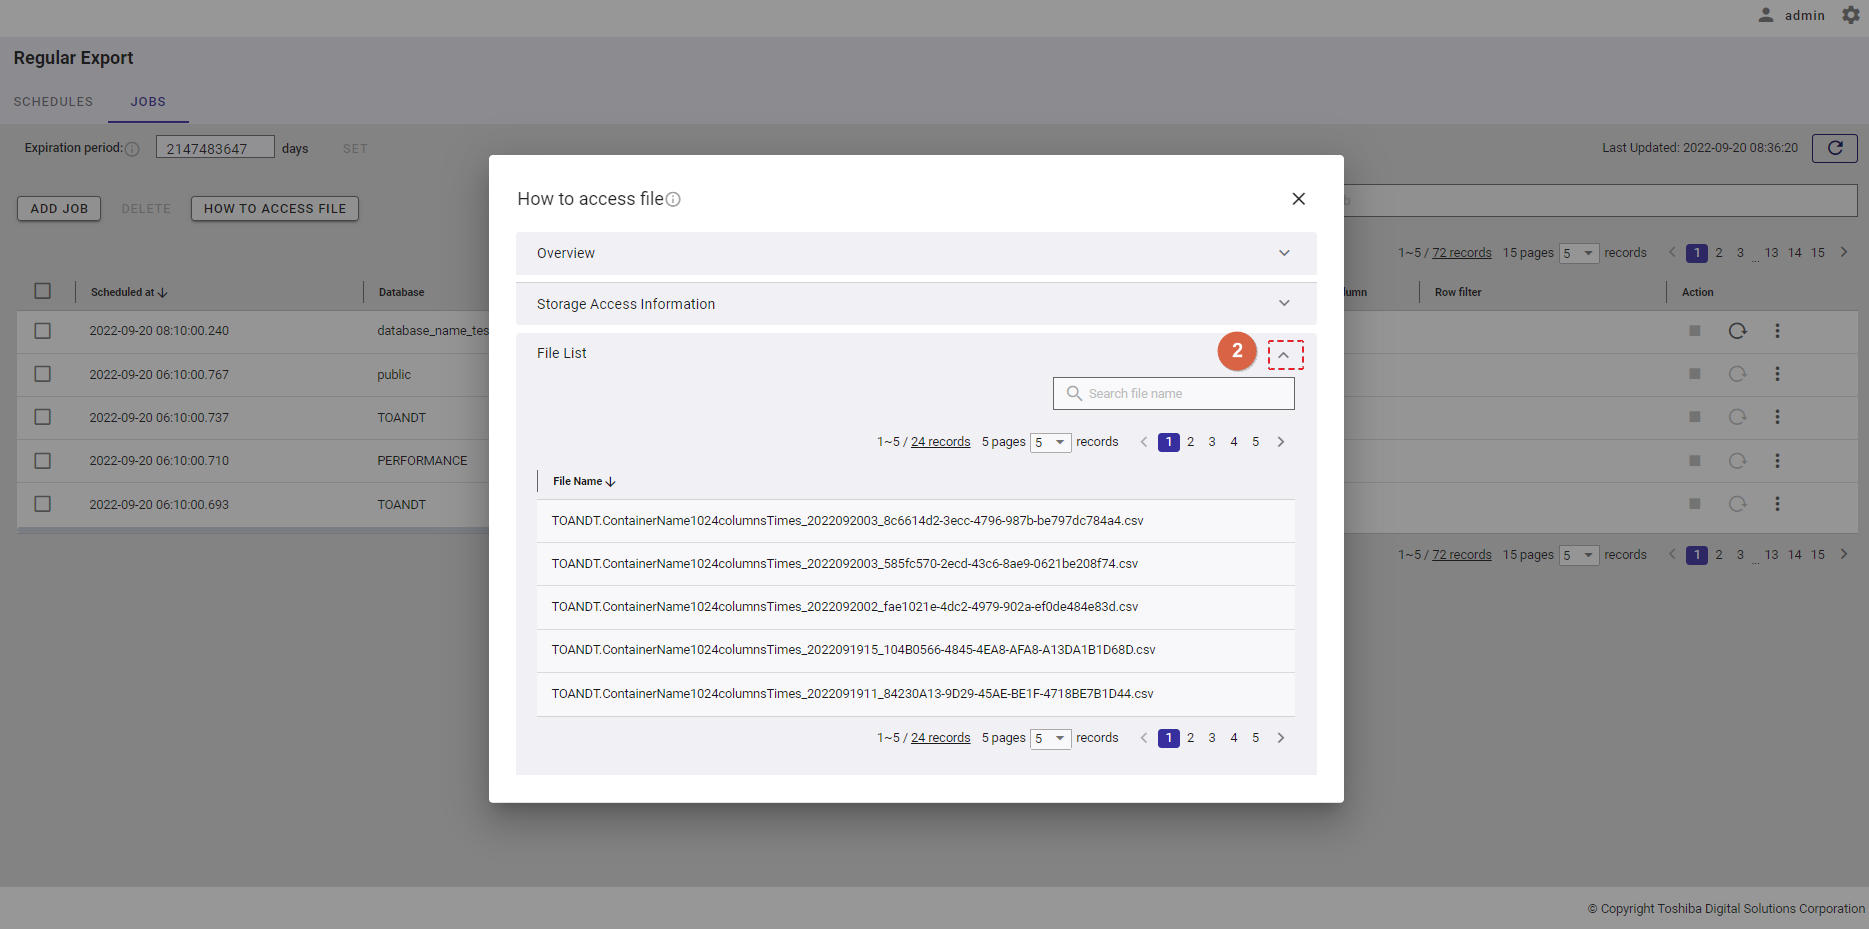
Step 8: Each file has the format [database.container_yyyyMMddHH_id.csv].
| Field | Description |
|---|---|
| yyyyMMddHH | time at which an export data job is run |
| id | job record id |
| database | database name |
| container | container name |
Step 9: To download an exported file in the file list above, enter the following corresponding URL into your browser.
https://[storage account] (①).blob.core.windows.net/[container name] (②)/[file name] (③)?[SAS token] (④)
The specified file will be downloaded (⑤).
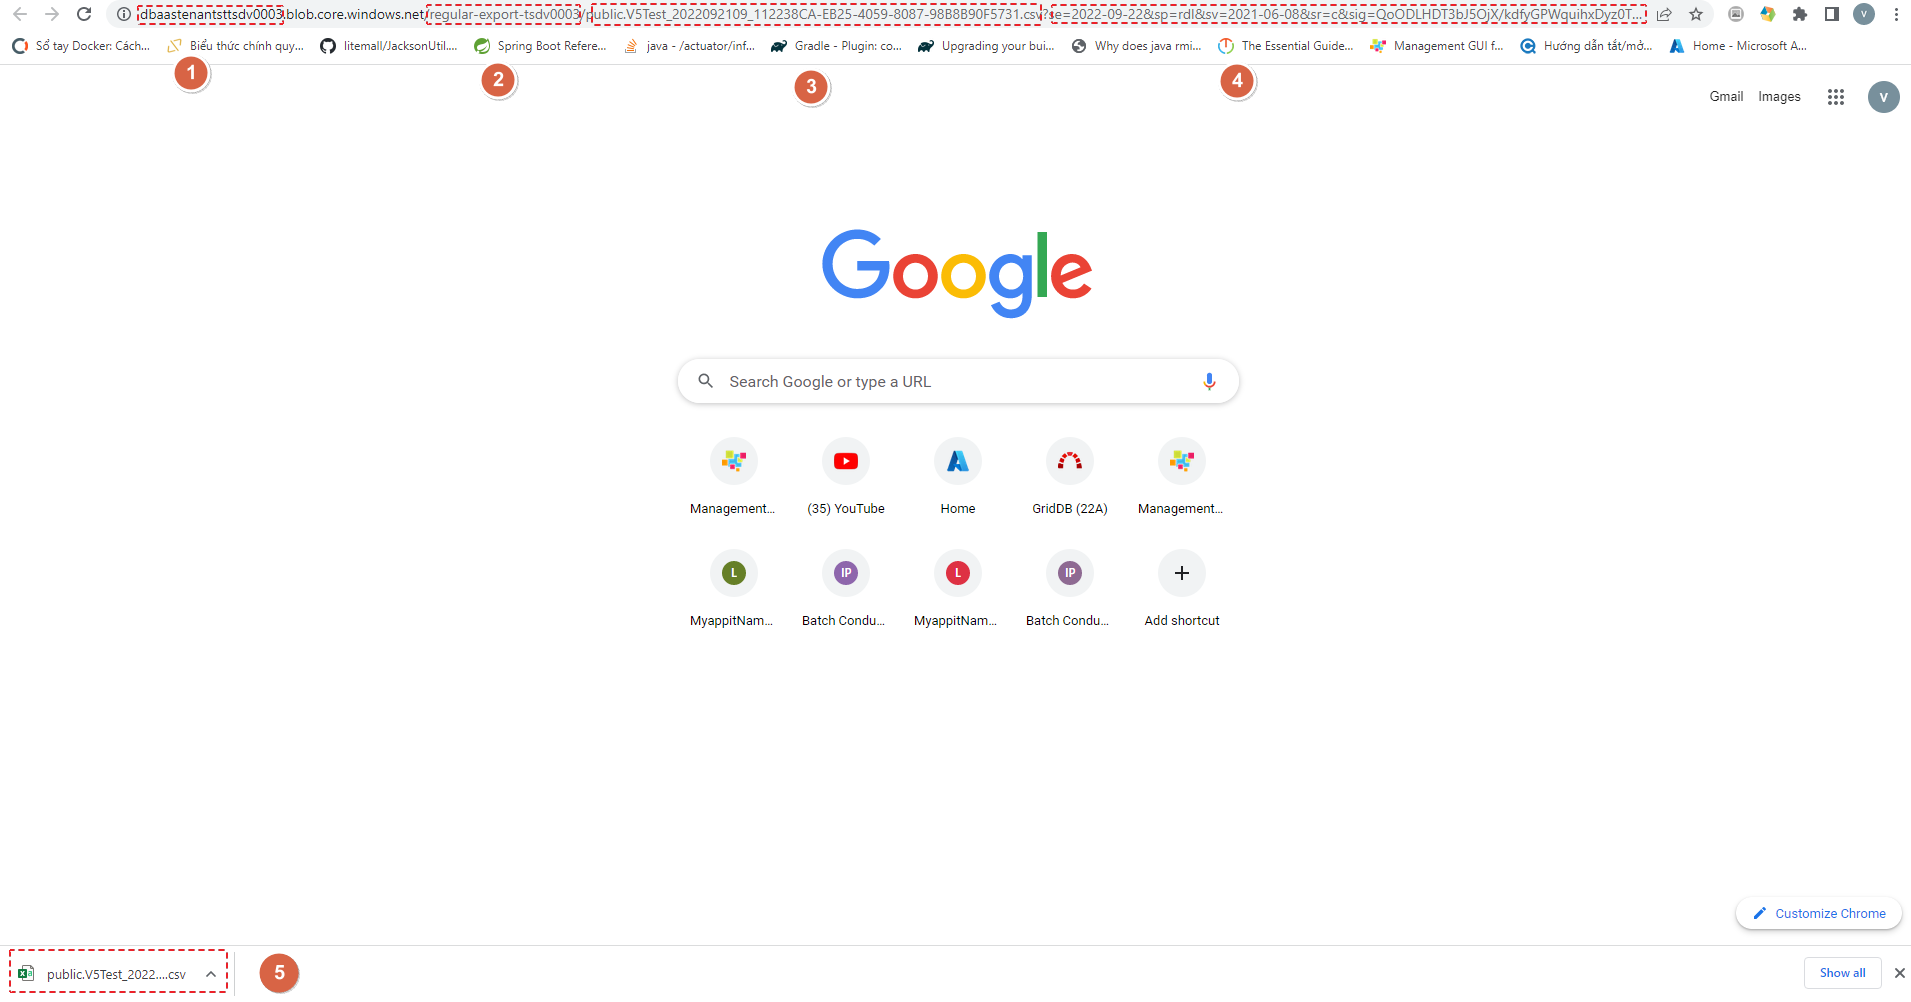
4.16 Export/Import function
This function is used for exporting or importing a database.
4.16.1 Available roles
In the table below, the role with a plus sign (+) can use the function on the left.
| No. | Function | General user | Administrator user |
|---|---|---|---|
| 1 | Display the Export/Import list | + | + |
| 2 | Export databases / containers | + | + |
| 3 | Download an exported database | + | + |
| 4 | View the Export/Import result | + | + |
| 5 | Import databases / containers | + | + |
| 6 | Import a local file | + | + |
| 7 | Delete an Export/Import item | + | + |
4.16.2 Displaying the Export/Import list
- To access the Export/Import list screen, first the user must log in to the system and then click the item [Export/Import] (①) in the left menu.
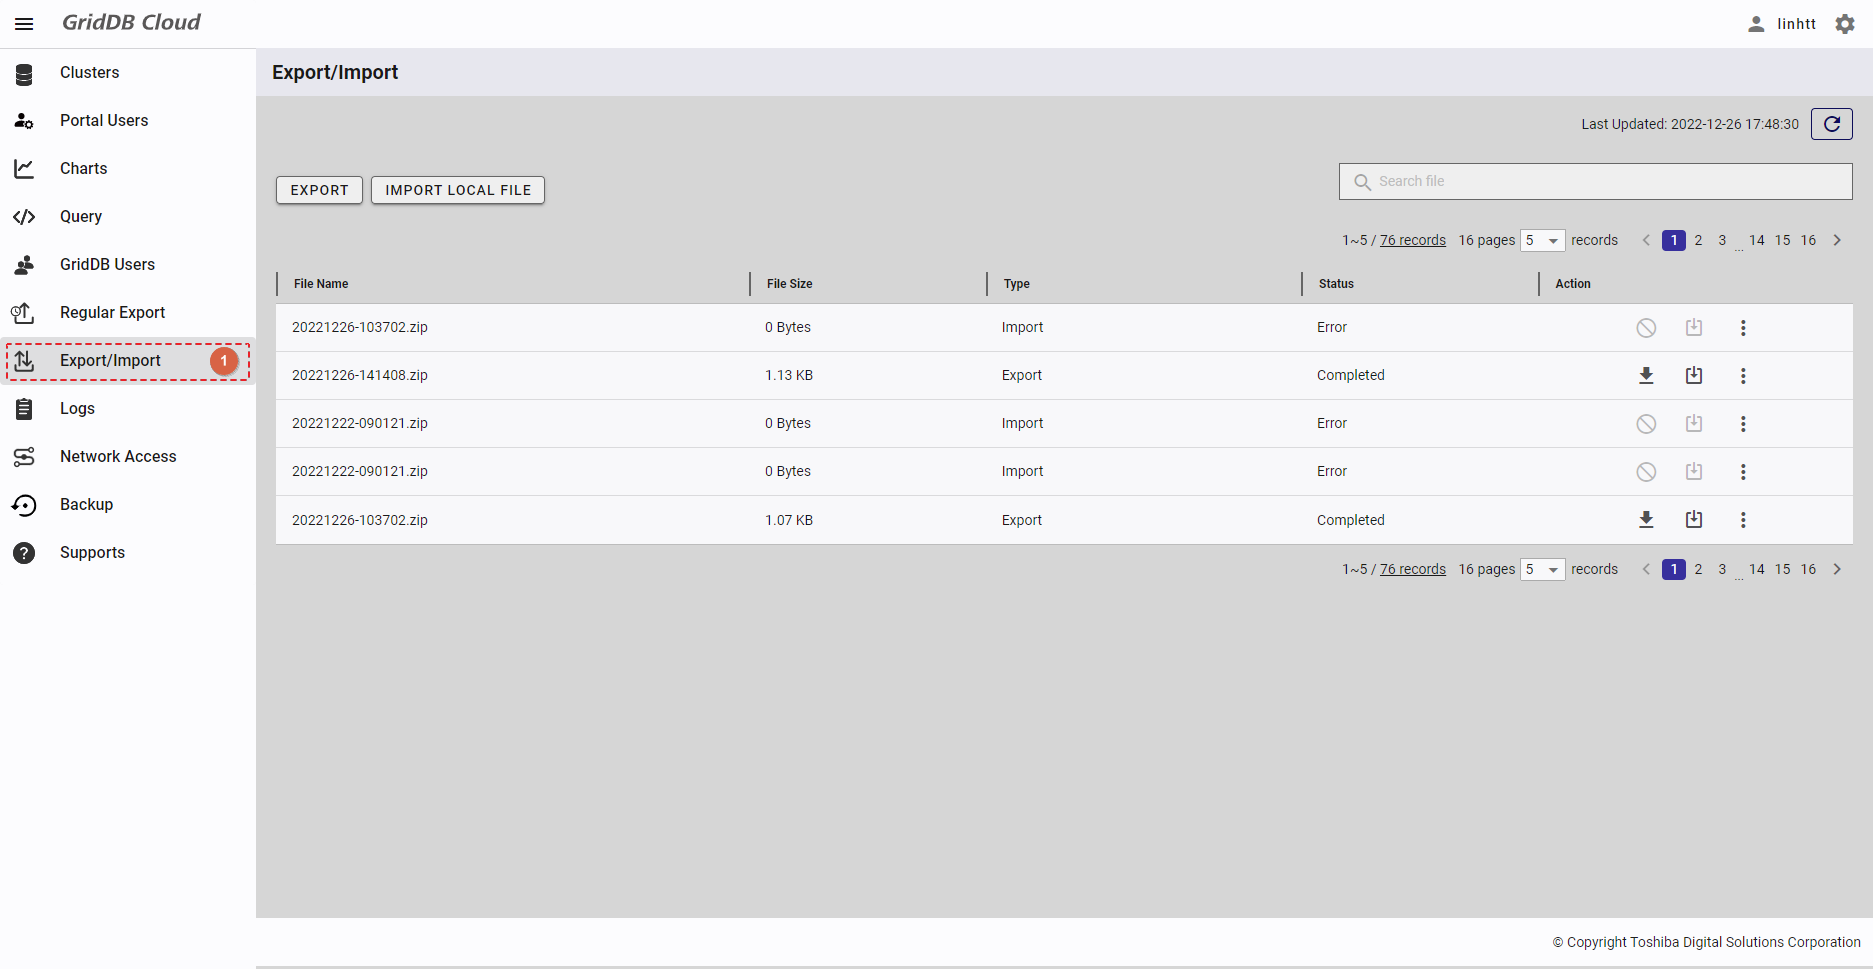
- You can choose the number of export/import records displayed on one page by selecting the number from [5, 10, 15, All] (④) at the top or bottom of the page. Click the [Next] button (⑤) or the [Back] button (⑥), or click the page number (⑧) to view another page.
- To search for a specific export/import record, type the name of the export/import record in the search bar (③).
- To refresh the Export/Import list and get the latest information about the Export/Import list, click the [Refresh] button (②) on the top of the right panel.
- You can order Export/Import list by file name, by file size, by type, or by status, by clicking the header (⑦) of each column.
- You can adjust the column size by dragging and dropping the vertical bar "|" on the header.
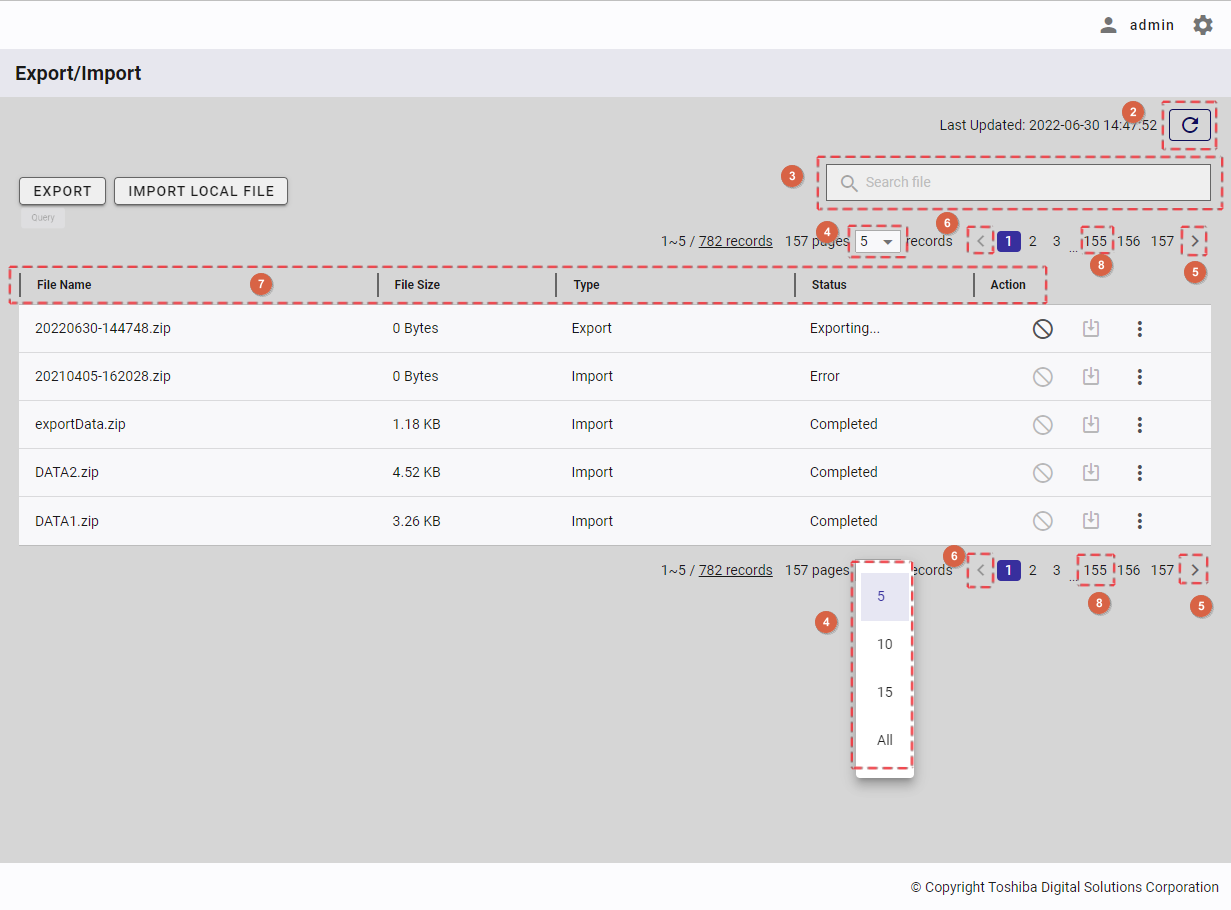
4.16.3 Exporting data
This function allows users to create an export job to export selected data to the Azure storage. This task will be run in the background.
4.16.3.1 Exporting a database
Step 1: To export data, first you must select the [Export/Import] screen and then click the [EXPORT] button.
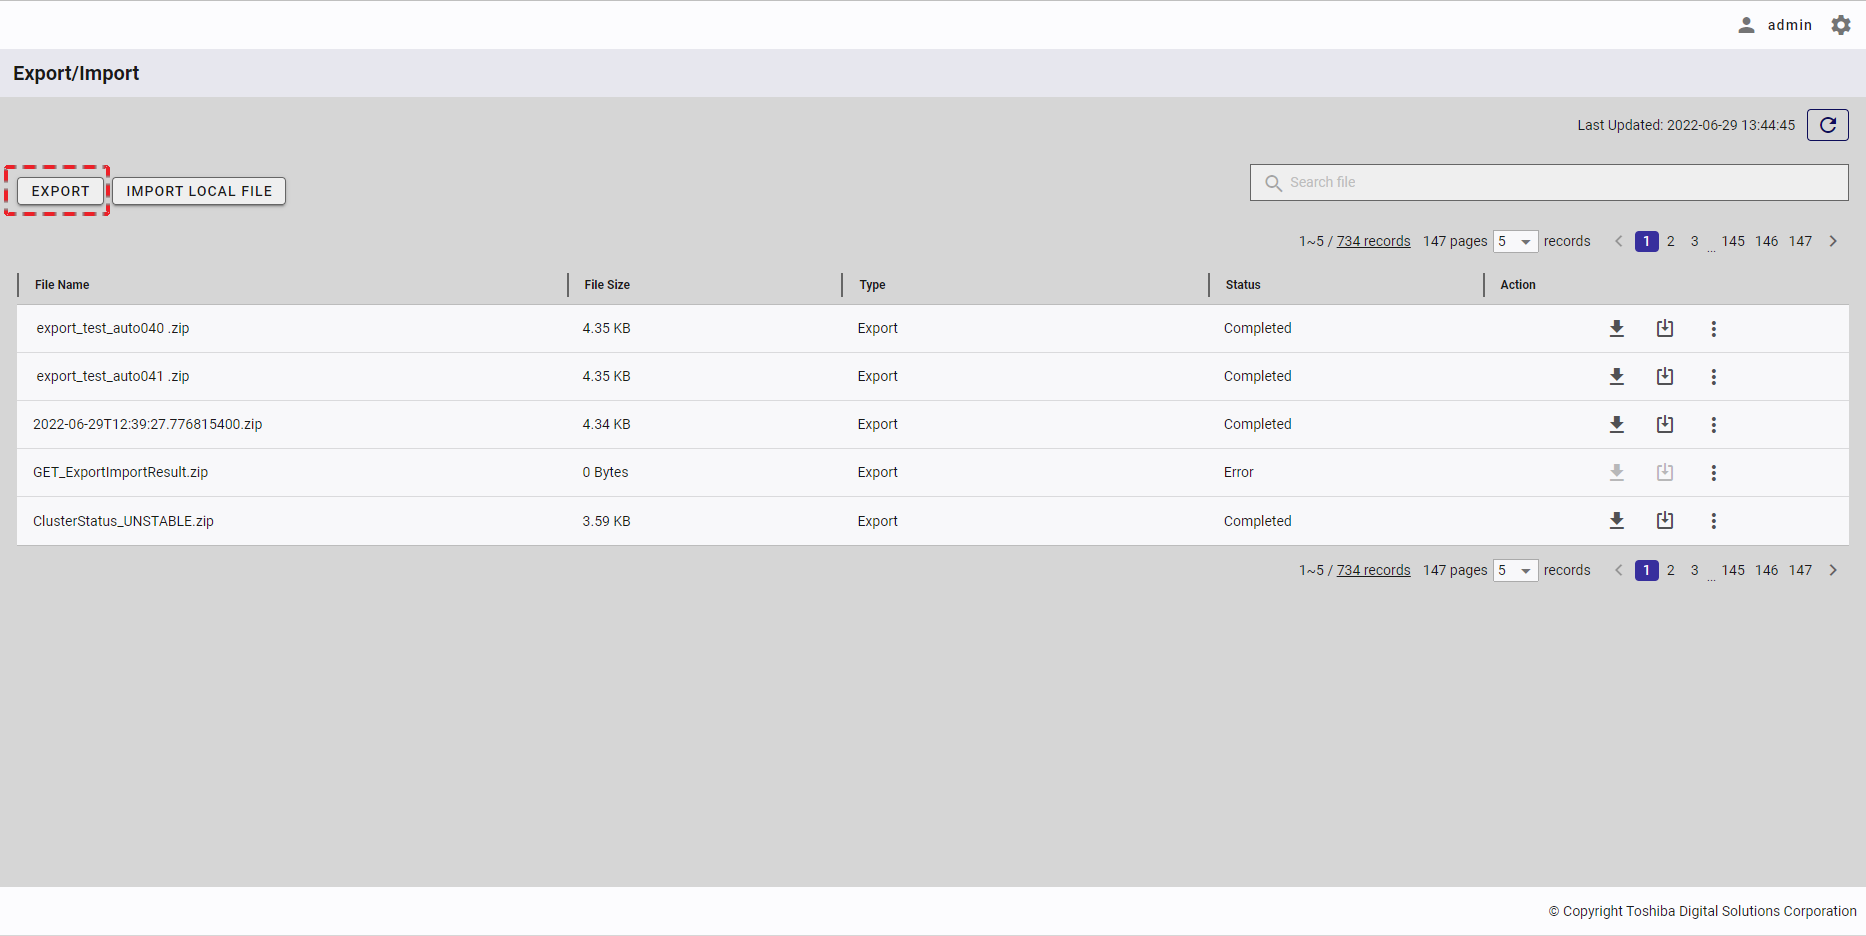
Step 2: To export a database, select the Export Unit [Database]. The default Export Unit is Container.
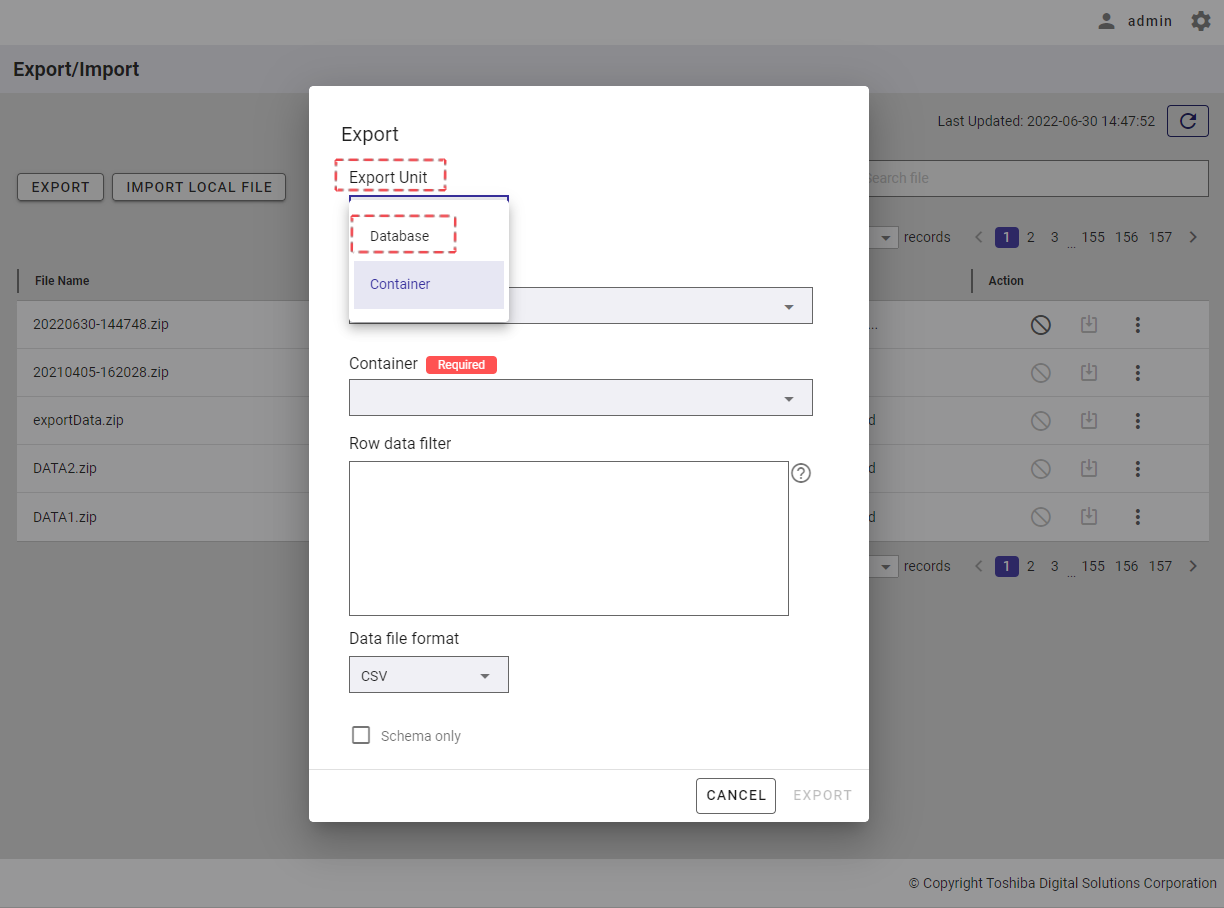
To apply the choices you have made, click [APPLY] (③). You can also discard all the changes made above by clicking the [CANCEL] button (④).
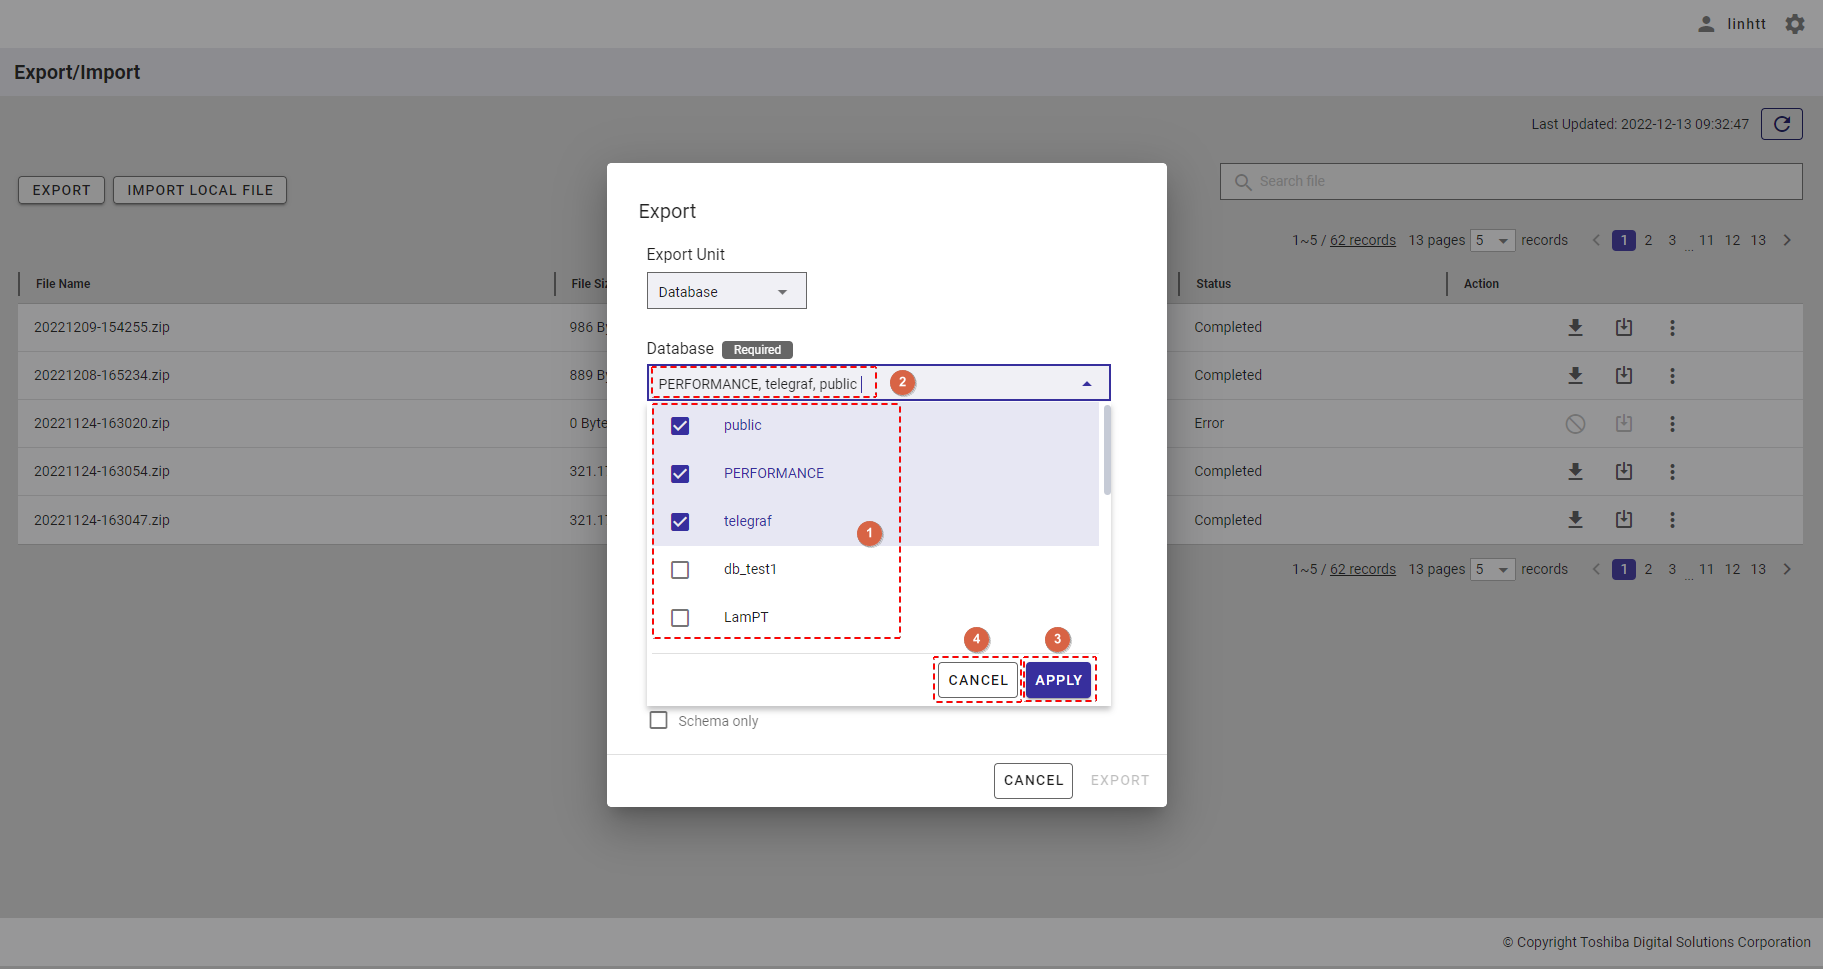
Step 4 (Optional): Enter TQL in the row data filter.
Rows located by a search query can be exported by specifying a search query to remove rows from a container. All rows stored in a container that has not been specified in the search query will be exported.
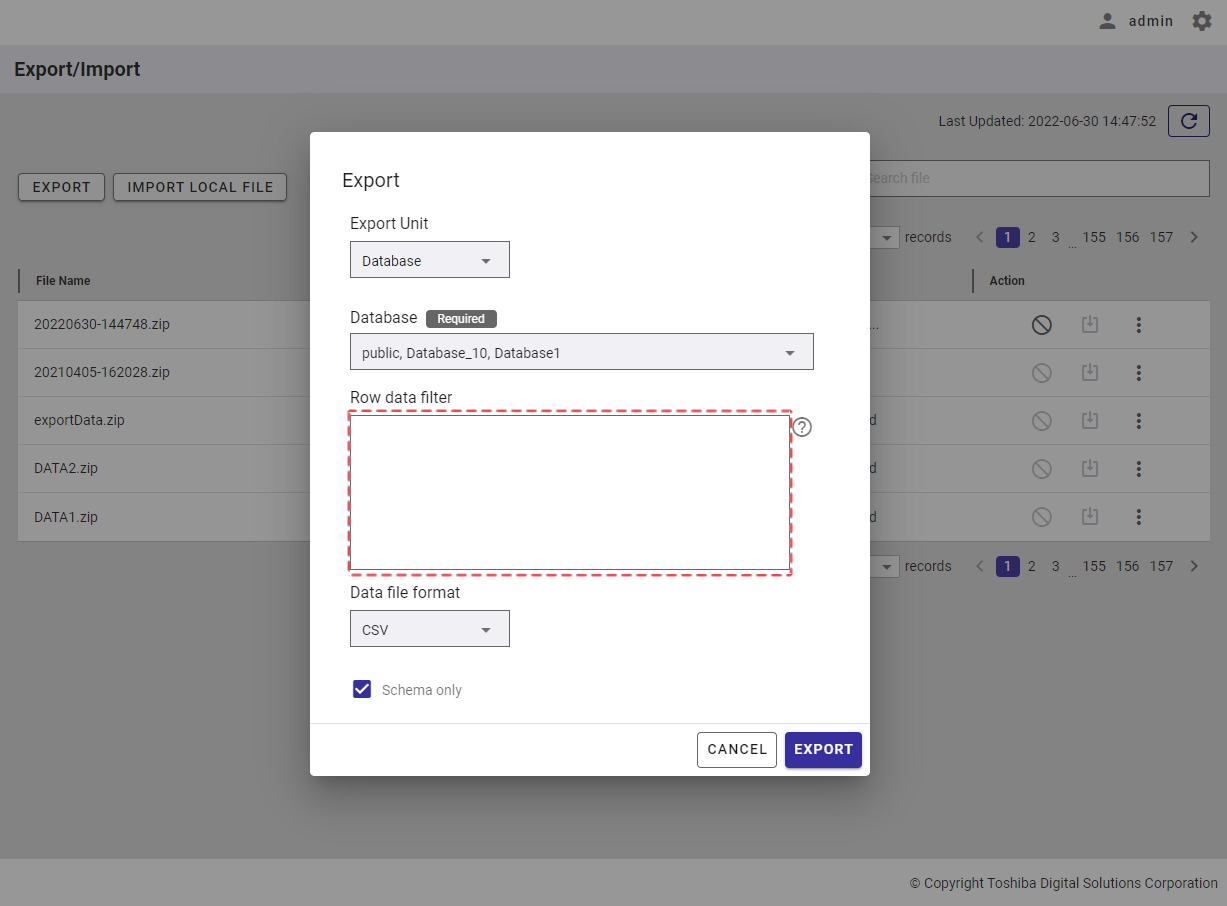
[Note]: For more details, refer to the section on how to specify a row in the GridDB Operation Tools Reference, or you can hover the mouse pointer over the [HELP] icon (①) to get an example.
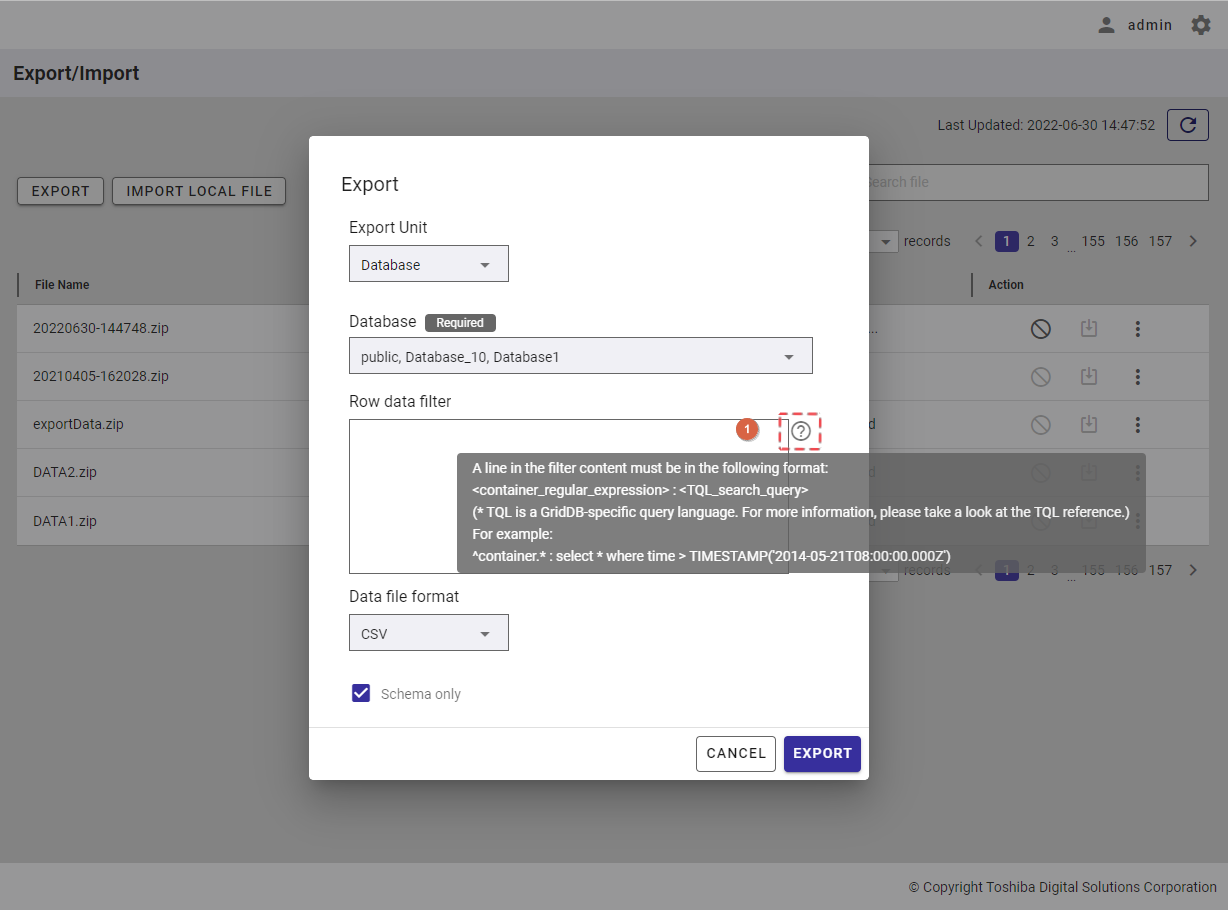
Step 5 (Optional): Export data in [CSV] format or [Binary] format by selecting an option in the data file format.
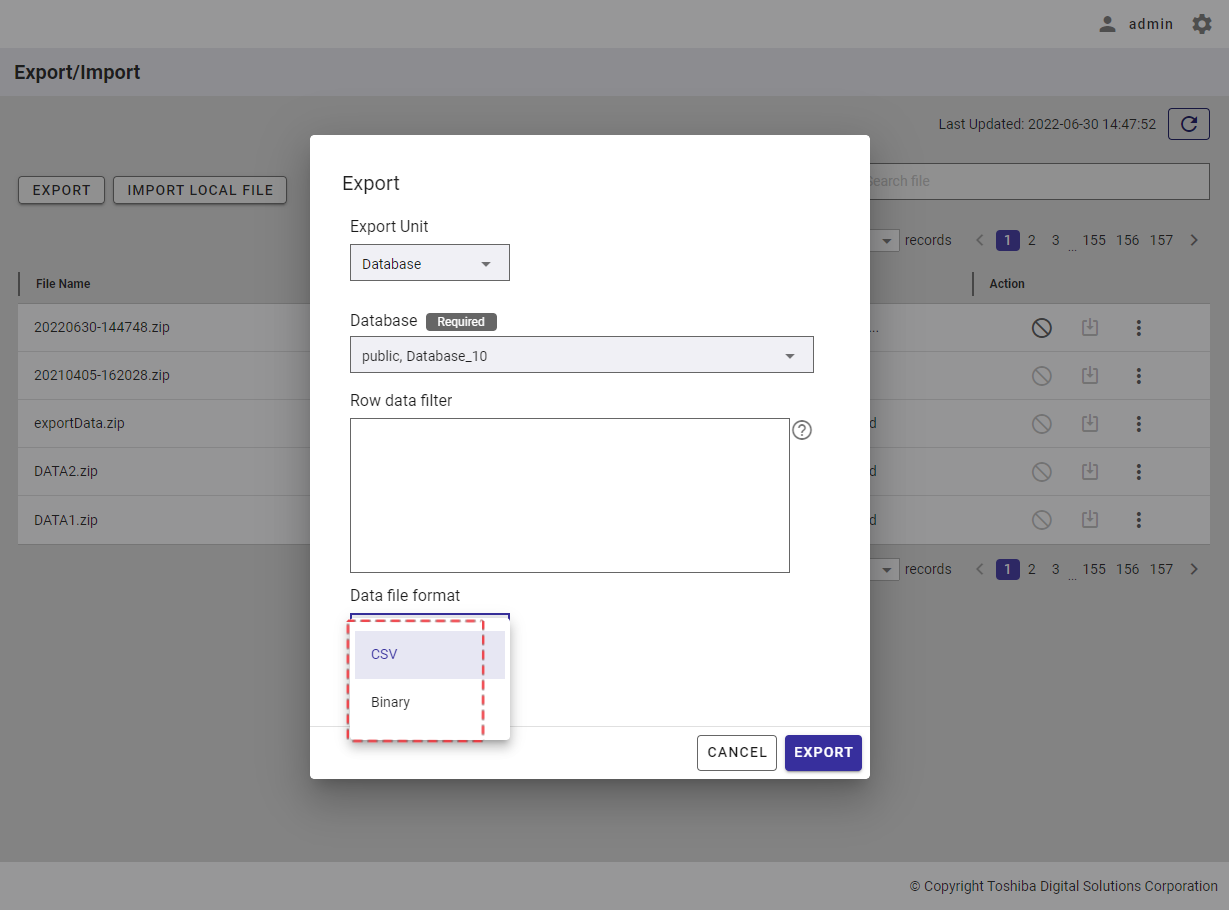
Step 6 (optional): Export data without row data (only container information) by checking the option [Schema only].
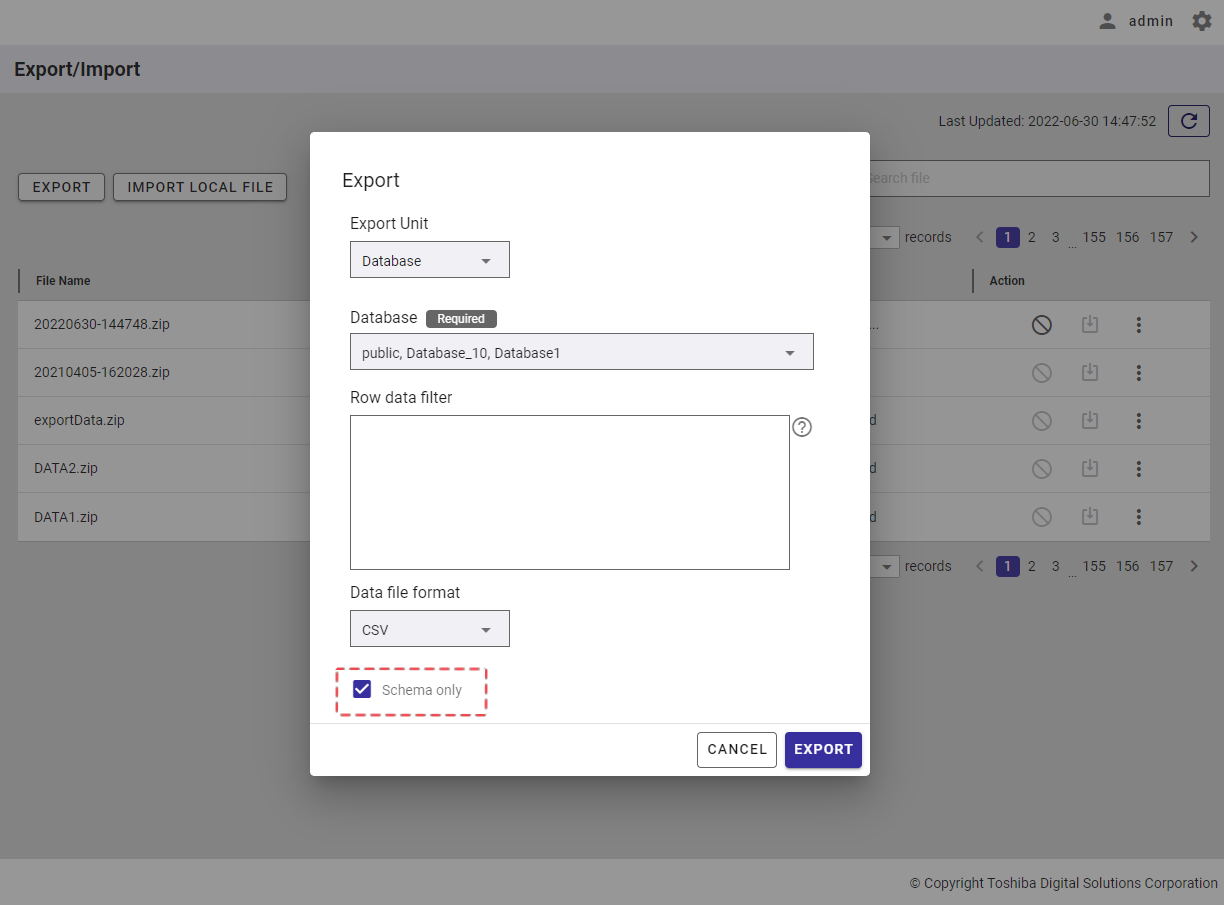
Step 7: Click the [EXPORT] button to export data. Or click the [CANCEL] button to go back to the Export/Import screen without exporting data.
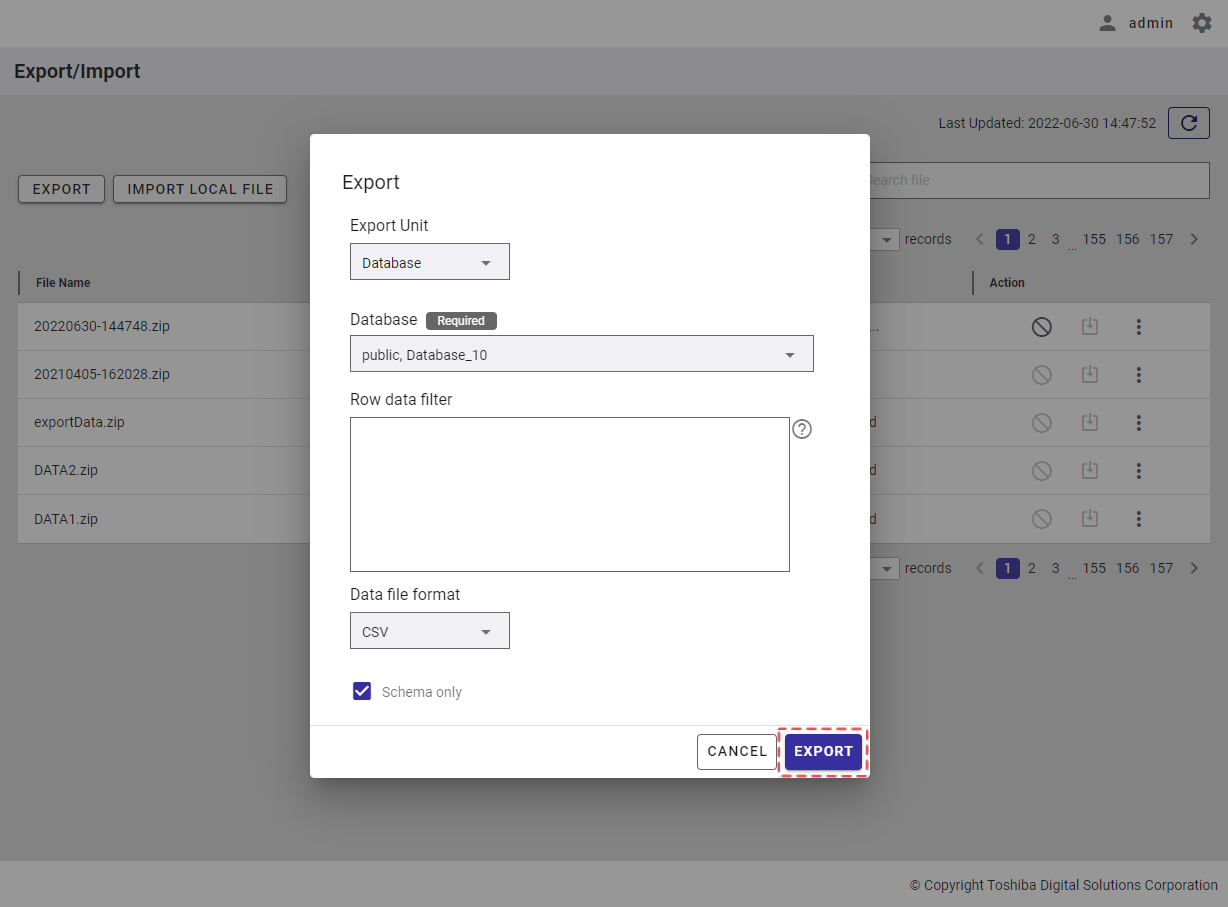
Step 8: Once the [EXPORT] button is clicked, a confirmation dialog will be displayed. Click the [YES] button to start exporting data. If you do not want to start exporting data, you can click the [NO] button to close the confirmation dialog and return to the Export dialog.
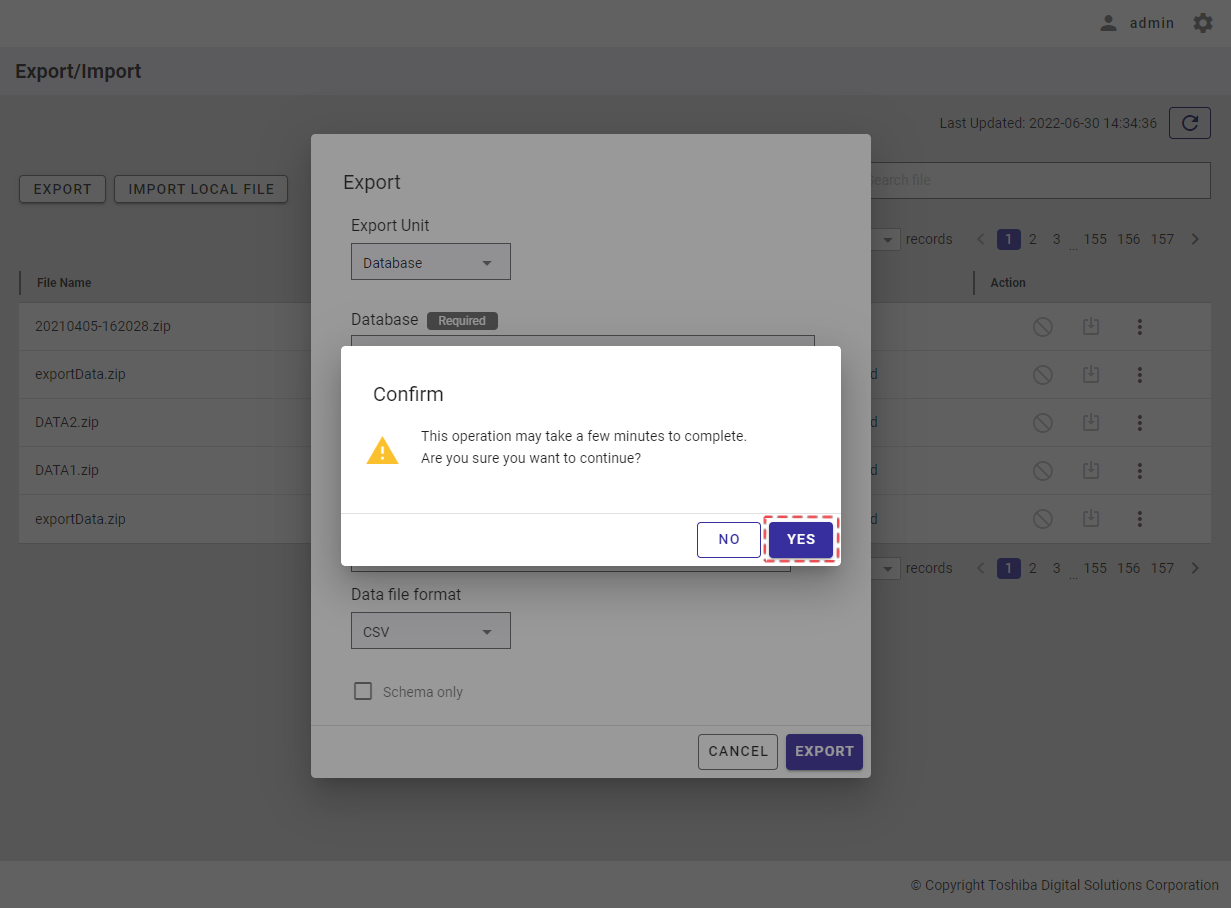
A new export process is then added to the Export/Import list.
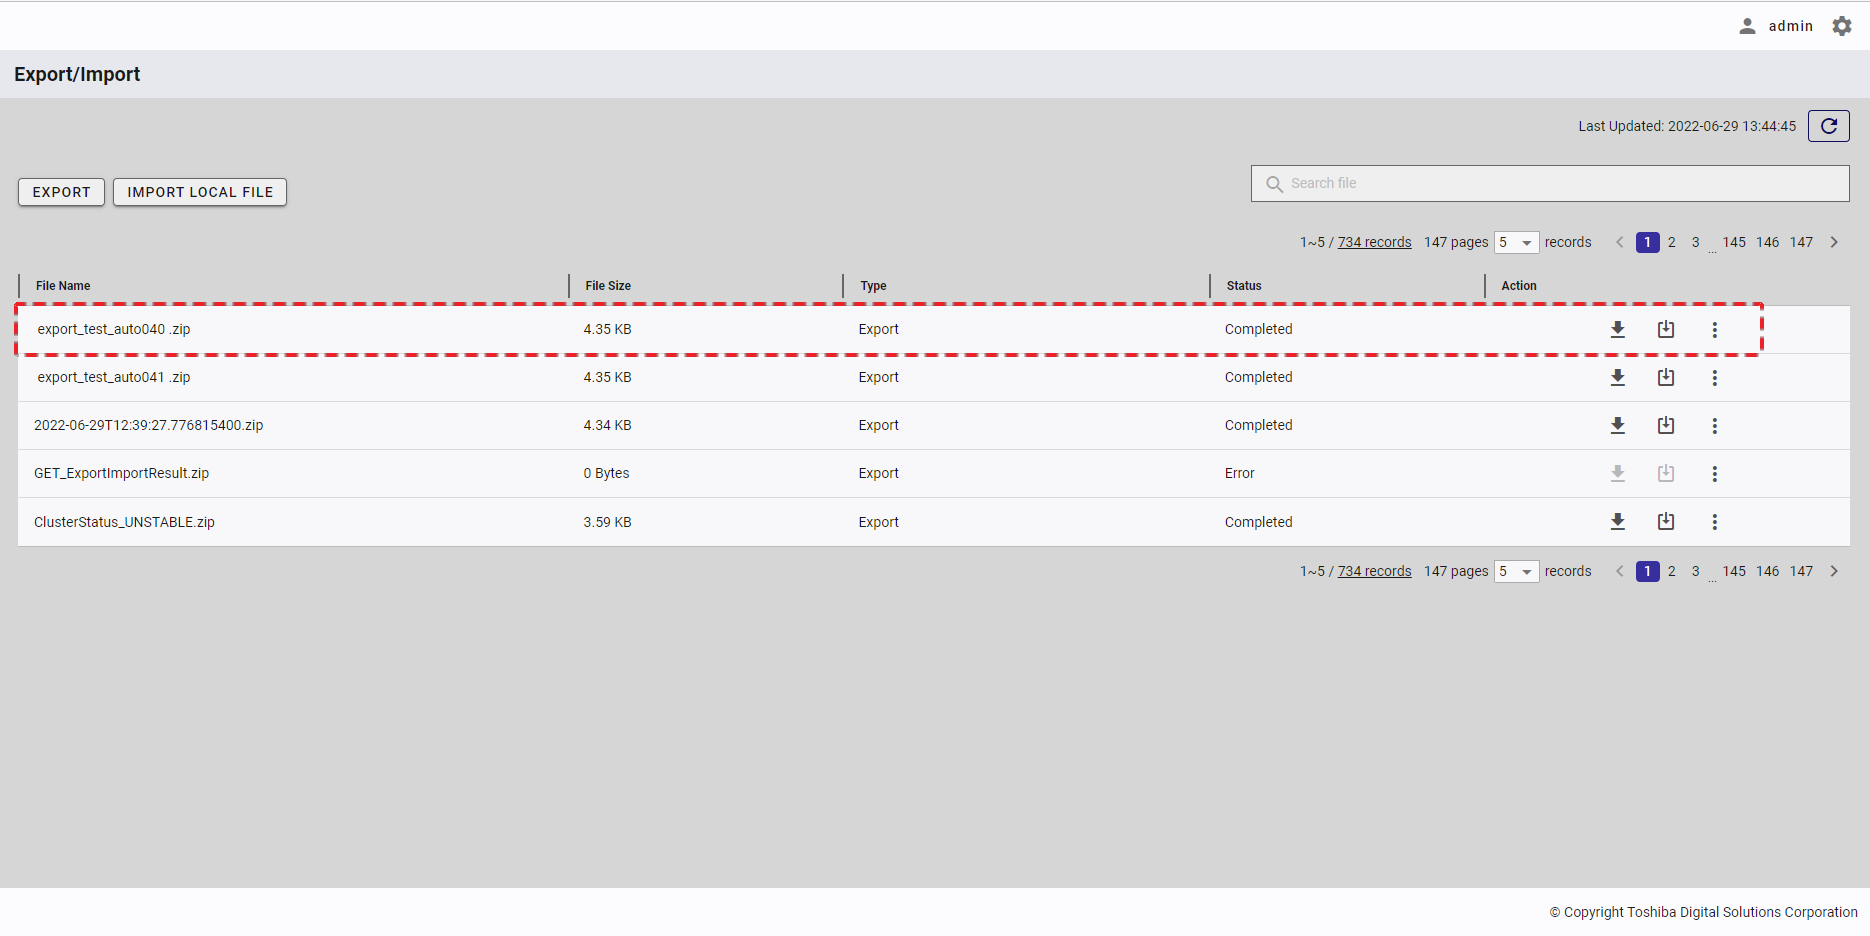
4.16.3.2 Exporting a container
Step 1: To export data, first you must select the [Export/Import] screen and then click the [EXPORT] button.
Step 2: In the Export dialog the default Export Unit is selected. Select the database that includes containers you want to export. In this drop-down list (①), you can select only one database. You can also enter the database name in the text box (②) to search for the database name you want to select.
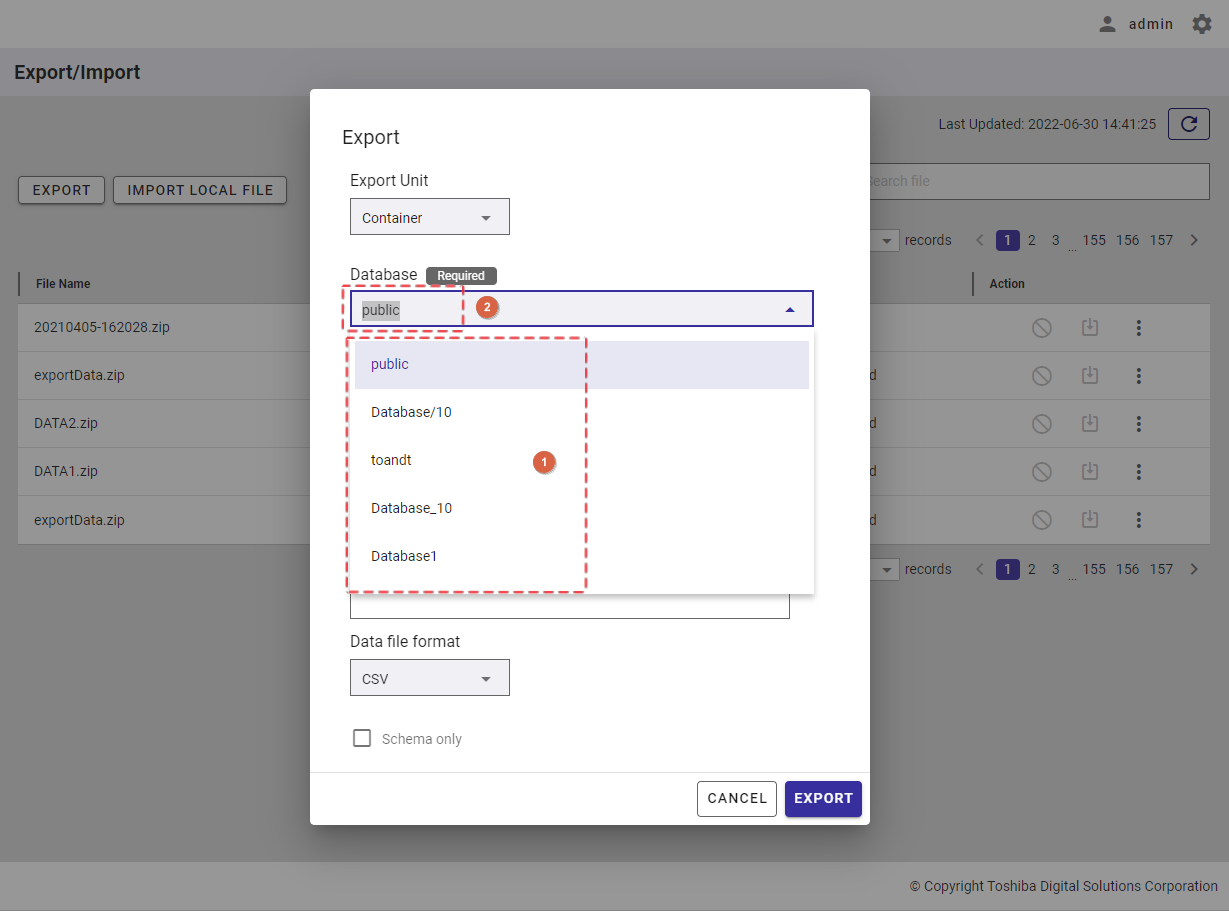
To apply the choices you have made, click [APPLY] (③). You can also discard all the changes made above by clicking the [CANCEL] button (④).
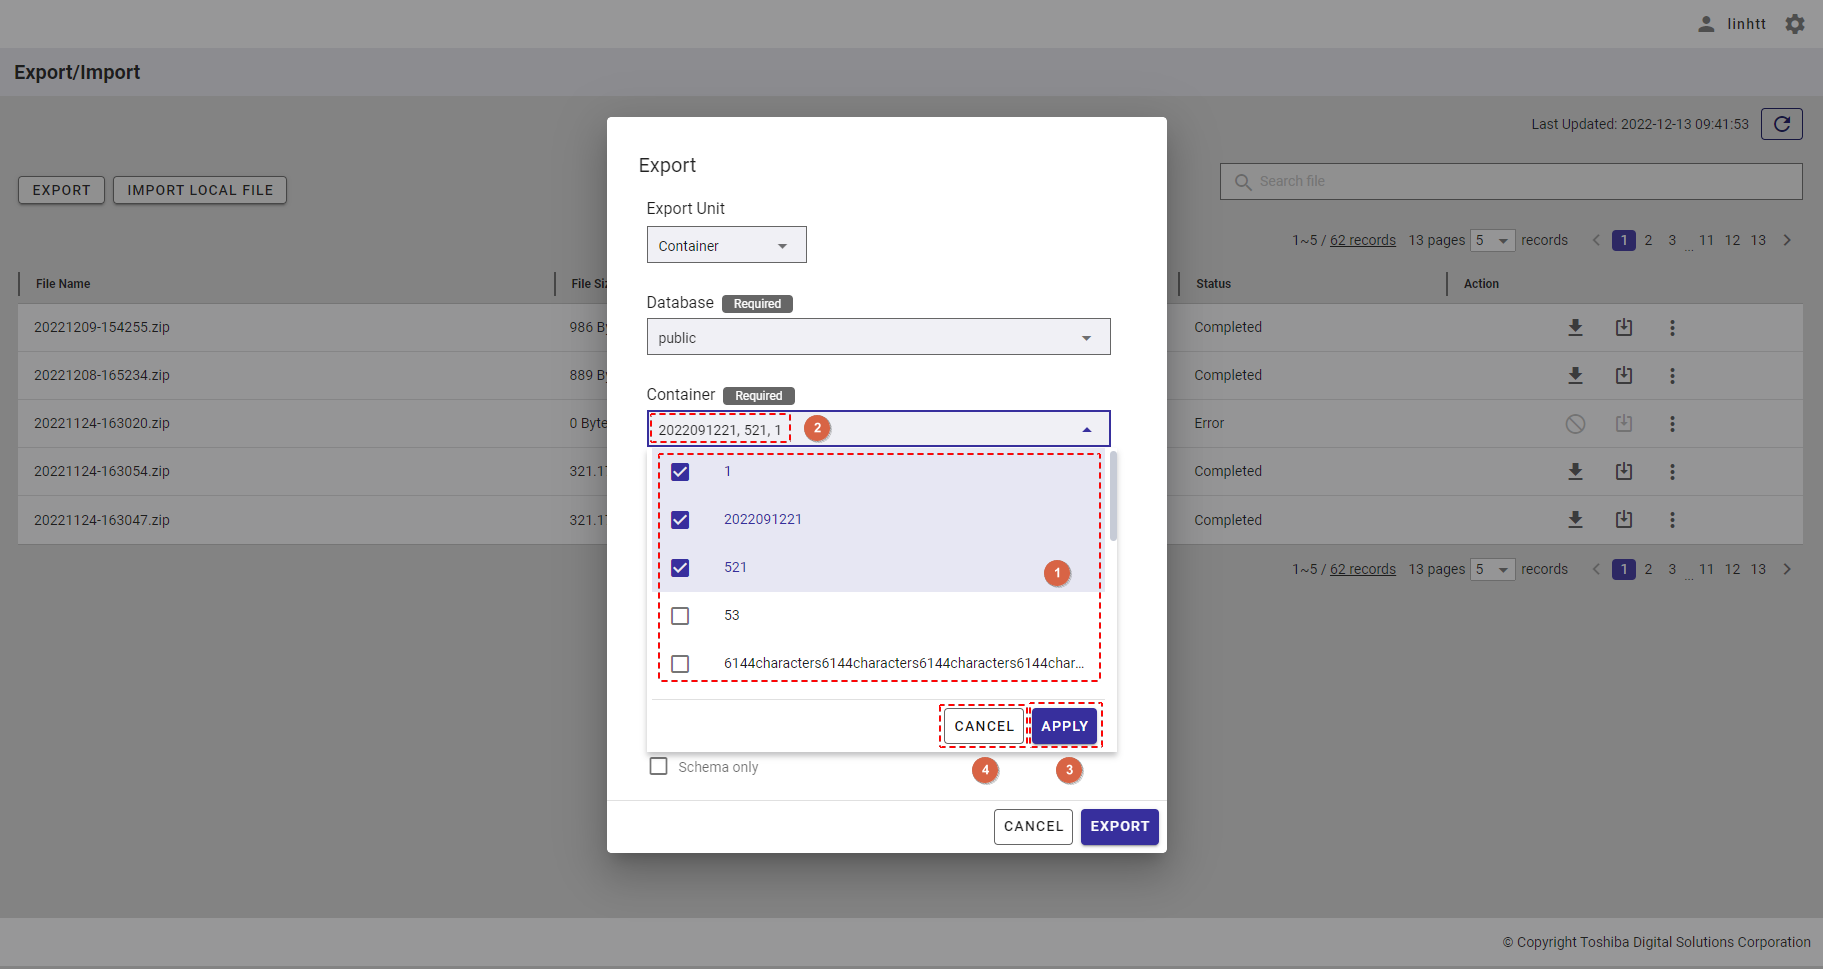
Step 4 (optional): Enter TQL in the row data filter.
Rows located by a search query can be exported by specifying a search query to remove rows from a container. All rows stored in a container that is not specified in the search query will be exported.
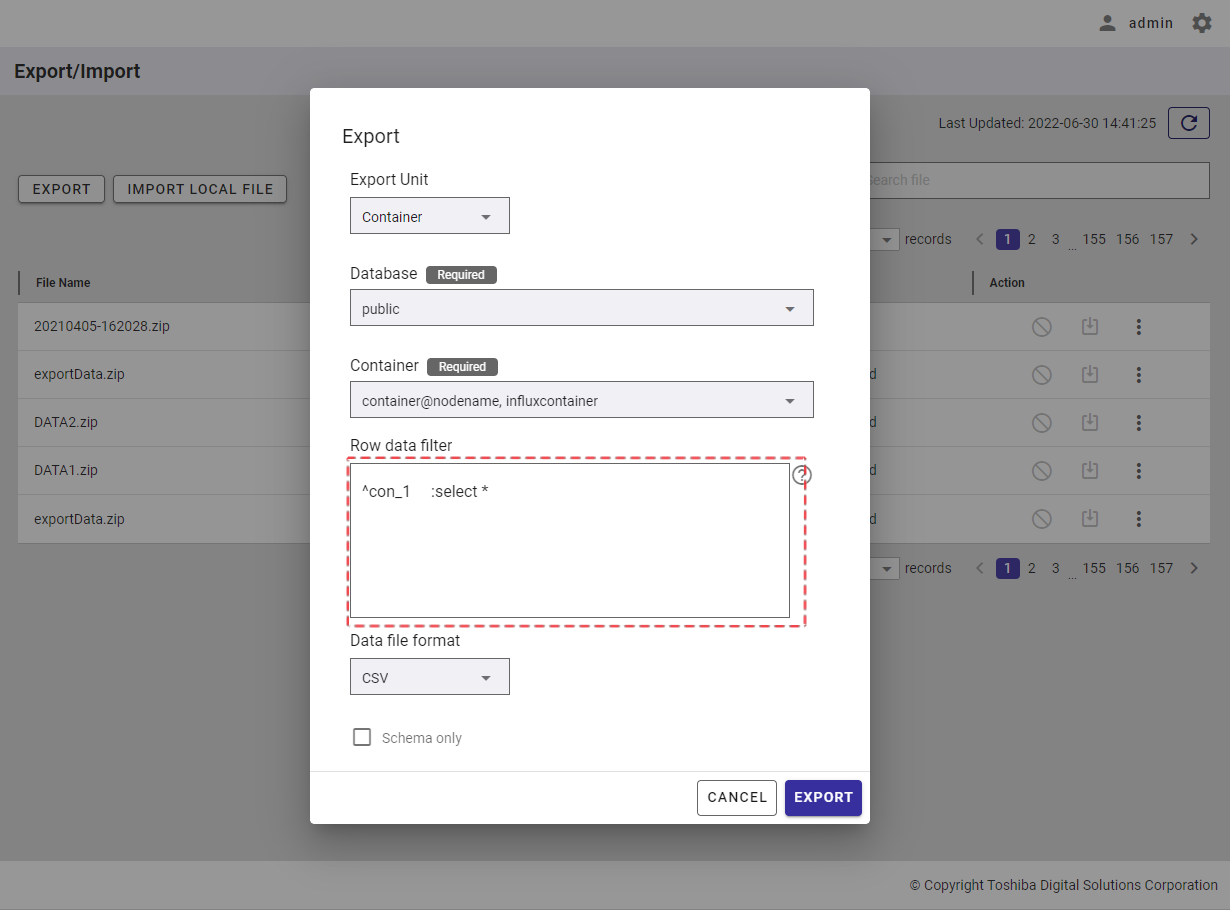
[Note]: For more details, refer to the section on how to specify a row in the GridDB Operation Tools Reference, or you can hover the mouse pointer over the [HELP] icon (①) to get an example.
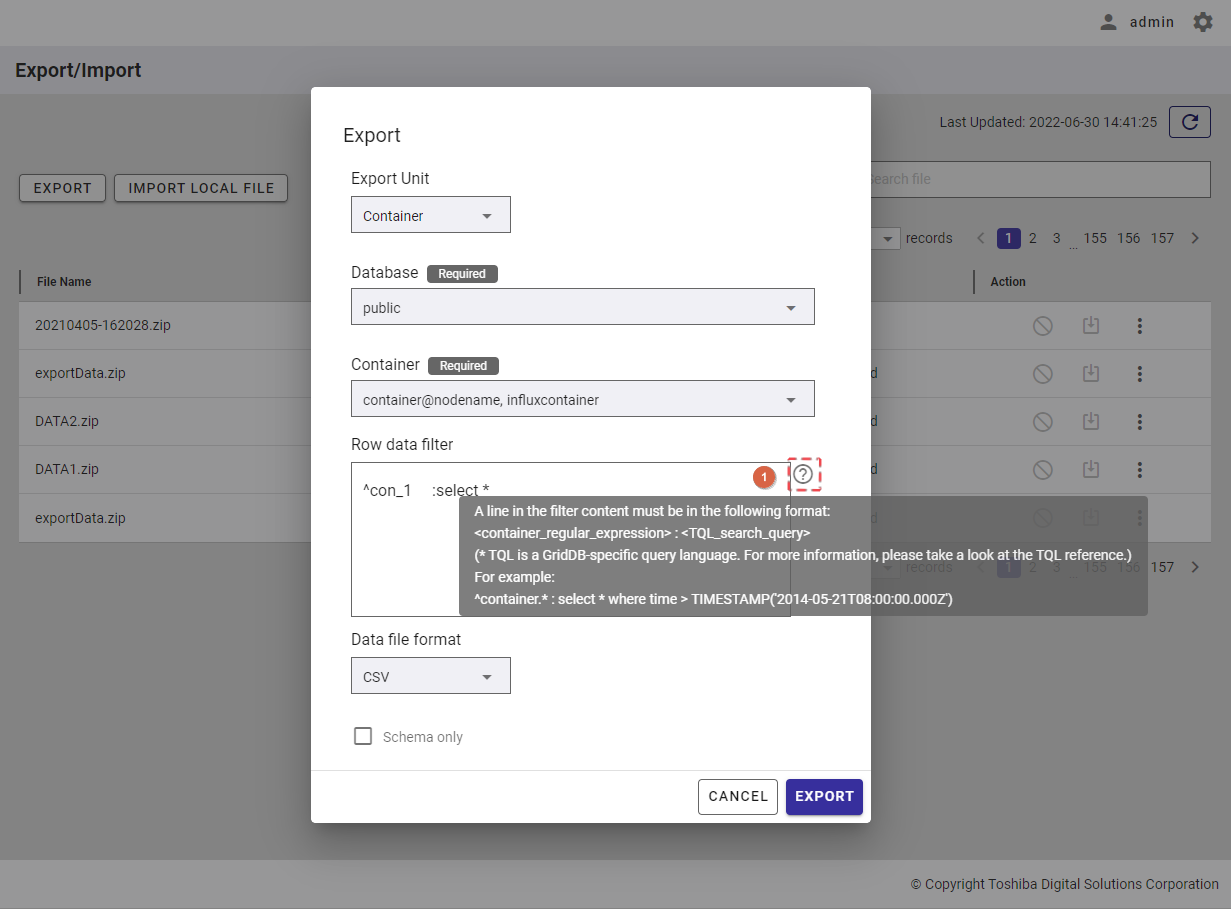
Step 5 (Optional): Export data in [CSV] format or [Binary] format by selecting an option in the data file format.
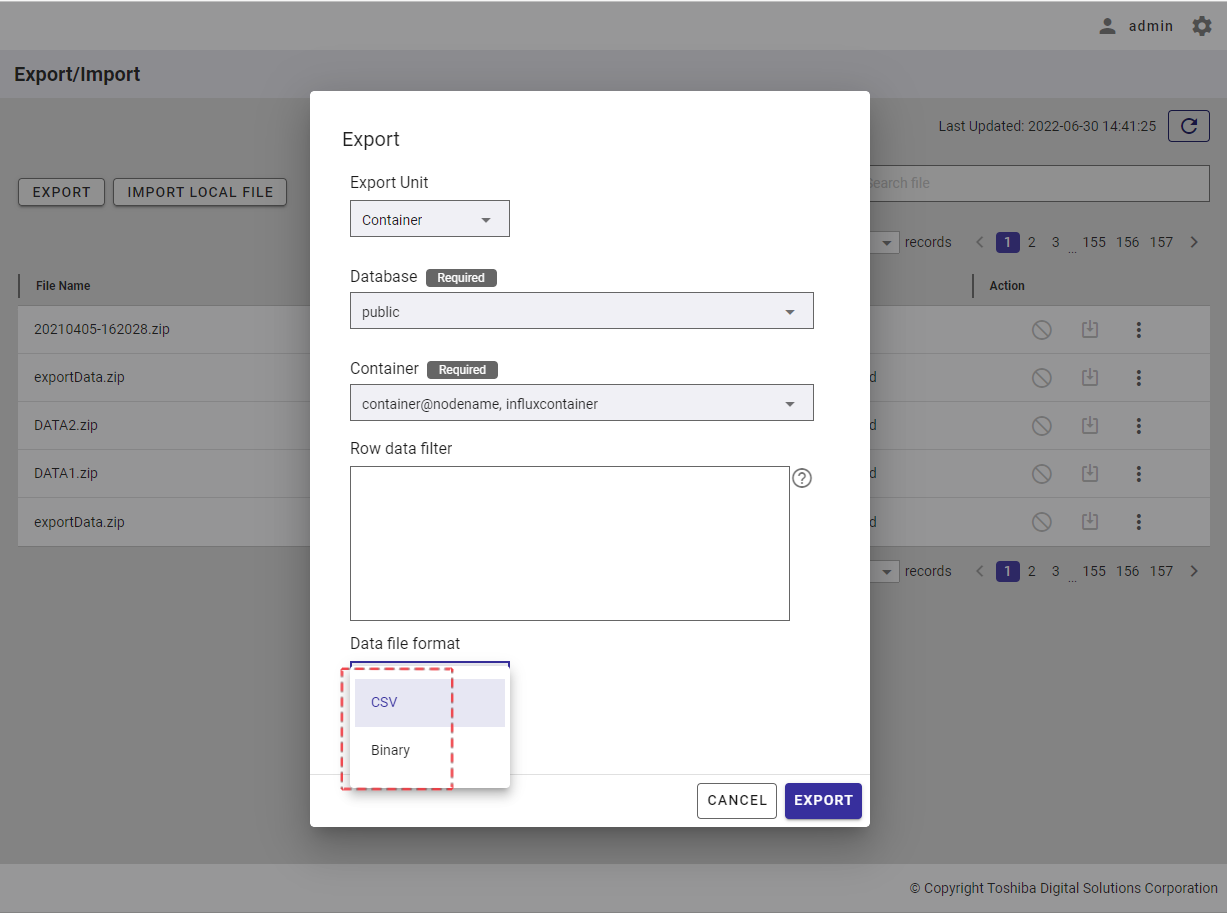
Step 6 (optional): Export data without row data (only container information) by checking the option [Schema only].
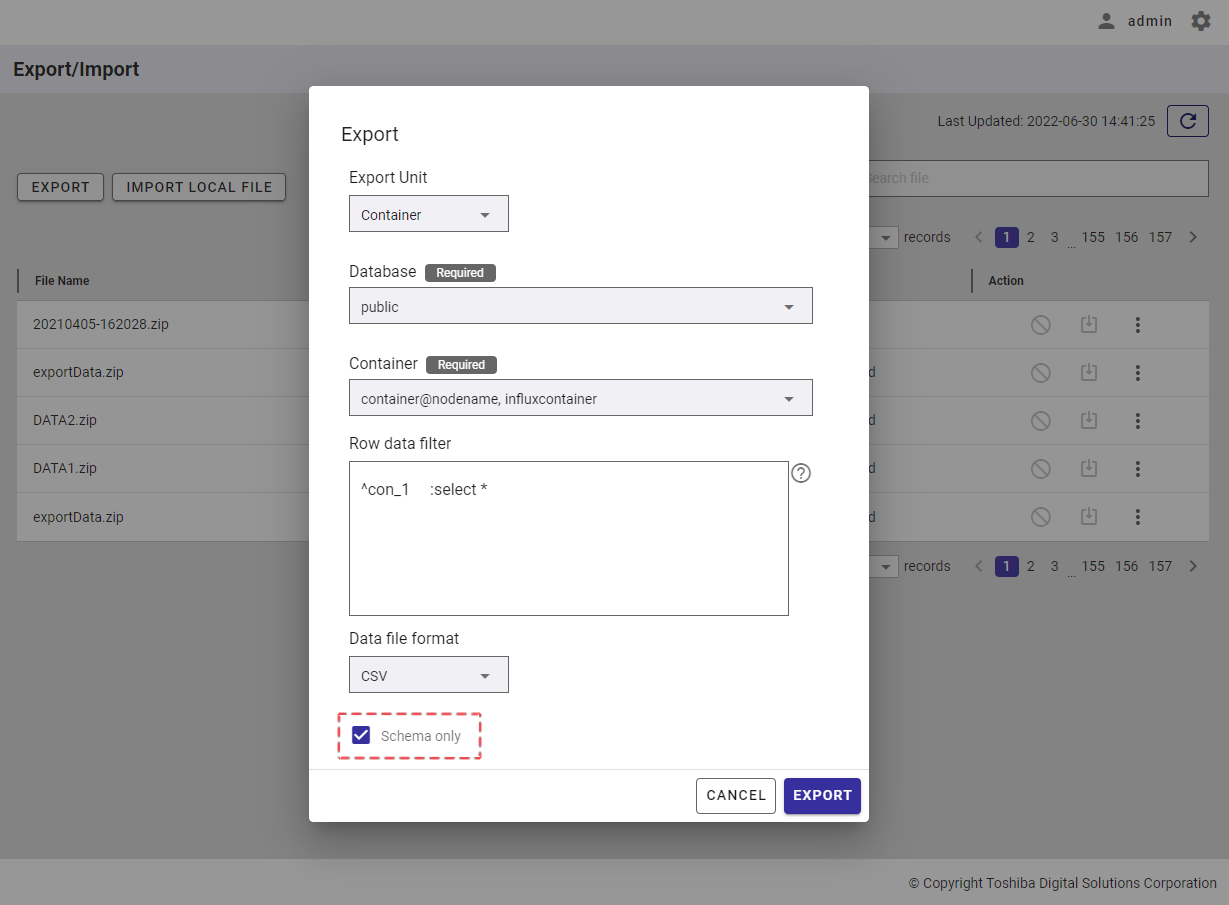
Step 7: Click the [EXPORT] button to export data. Or click the [CANCEL] button to go back to the Export/Import screen without exporting data.
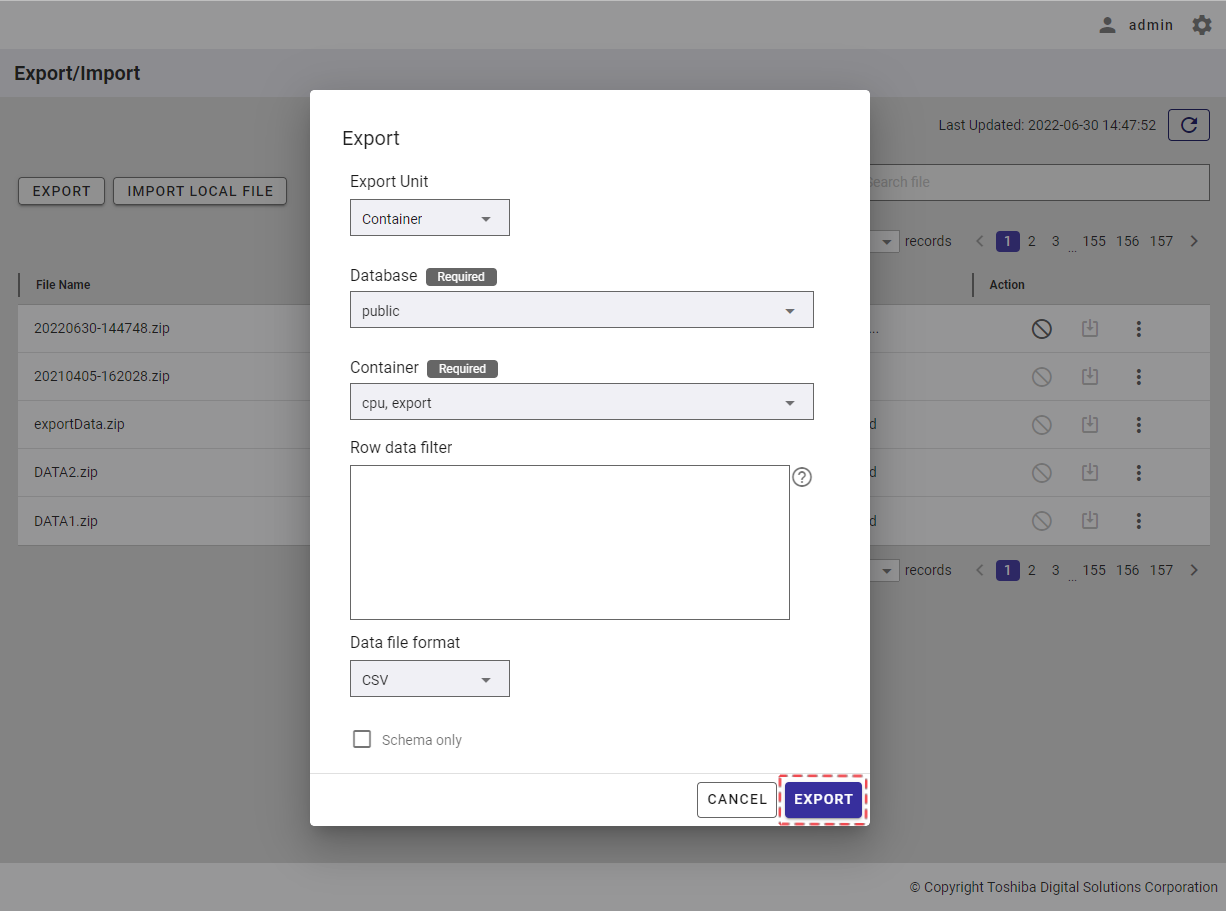
Step 8: Once the [EXPORT] button is clicked, a confirmation dialog will be displayed. Click the [YES] button to start exporting data. If you do not want to start exporting data, you can click the [NO] button to close the confirmation dialog and return to the Export dialog without exporting data.
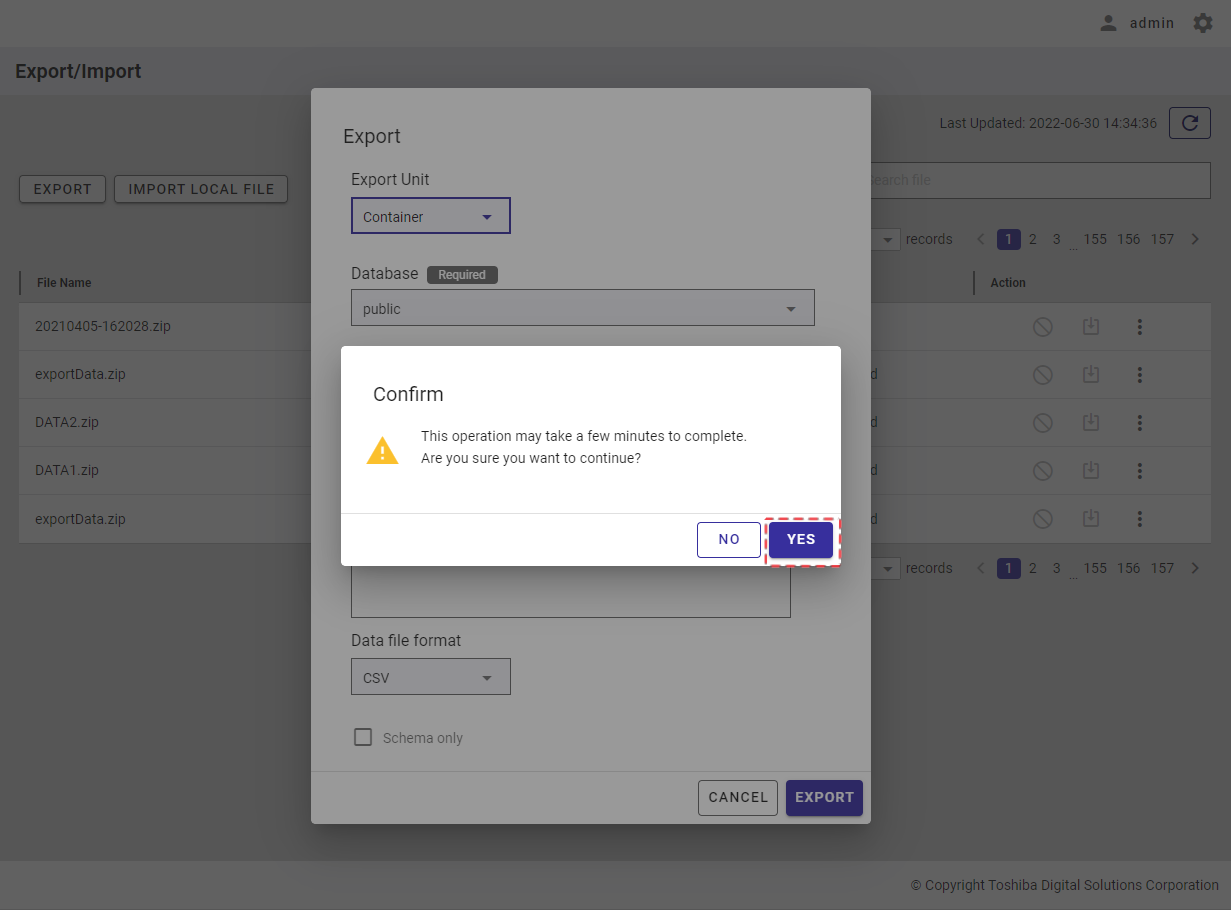
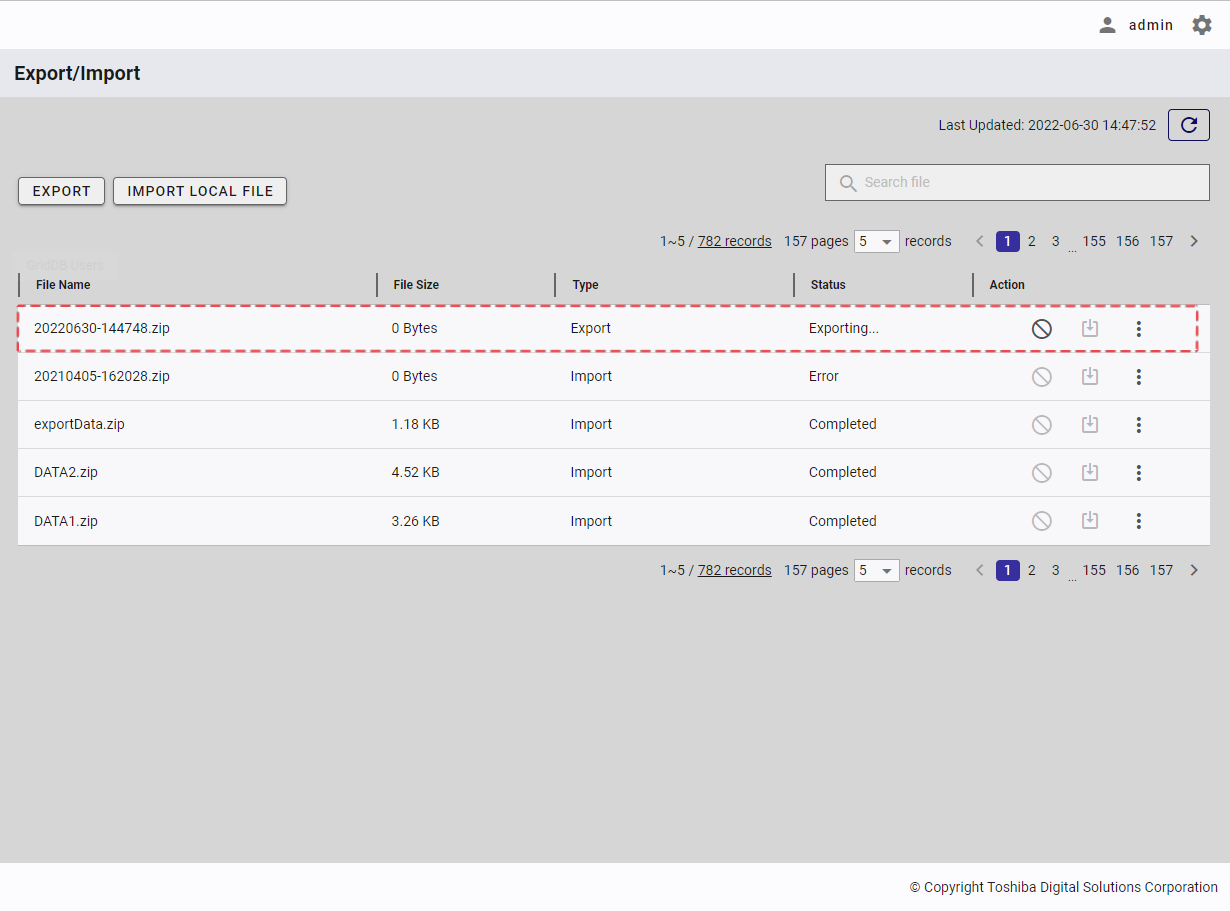
4.16.4 Downloading an exported file
To download an exported file, click the [DOWNLOAD] button.
[Note]: The download function only applies to the export process with the status Completed.
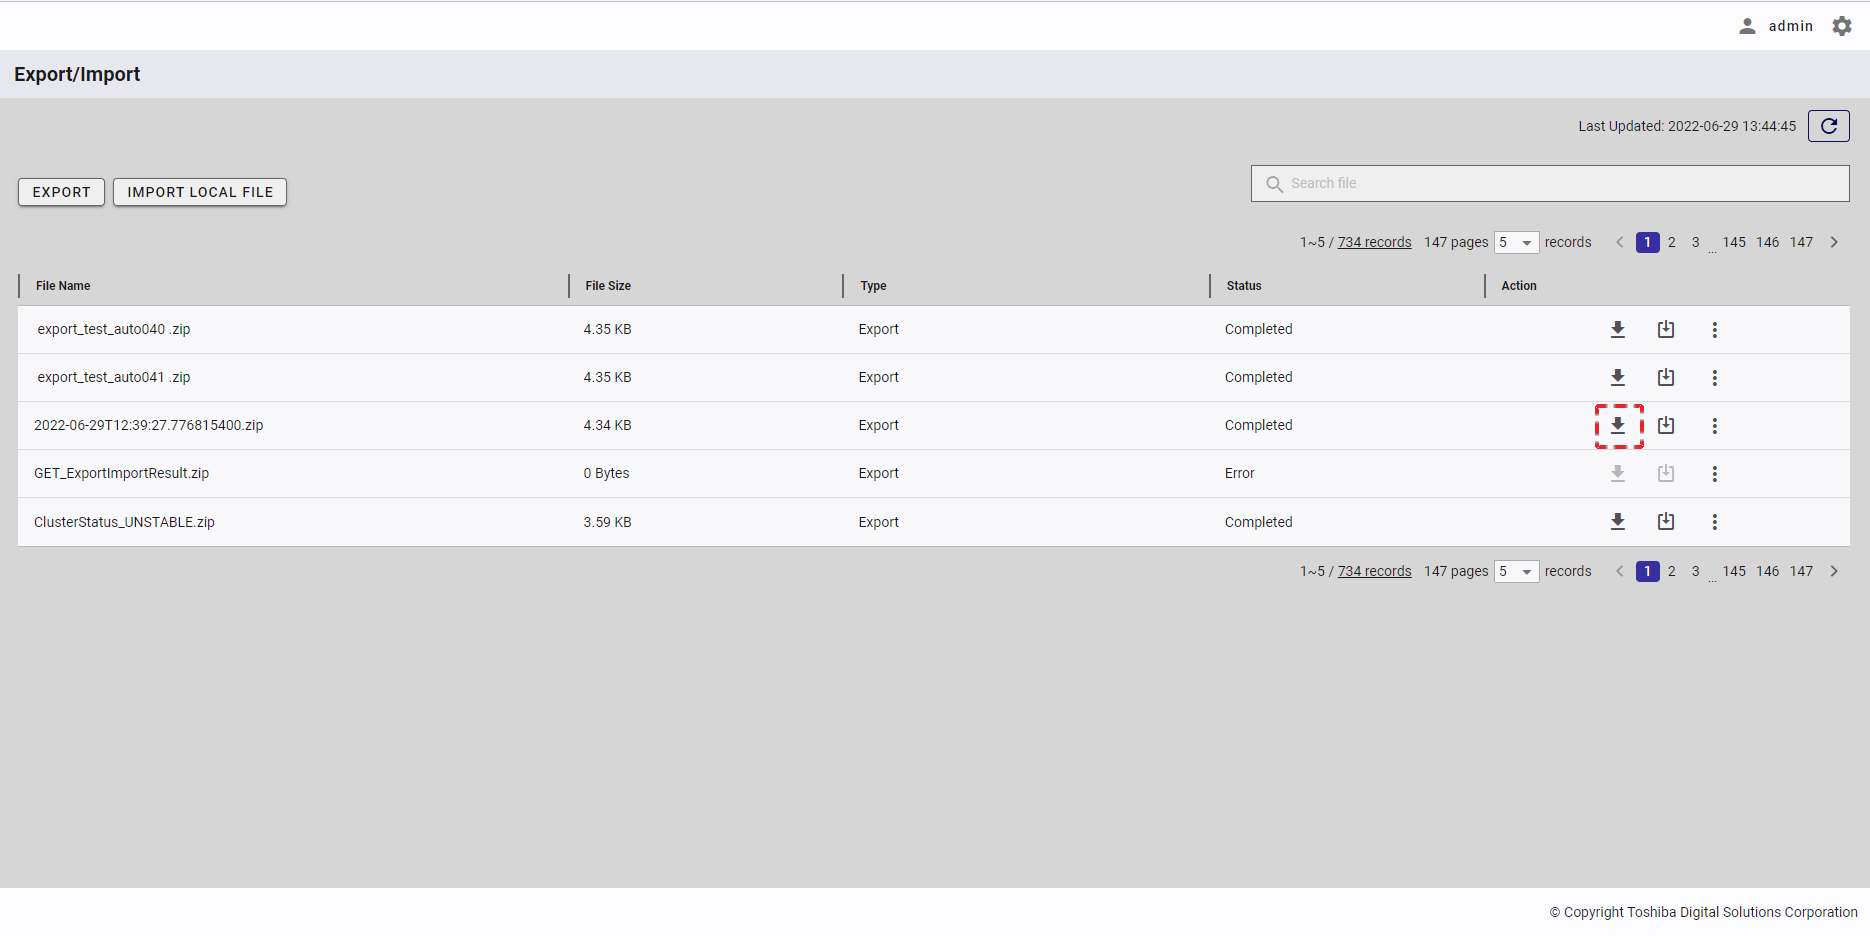
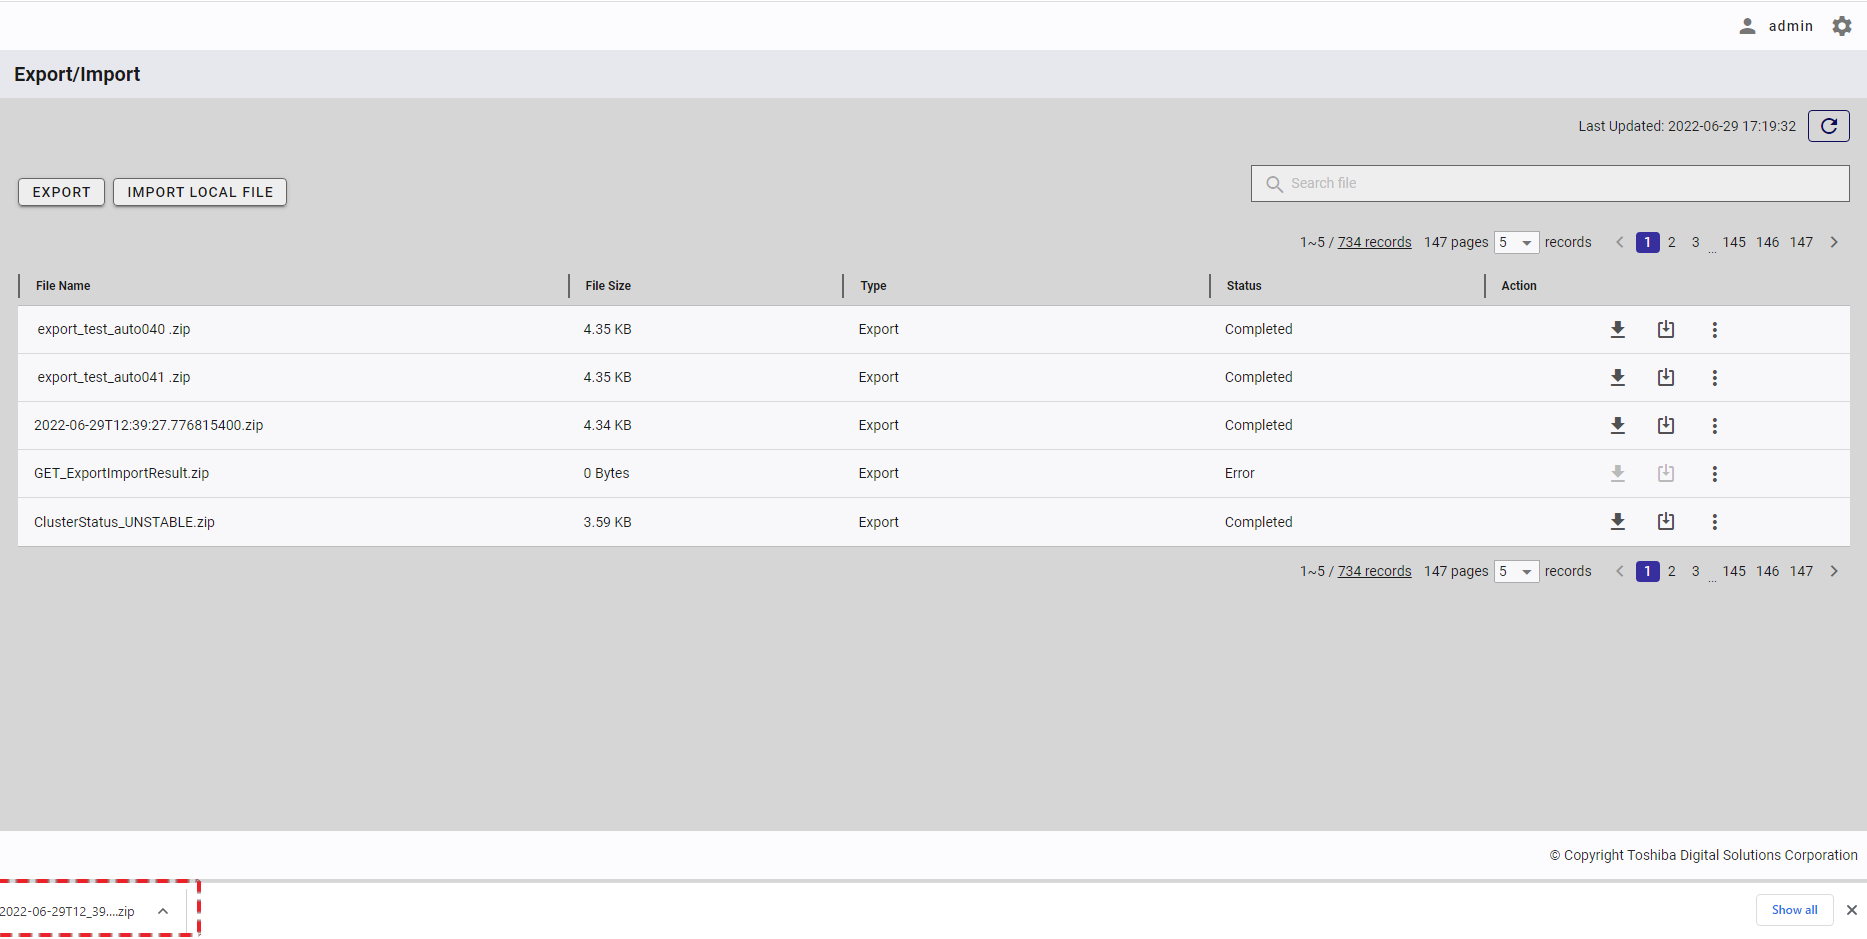
4.16.5 Displaying Export/Import results
Step 1: Click the [Menu] button (①). In the drop-down list, select the [View result] item (②) of the export/import process for which you want to view process details.
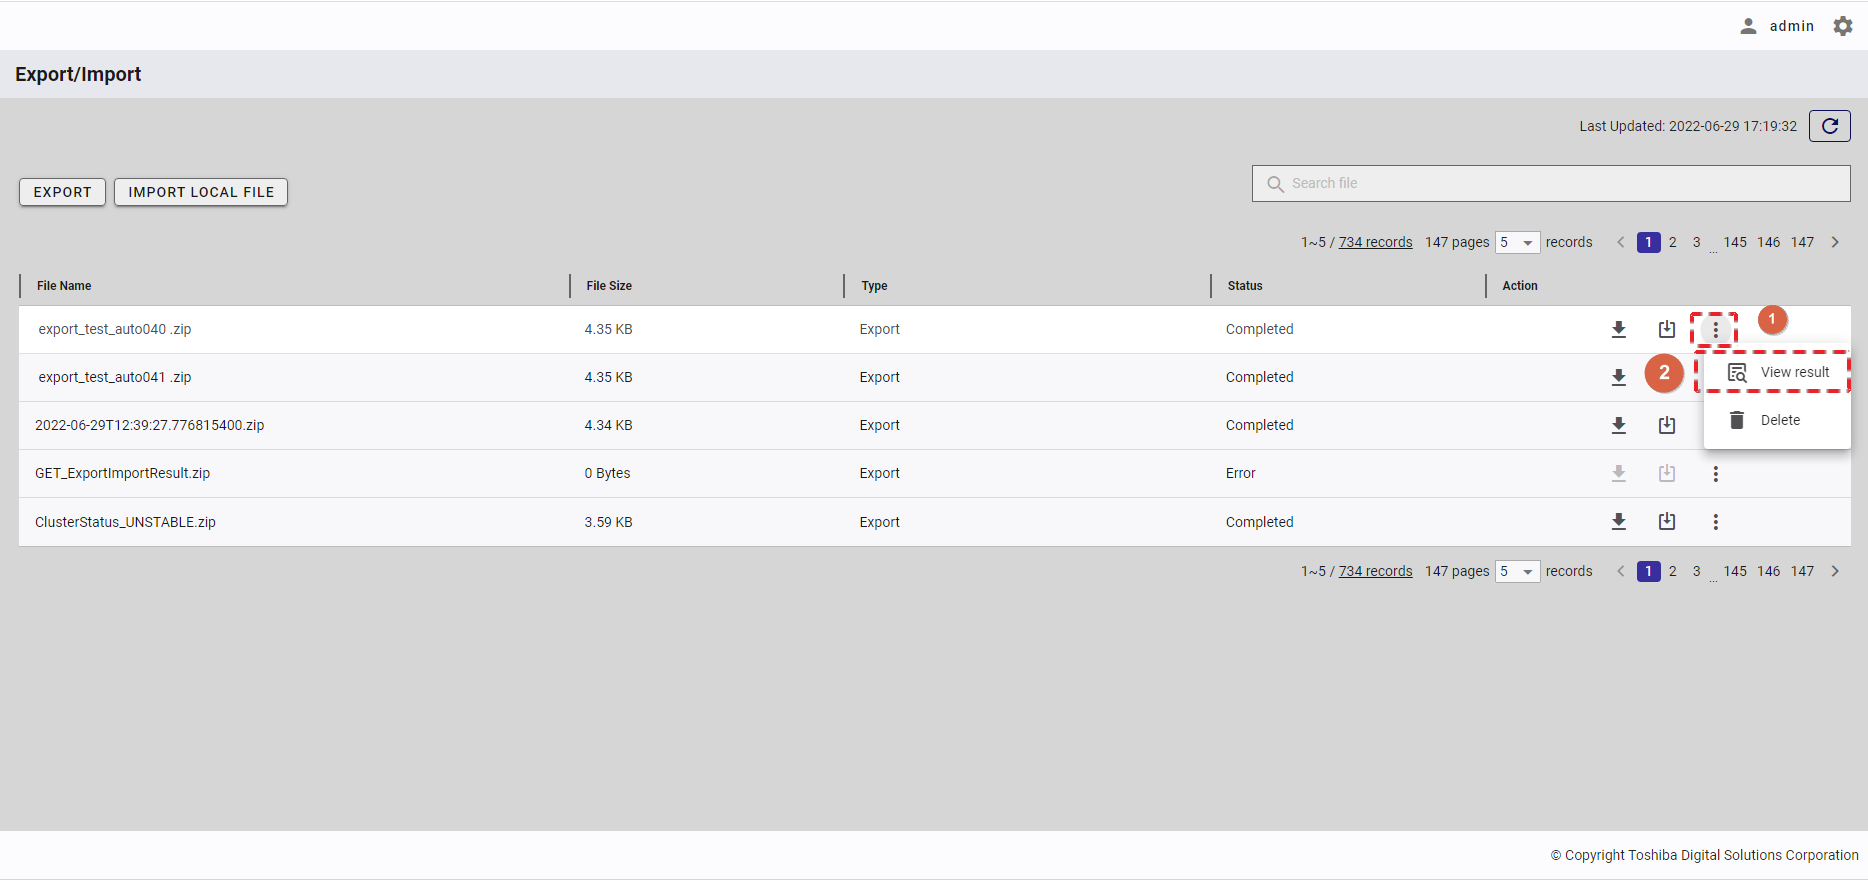
Step 2: The detail of the export/import process is displayed in the text area (①). To go back to the Export/Import screen, click the [CLOSE] icon (②).
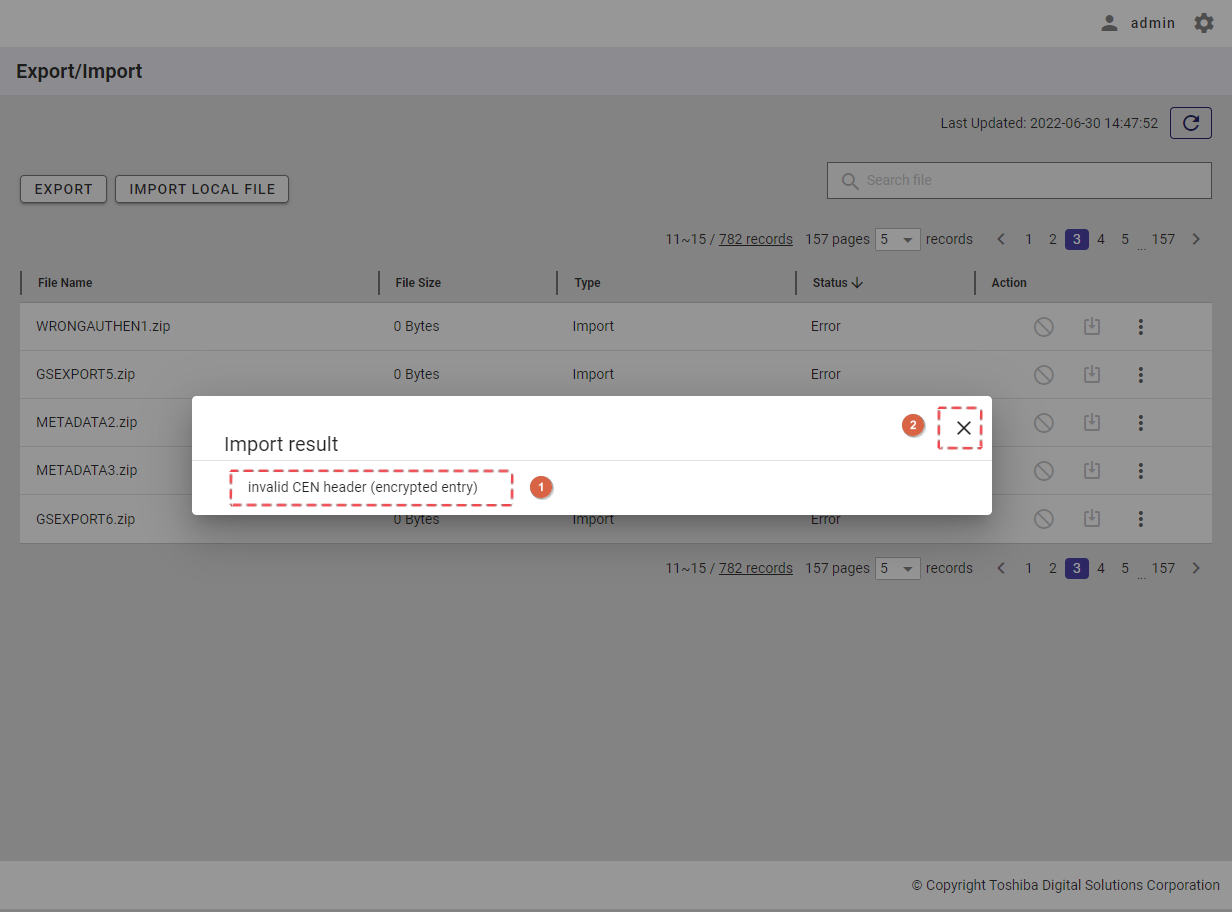
4.16.6 Importing an exported file
This function allows the user to import the exported file directly from the Azure storage without uploading the exported file from your local disk.
Step 1: Click the [IMPORT] button.
[Note]: This function only applies to the export process with the status Completed.
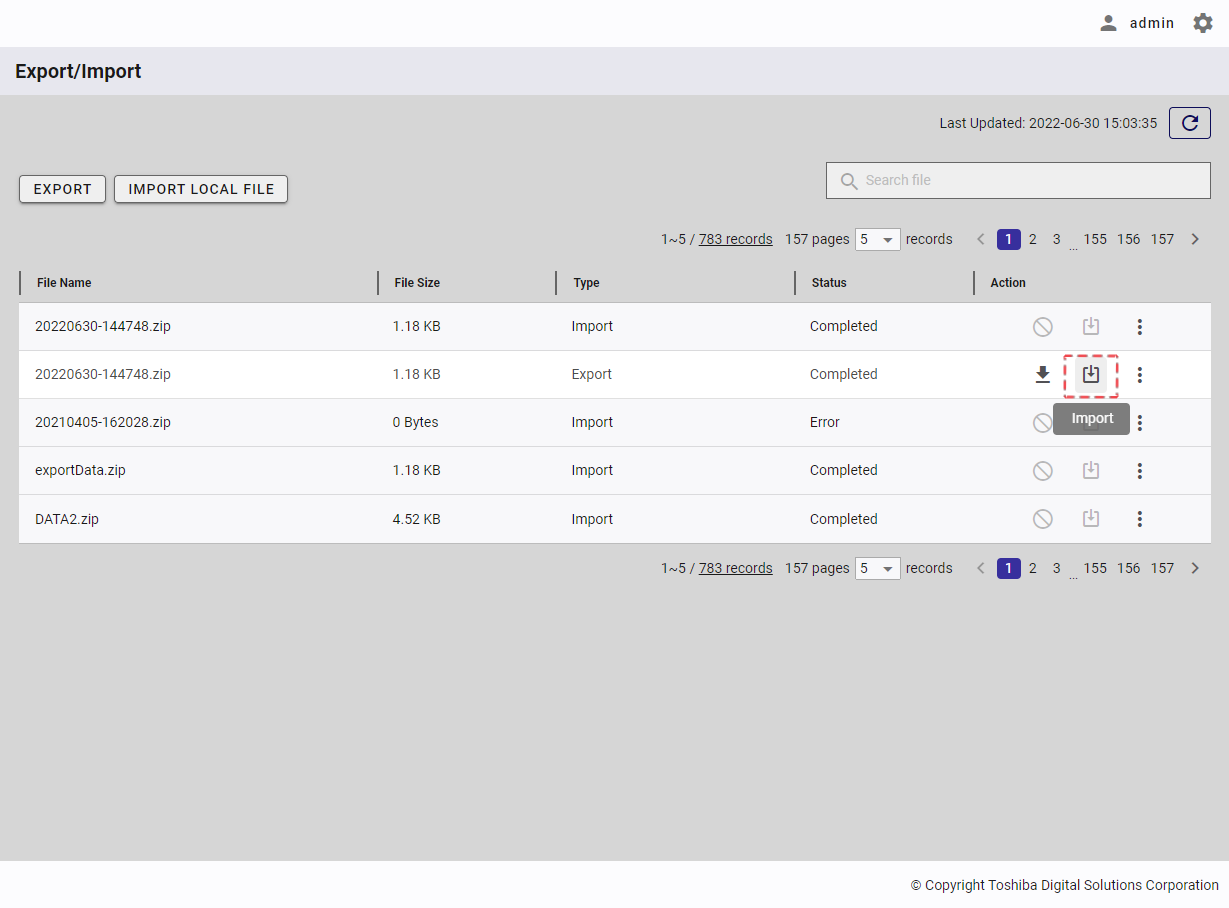
Step 2: Select the Import Unit from the choices available: [All], [Database], or [Container].
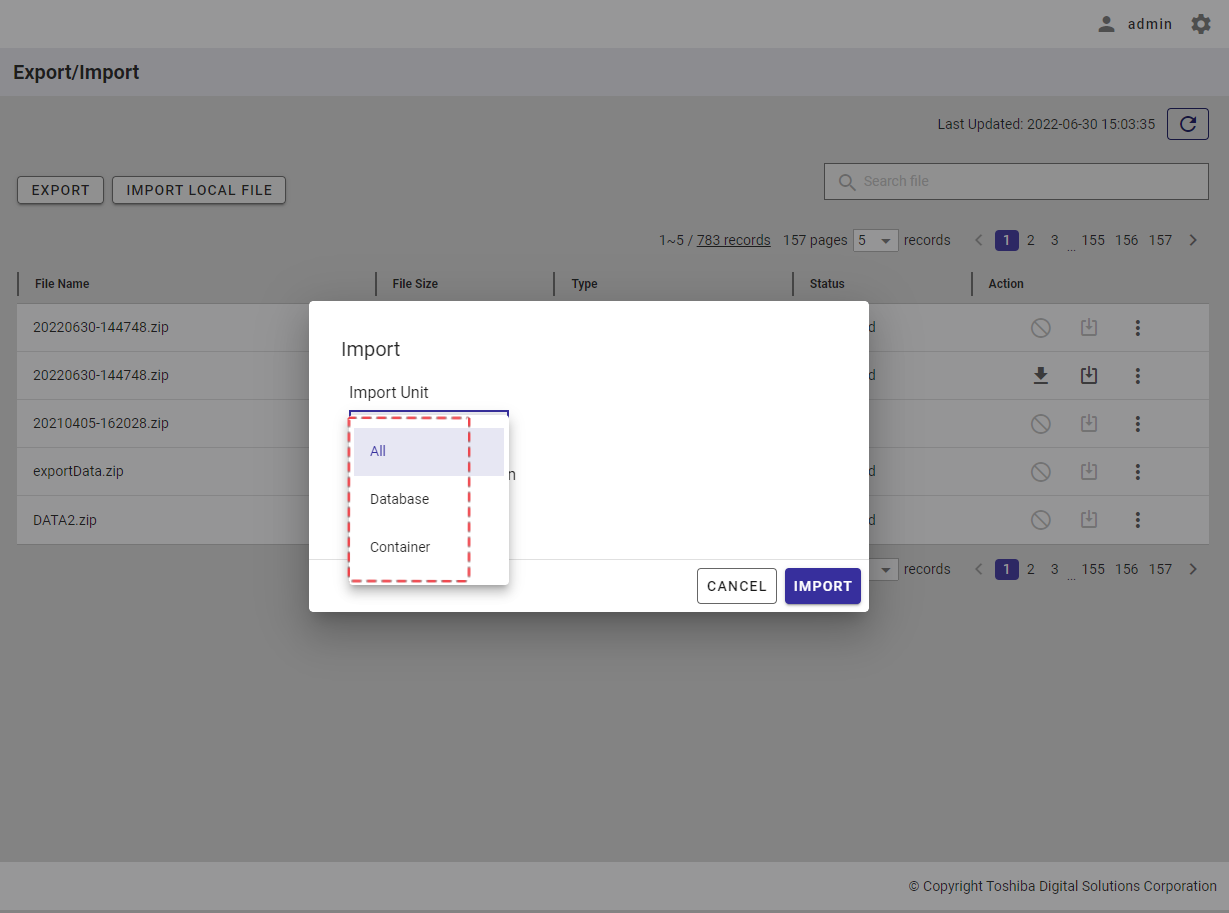
- Types of Import Unit:
| Import Unit | Description |
|---|---|
| All | Imports all the data in the exported file. |
| Database | Allows importing one or multiple databases in the exported file. |
| Container | Allows importing one or multiple containers in the database in the exported file. |
Step 3 (Optional): Select the data registration unit [Not select], [Append], or [Replace].
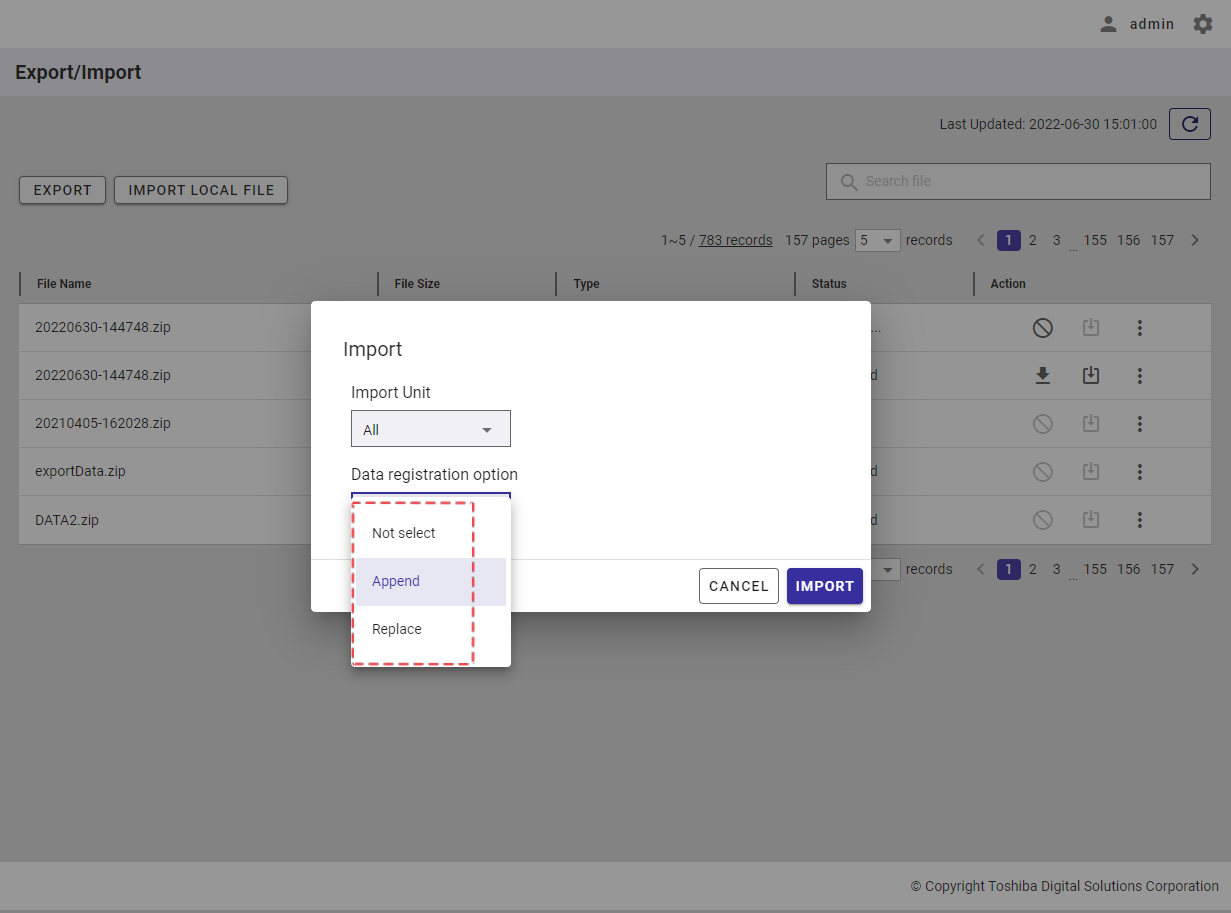
- Types of data registration option:
| Data registration option | Description |
|---|---|
| Not select | An error will occur if the container that you are trying to import already exists in the GridDB cluster. |
| Append | Data can be registered and updated in an existing container. |
| Replace | Deletes the existing container, creates a new container, and registers data in it. |
Step 4: Click the [IMPORT] button to import data. Or click the [CANCEL] button to go back to the Export/Import screen without importing data.
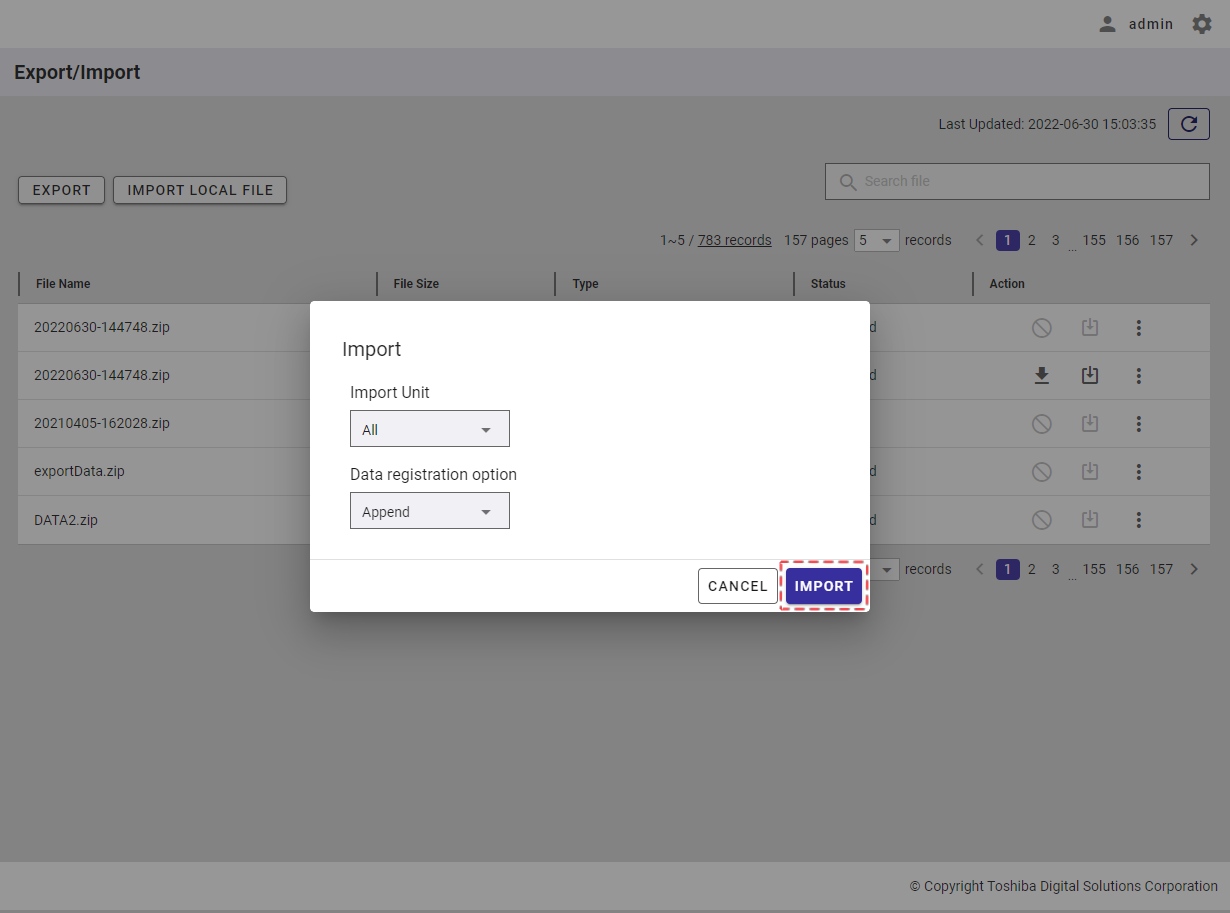
Step 5: Once the [IMPORT] button is clicked, a confirmation dialog will be displayed. Click the [YES] button to start importing data. If you do not want to start importing data, you can click the [NO] button to close the confirmation dialog and return to the Import dialog without importing data.
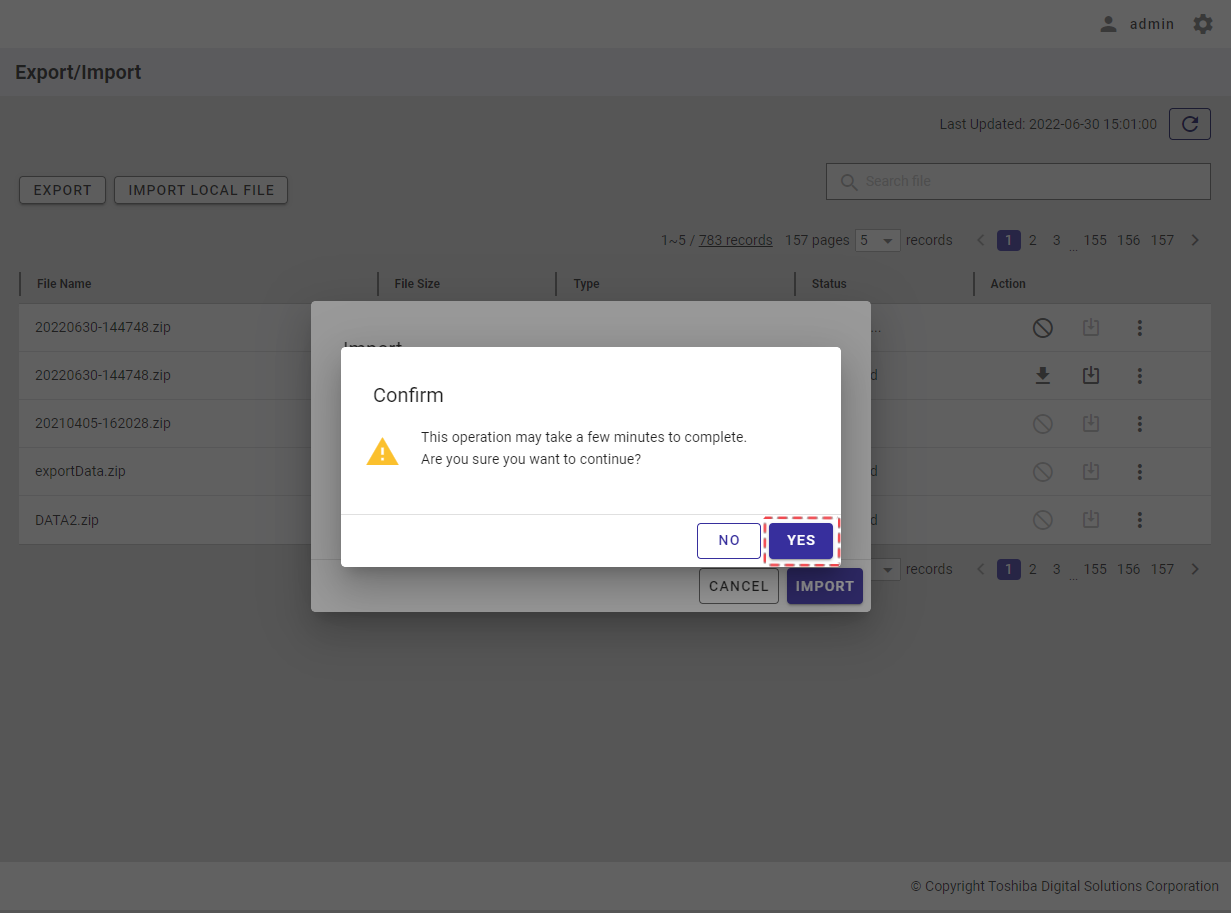
A new import process is then added to the Export/Import list.
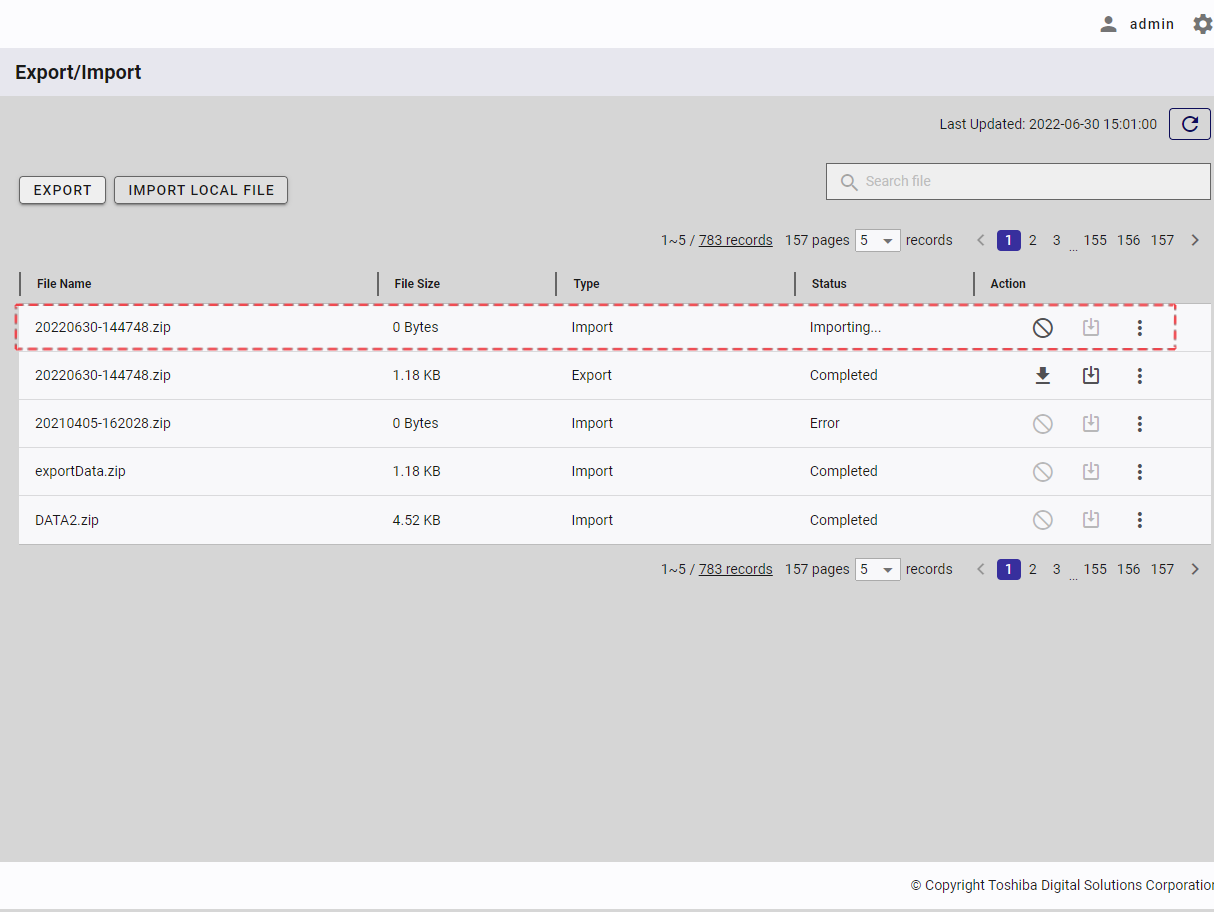
4.16.7 Importing a local file
This function allows users to import a local file that has been uploaded.
Step 1: Click the [IMPORT LOCAL FILE] button.
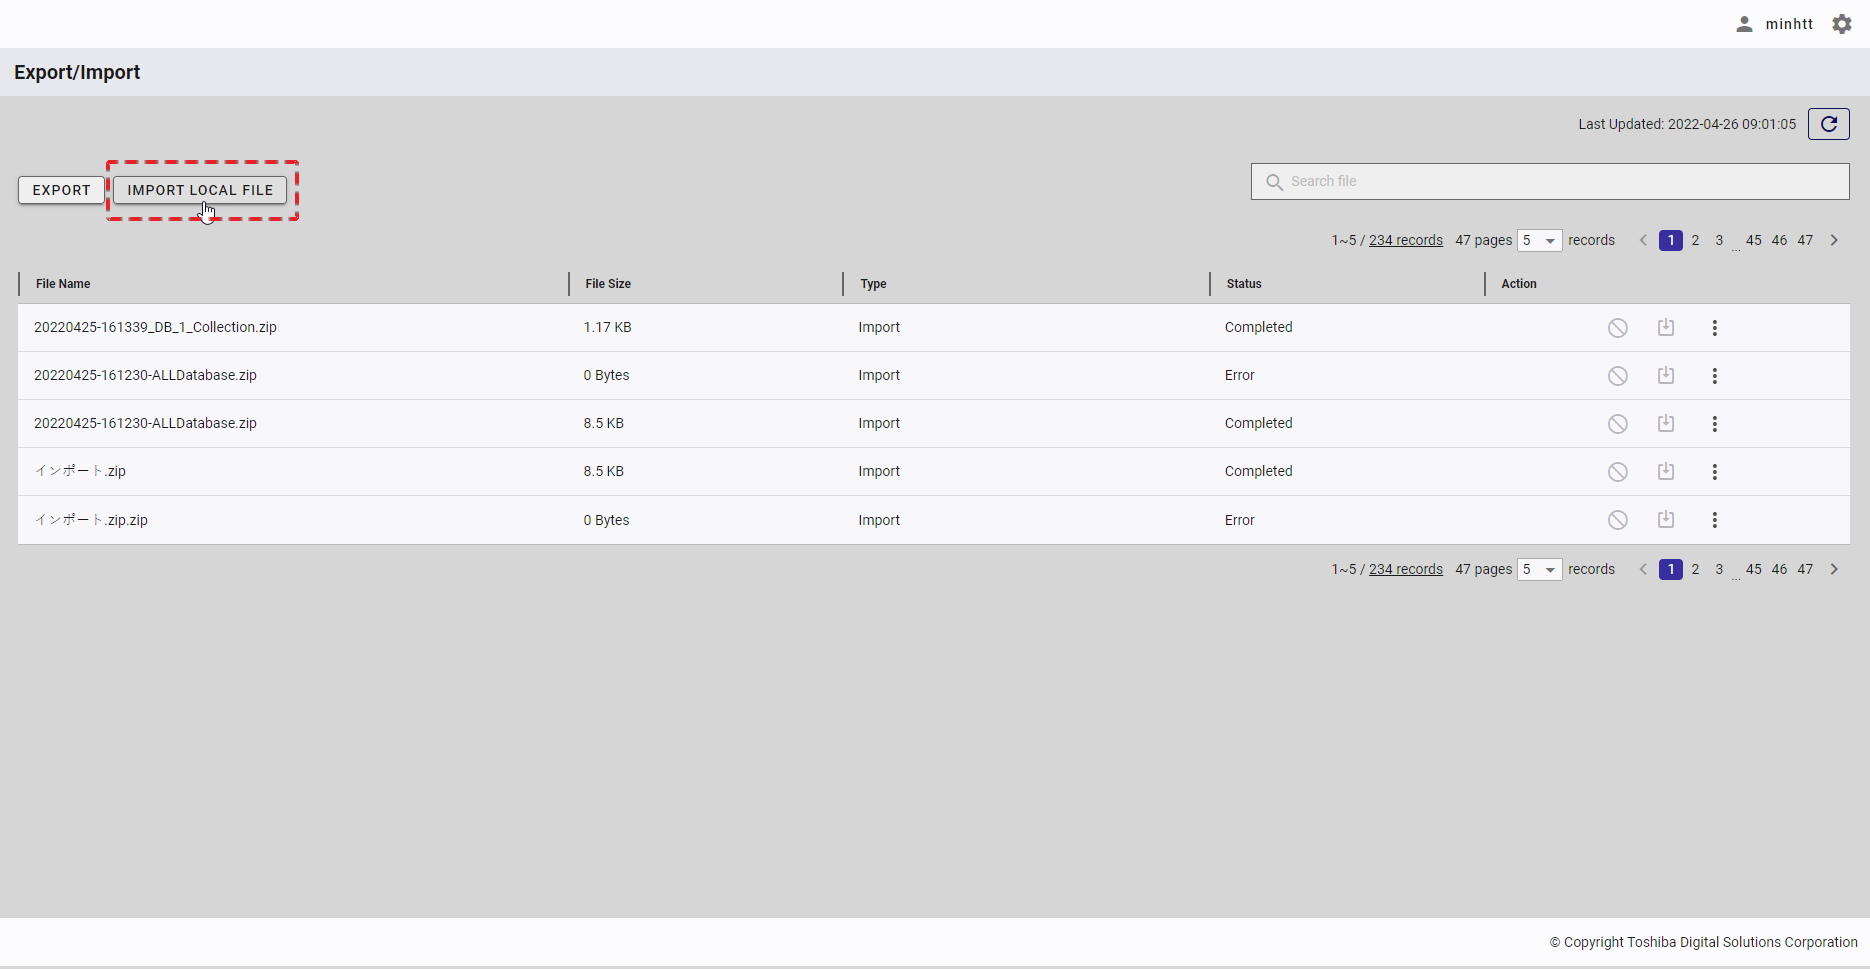
Step 2: Click the File field to display a dialog where you select a local file to be uploaded. This file must meet the following requirements:
- The file must be a '.zip' file.
- The file must be one of the following three:
- (1) a file that has been exported on GridDB Cloud and downloaded.
- (2) a file exported from an on-premises database using the GridDB export/import tools.
- (3) a file manually created to resemble (1) or (2) above.
- The maximum file size is 500MB.
Import fails when a local file that does not meet the above requirements is specified.
[Note]: You can check the local file requirements by clicking the arrow on the right.
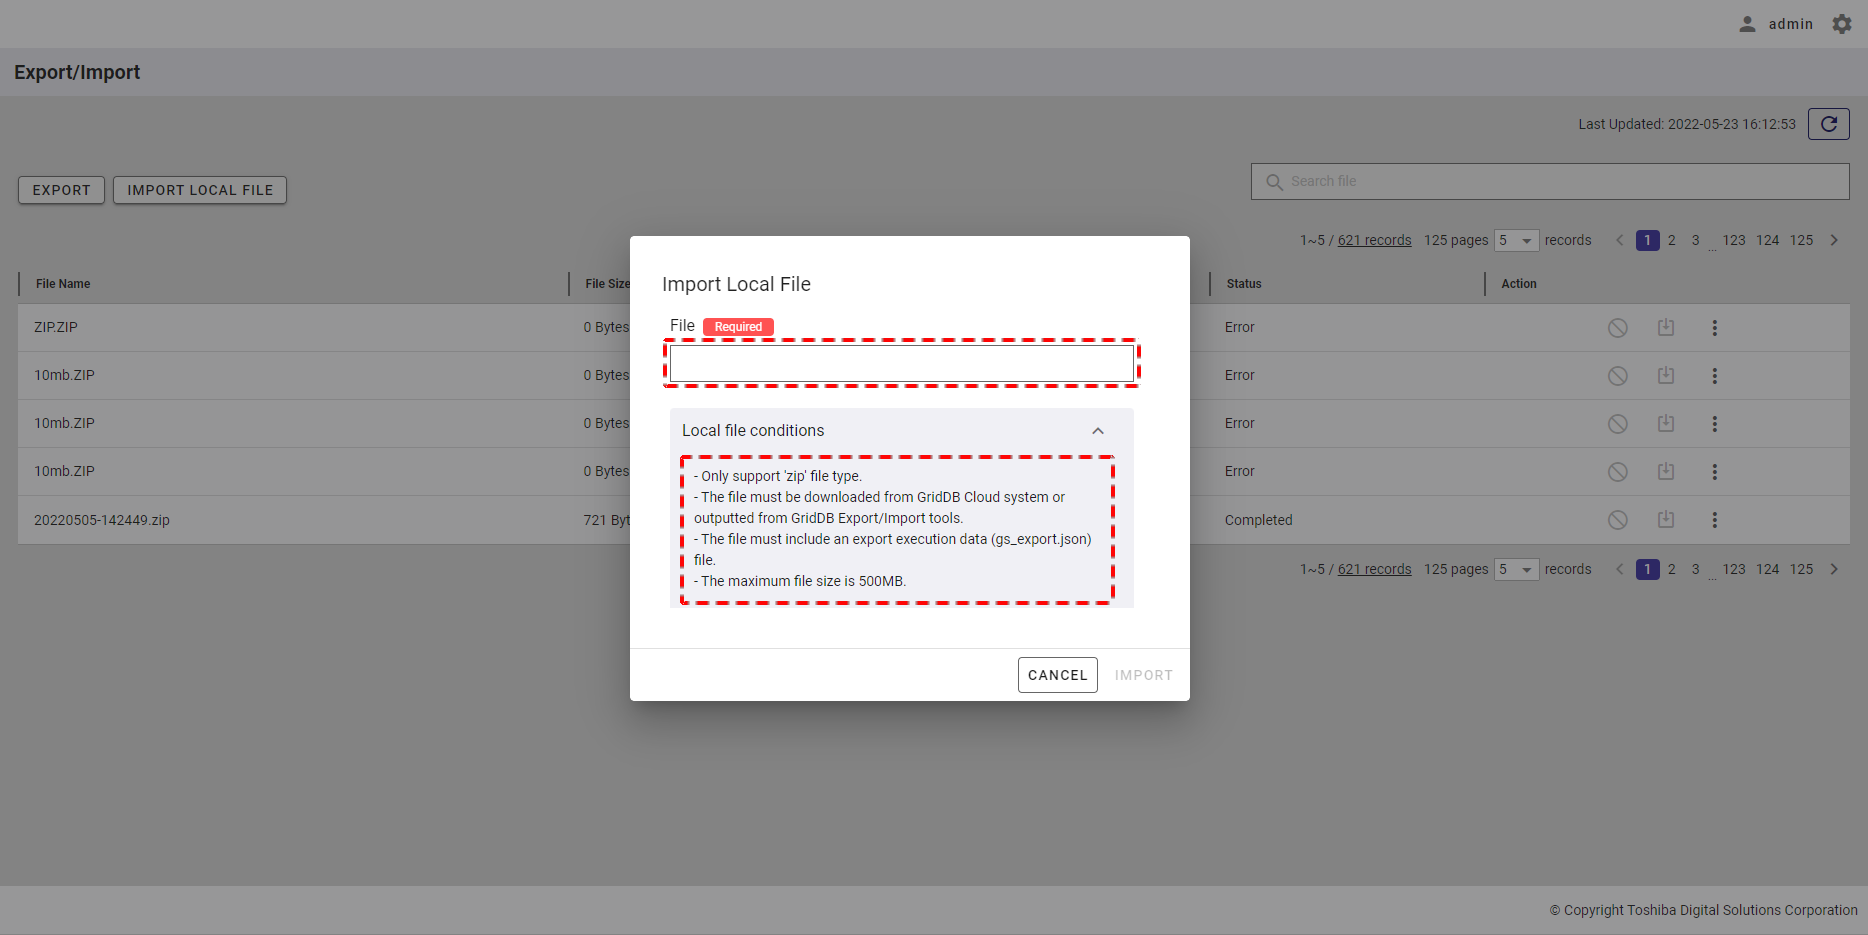
Step 3: Select the Import Unit from the choices available: [All], [Database], or [Container].
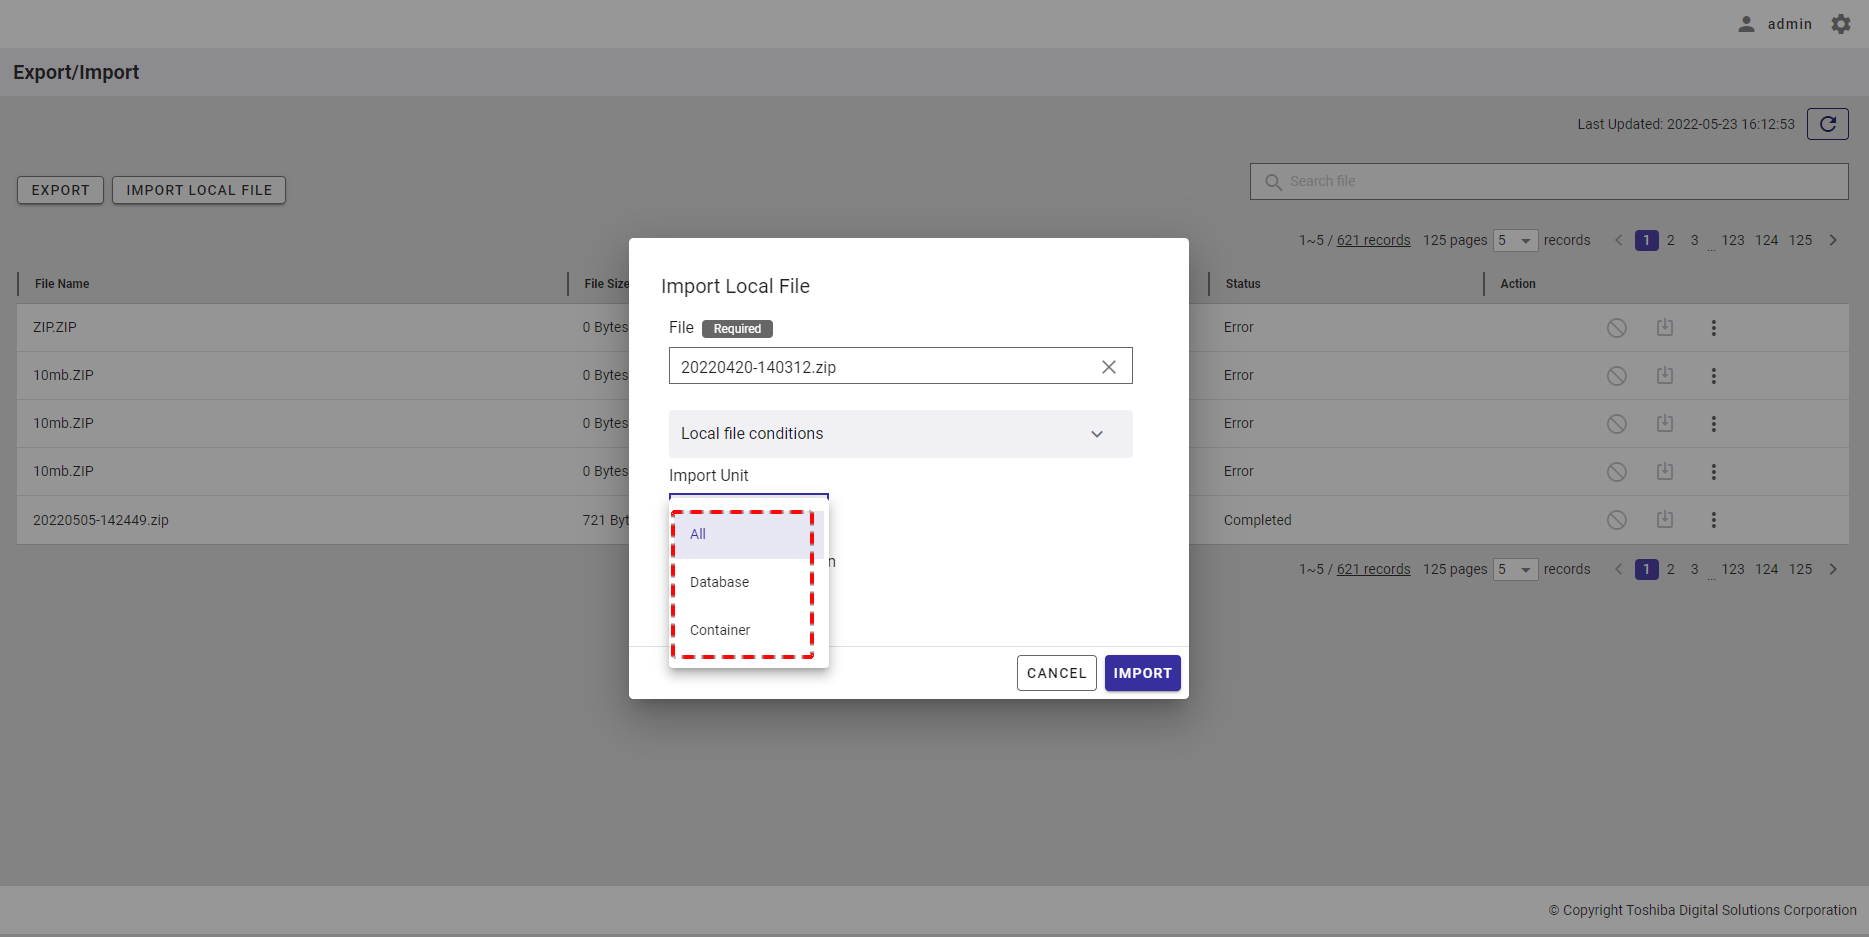
- Types of Import Unit:
| Import Unit | Description |
|---|---|
| All | Imports all of the data in a local file. |
| Database | Allows importing one or multiple databases in a local file. |
| Container | Allows importing one or multiple containers in the database in a local file. |
Step 4 (Optional): Select the data registration unit [Not select], [Append], or [Replace].
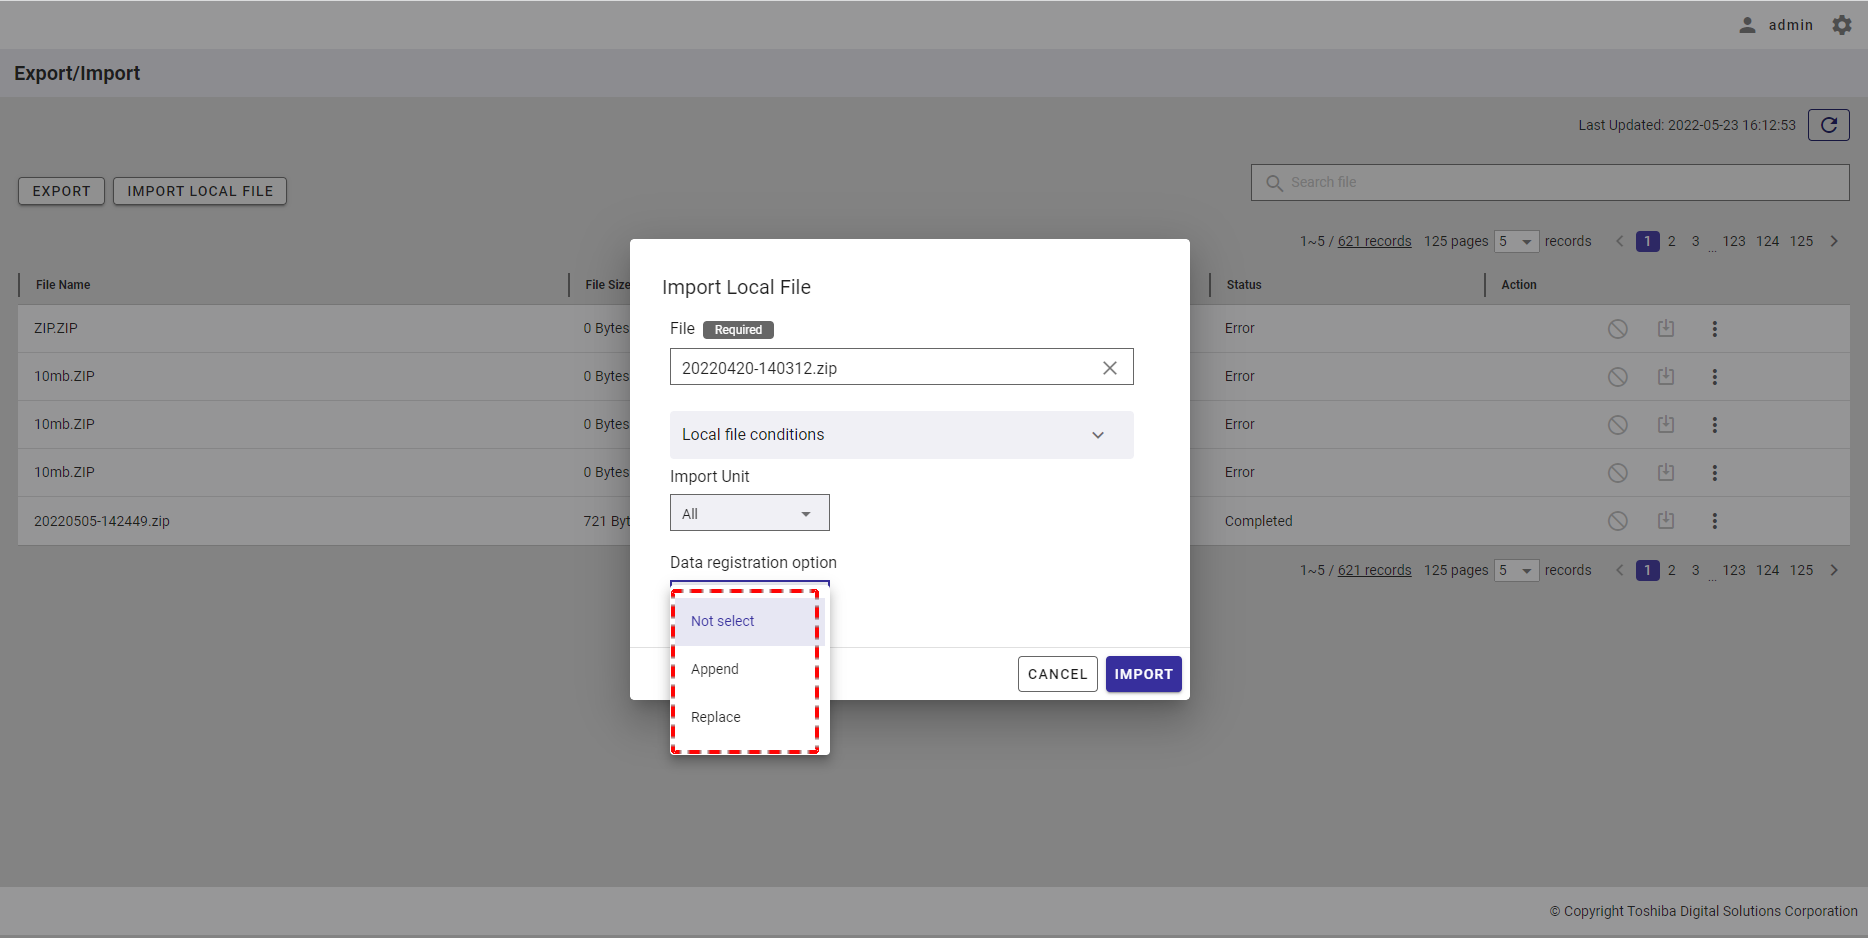
- Types of data registration option:
| Data registration option | Description |
|---|---|
| Not select | An error will occur if the container that you are trying to import already exists in the GridDB cluster. |
| Append | Data can be registered and updated in an existing container. |
| Replace | Deletes the existing container, creates a new container, and registers data in it. |
Step 5: Click the [IMPORT] button to import data. Or click the [CANCEL] button to go back to the Export/Import screen without importing data.
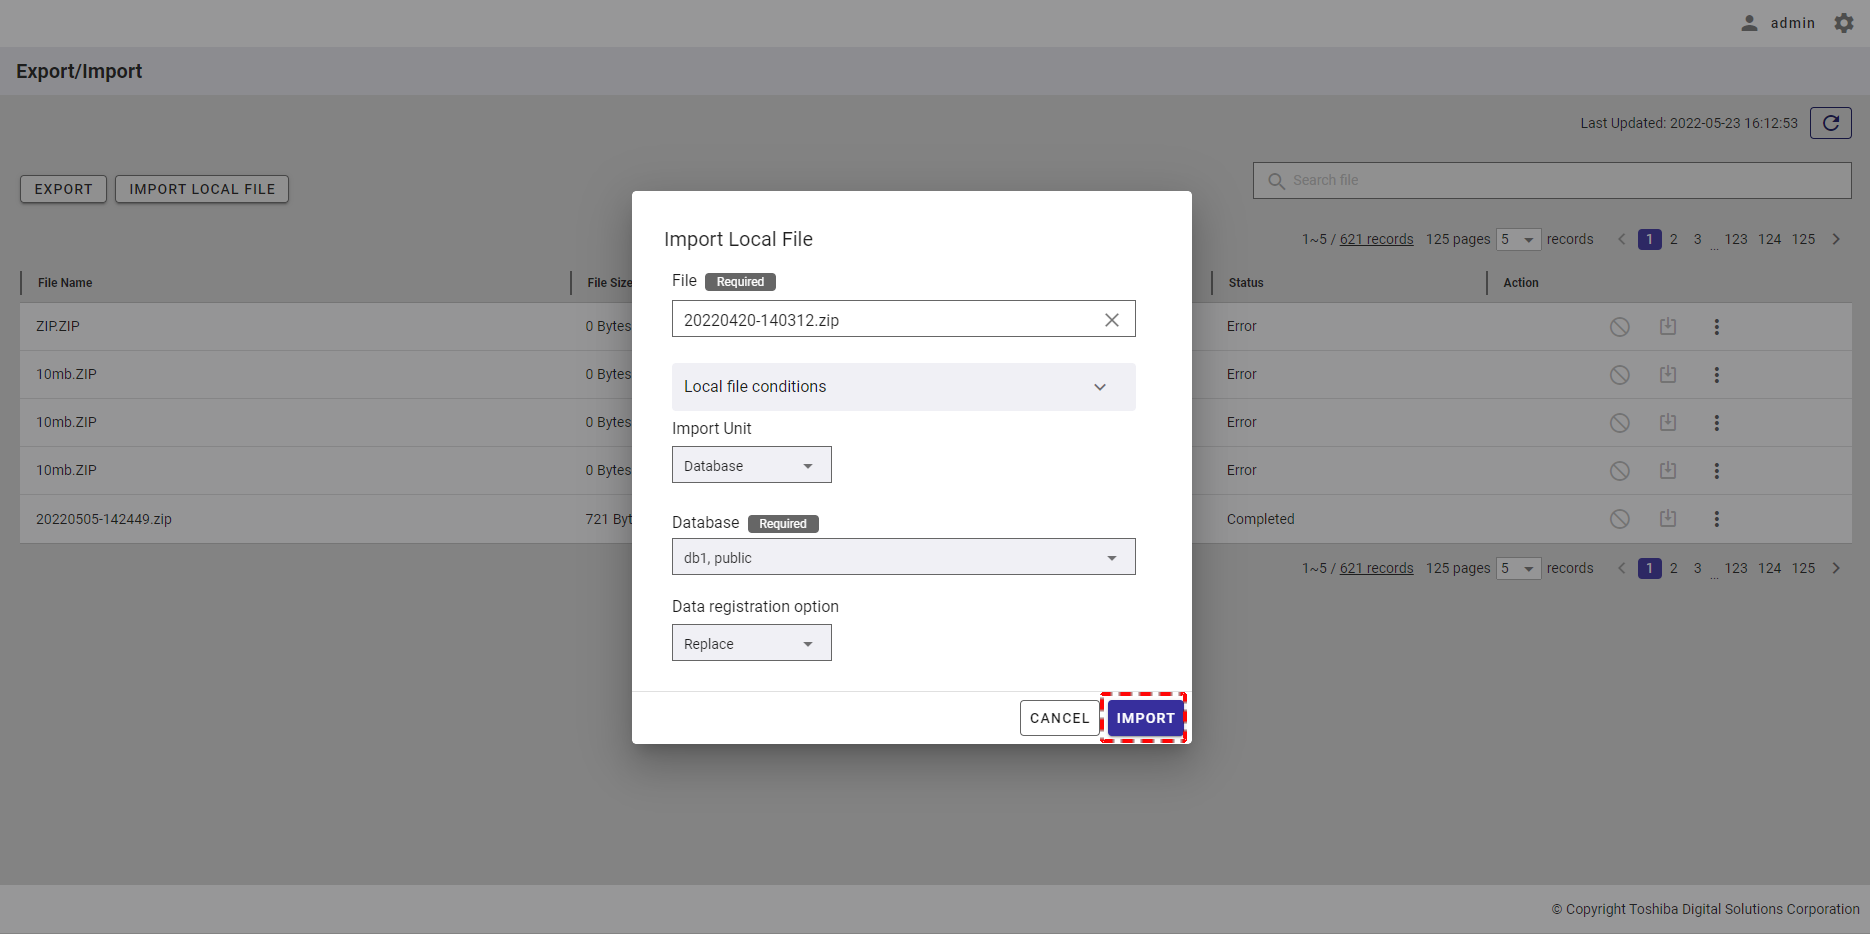
Step 6: Once the [IMPORT] button is clicked, a confirmation dialog will be displayed. Click the [YES] button to start to import data. If you do not want to start to import data, you can click the [NO] button to close the confirmation dialog and return to the Import dialog without importing data.
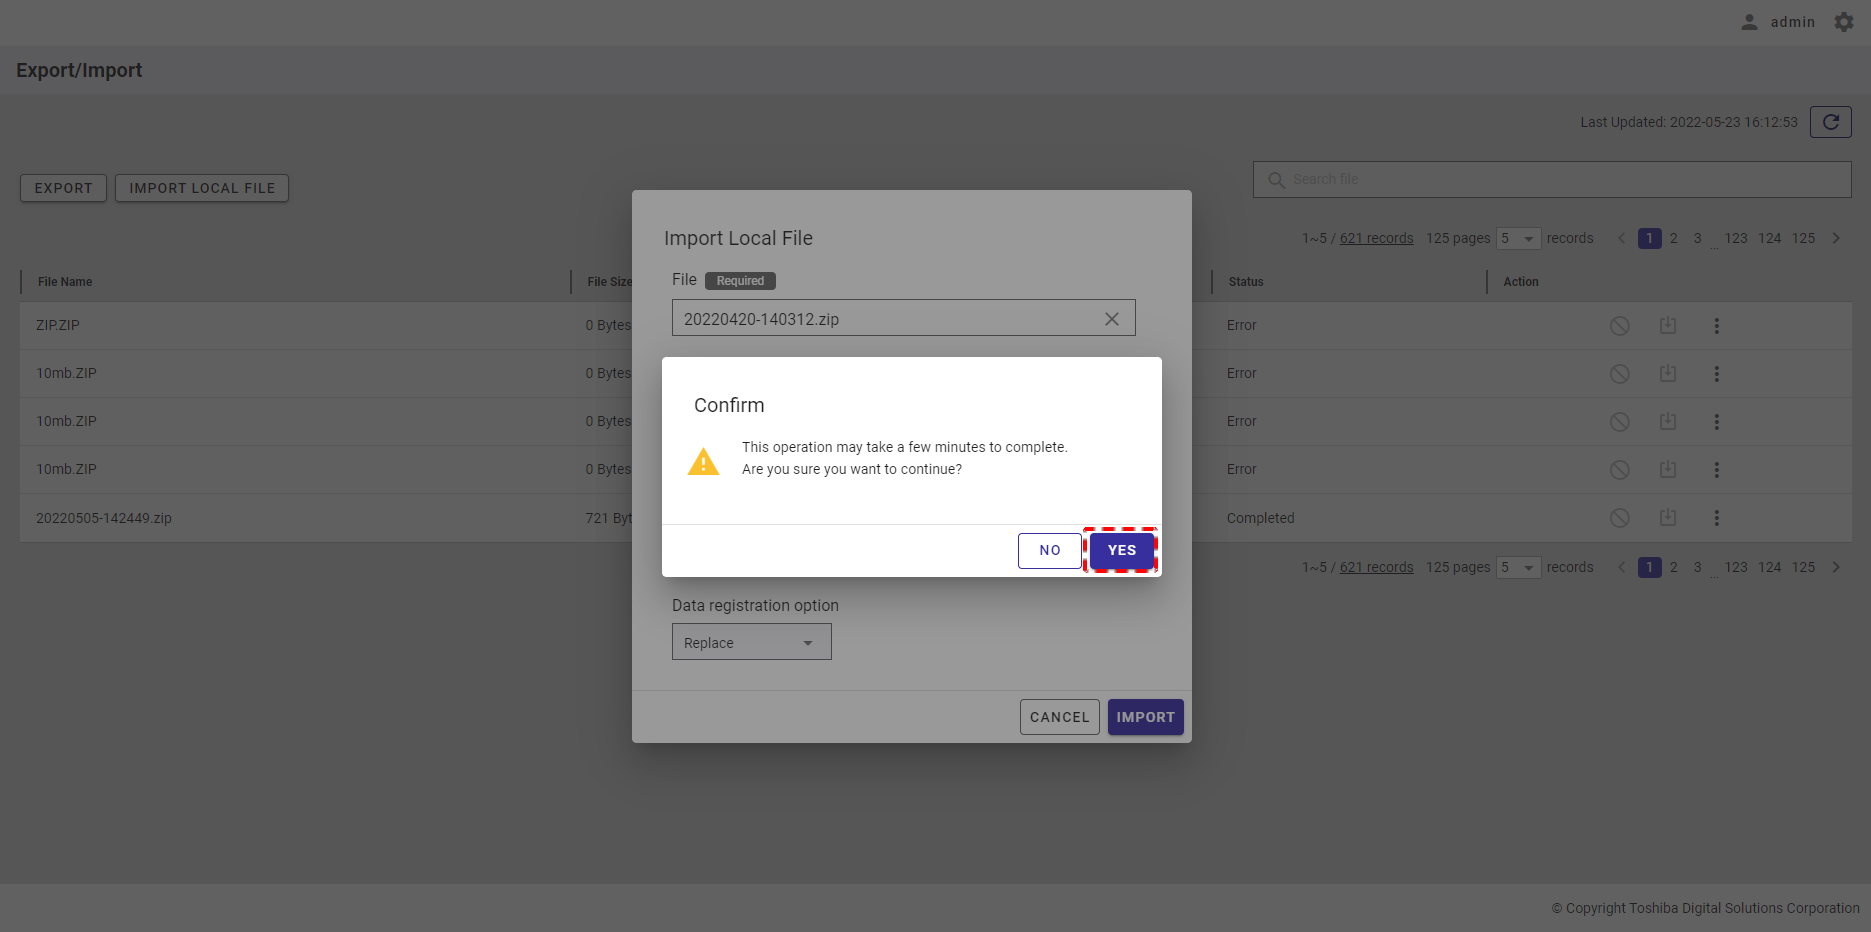
A new import process is then added to the Export/Import list.
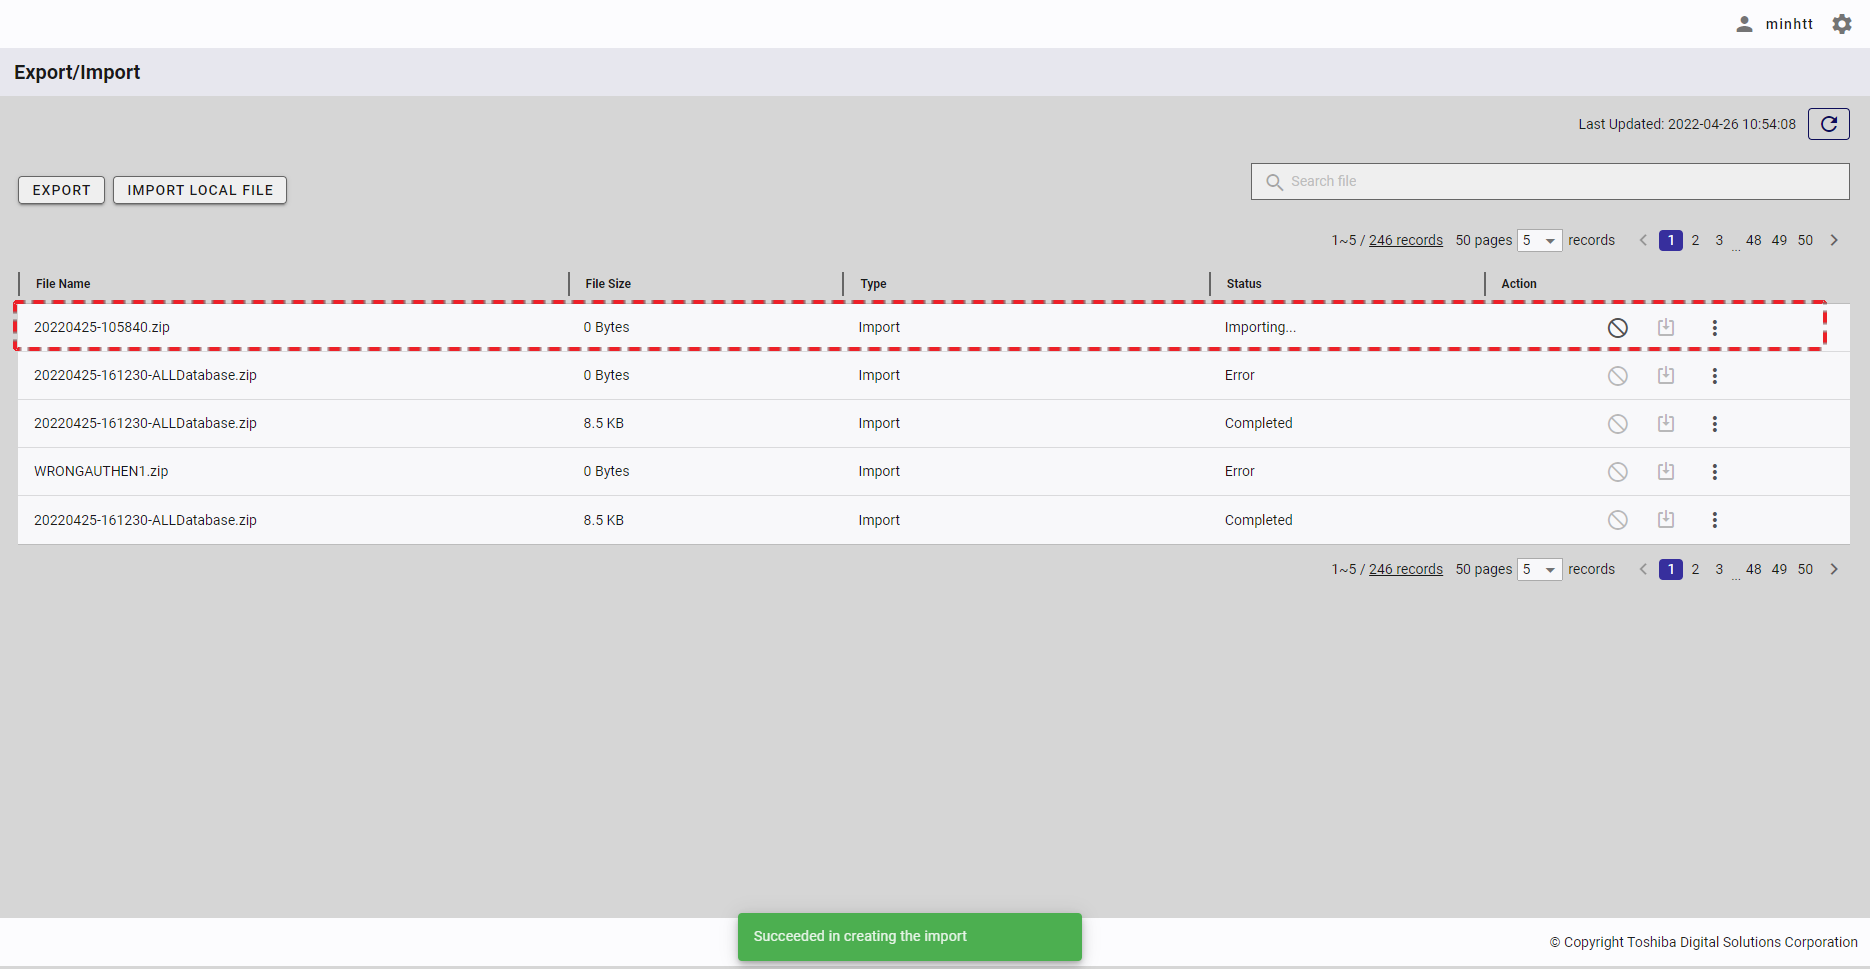
4.16.8 Canceling an export/import process
Step 1: To cancel an export/import process, click the [CANCEL] button.
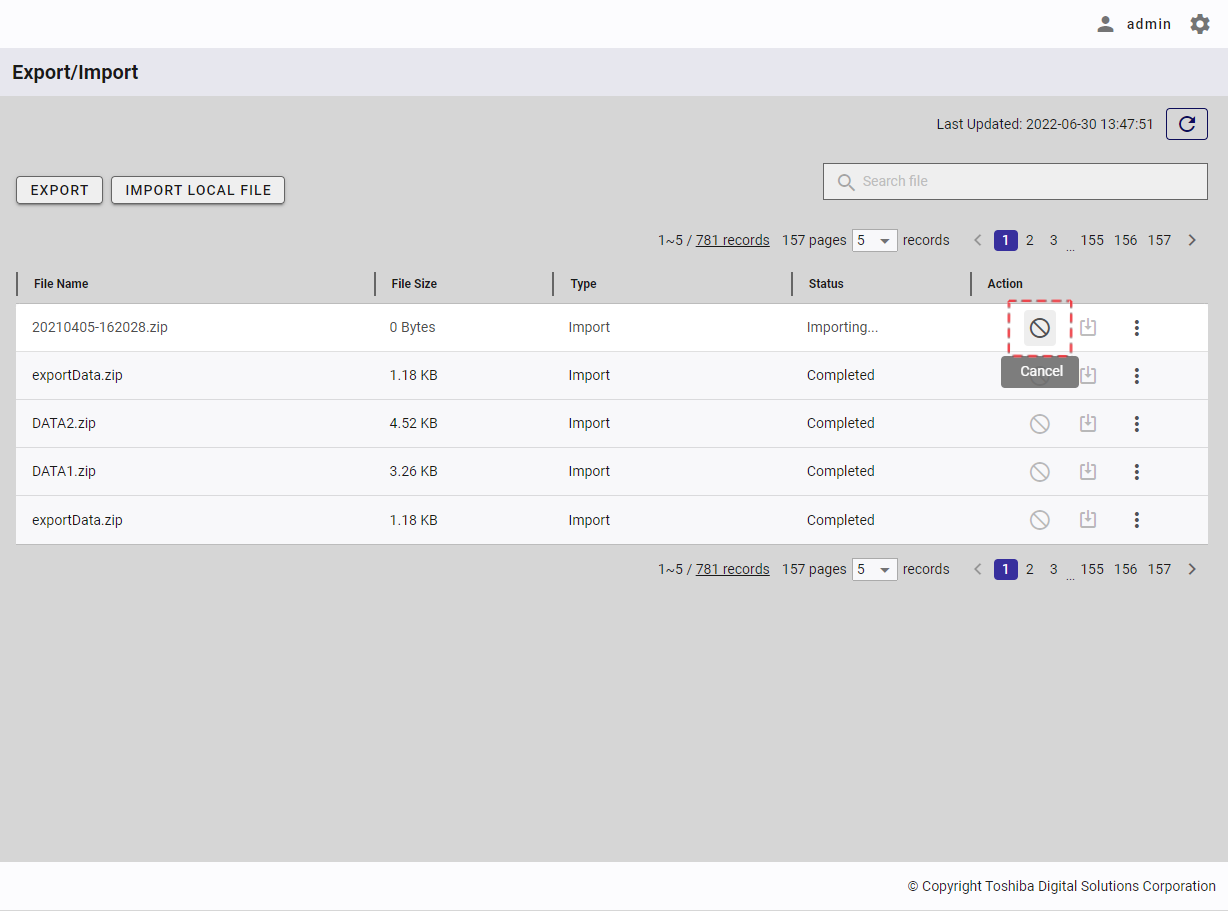
[Note]: The export/import process can be canceled only when the status of the export/import process is Exporting or Importing.
Step 2: After the confirmation dialog is displayed, click the [YES] button to continue to cancel the export/import process. Or click the [NO] button to go back to the export/import screen without canceling the export/import process.
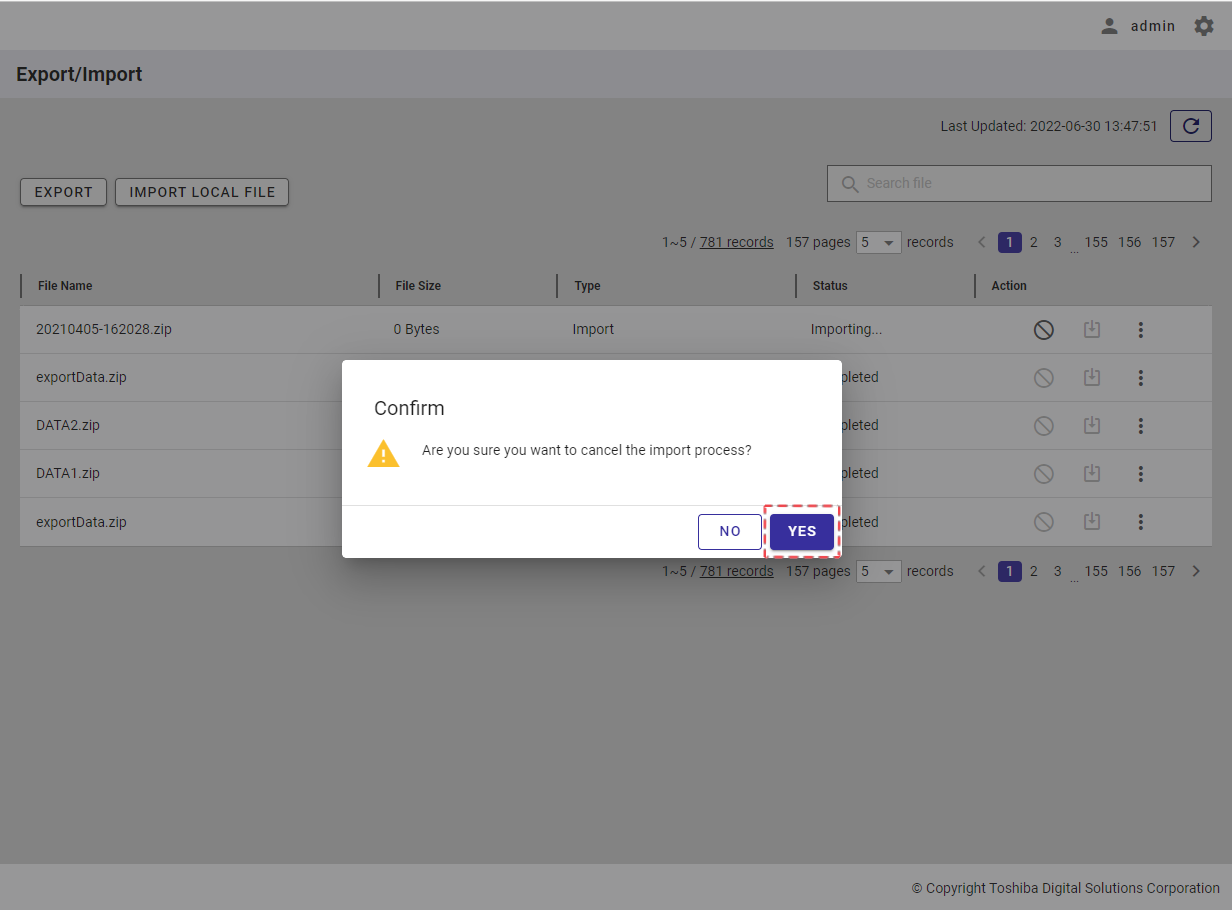
When the export/import process is successfully canceled, the status of the export/import process will be Error.
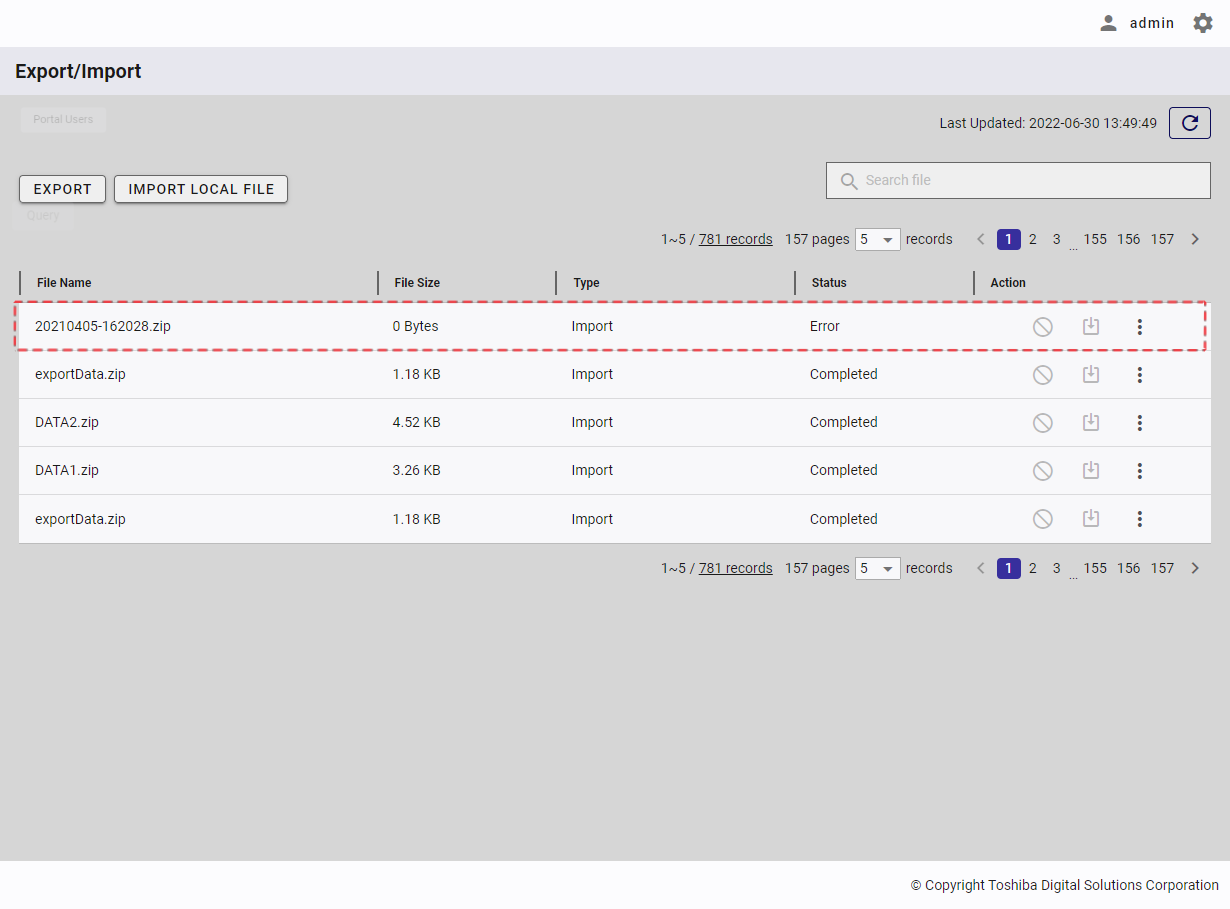
4.16.9 Deleting an export/import process
Step 1: Click the [Menu] button (①). In the drop-down list, select the [Delete] item (②) to delete an export/import process.
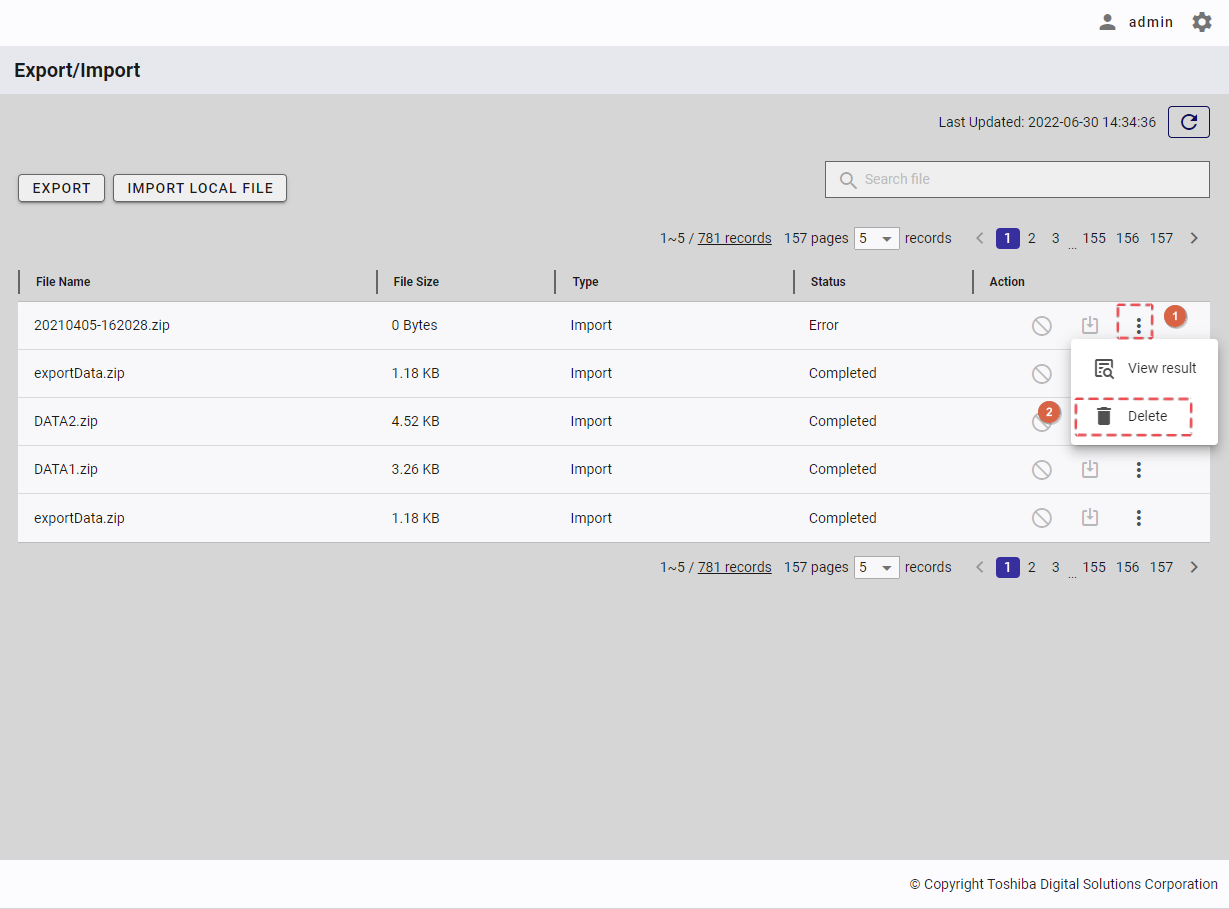
[Note]: The export/import process can be deleted only when the status of the export/import process is Error or Completed.
Step 2: After the confirmation dialog is displayed, click the [YES] button to continue to delete the export/import process. Or click the [NO] button to go back to the export/import screen without deleting the export/import process.
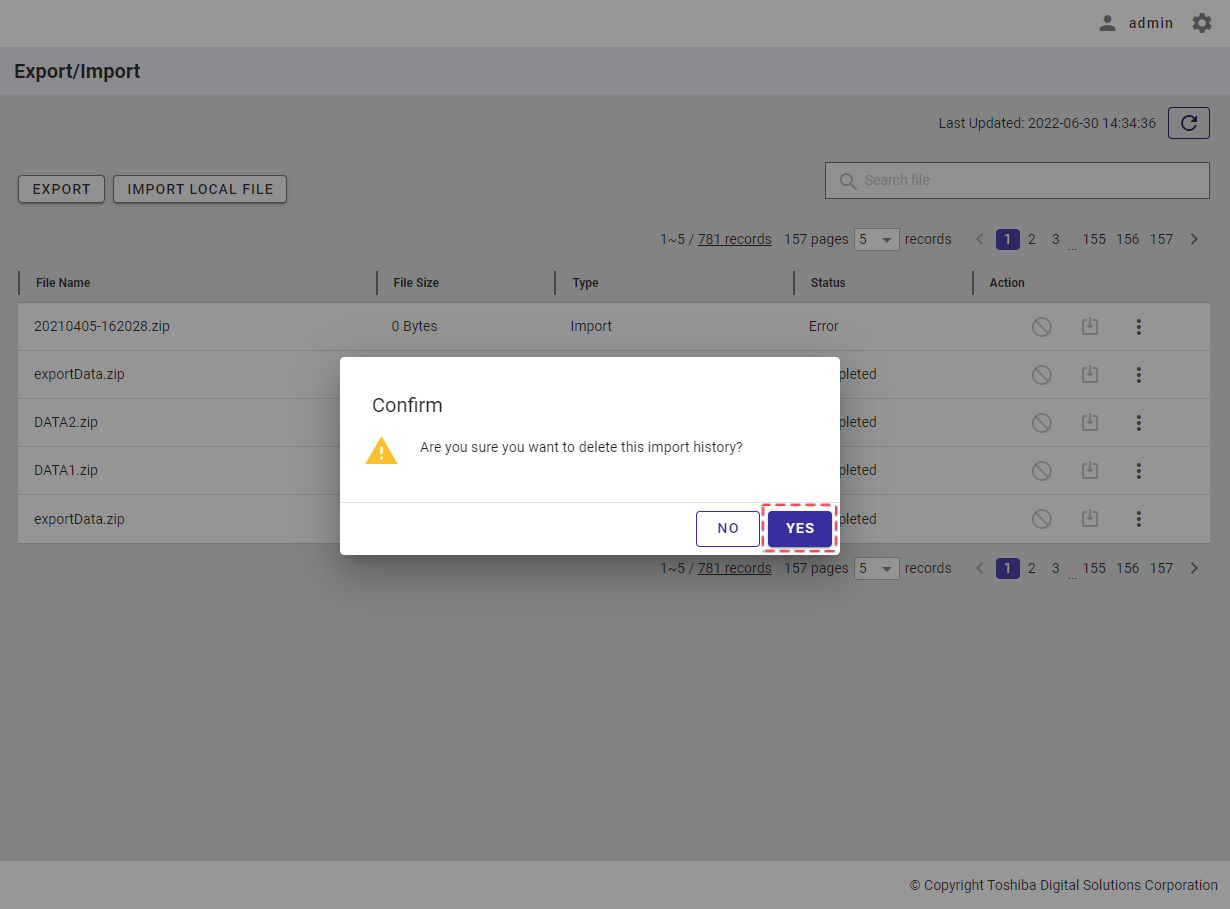
When the export/import process is successfully deleted, the system will go back to the export/import screen where the deleted export/import process is not found.
4.17 Logs function
This function is used for displaying node logs.
To access the Node Logs screen, first you must log in to the system and then click the item [Logs] in the left menu.
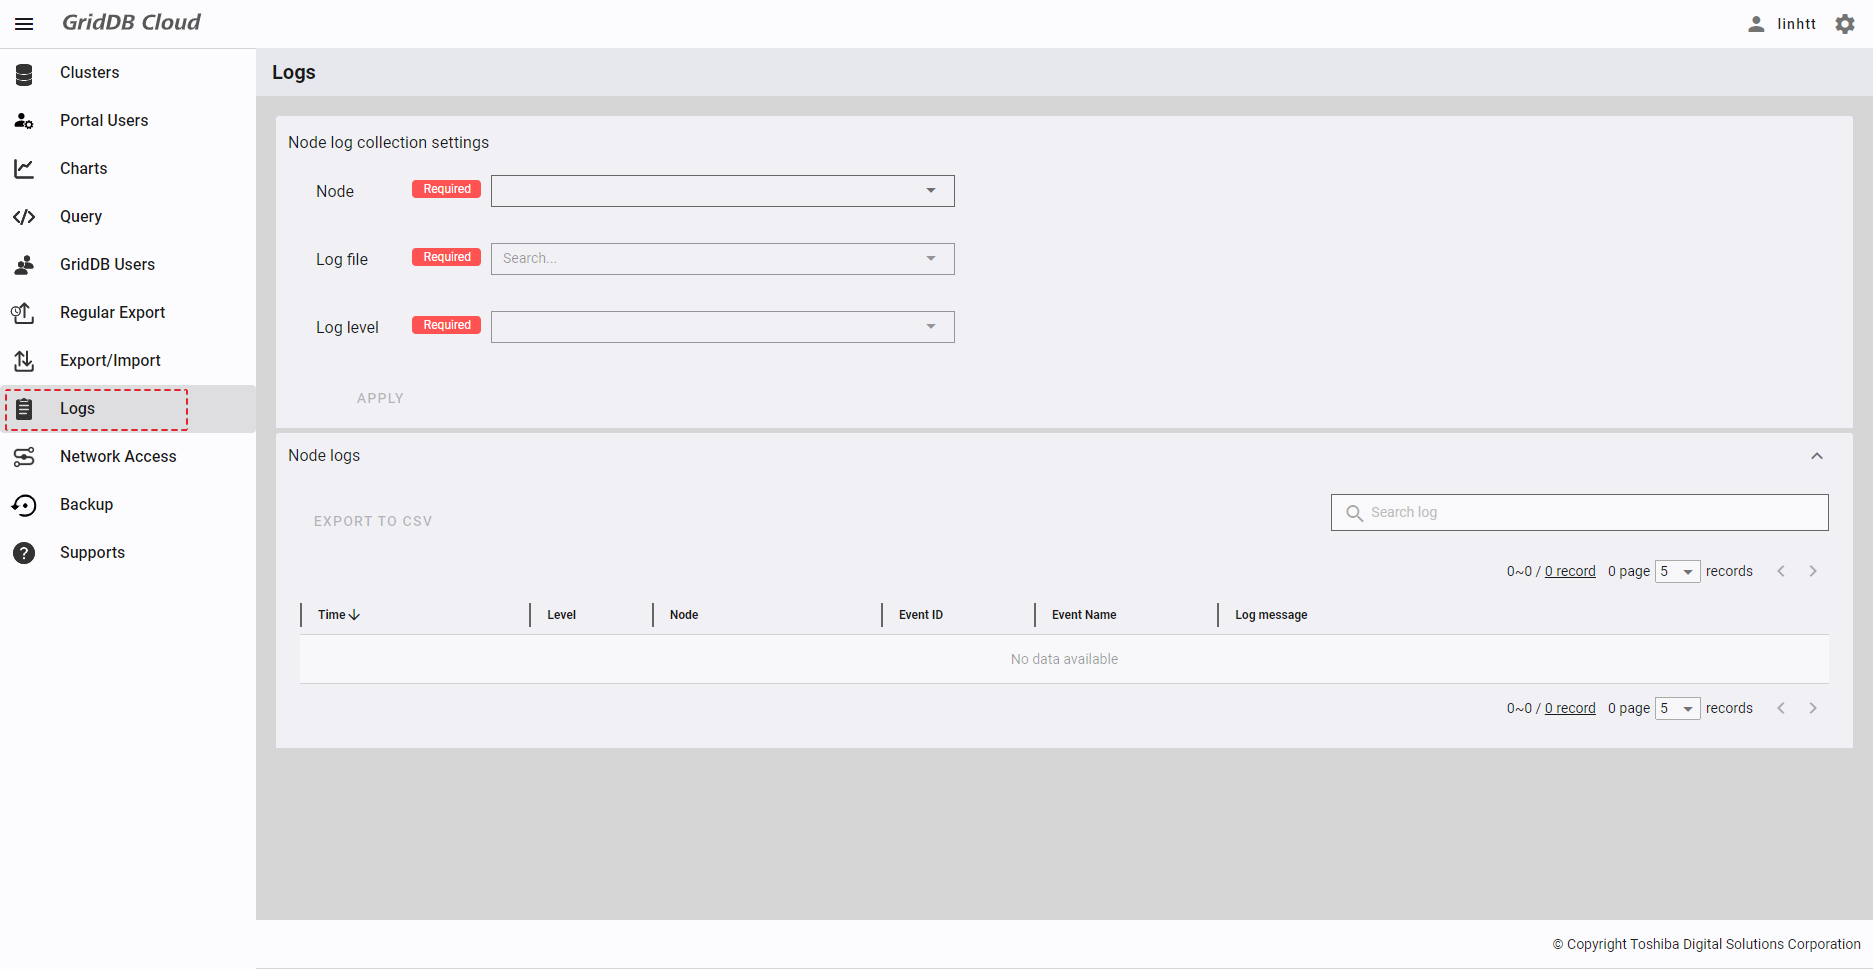
4.17.1 Available roles
In the table below, the role with a plus sign (+) can use the function on the left.
| No. | Function | General user | Administrator user |
|---|---|---|---|
| 1 | Display node logs | + | + |
| 2 | Export data to a CSV file | + | + |
4.17.2 Displaying node logs
Step 1: In the Node Logs screen, you can select one or multiple nodes for which you want to see the log in the [Node] list, by checking the checkbox on the left of the node item. You can also quickly select all nodes by choosing [Select All] (①).
Then click the [APPLY] button (②) to save all the choices. You can also discard them by clicking the [CANCEL] button (③).
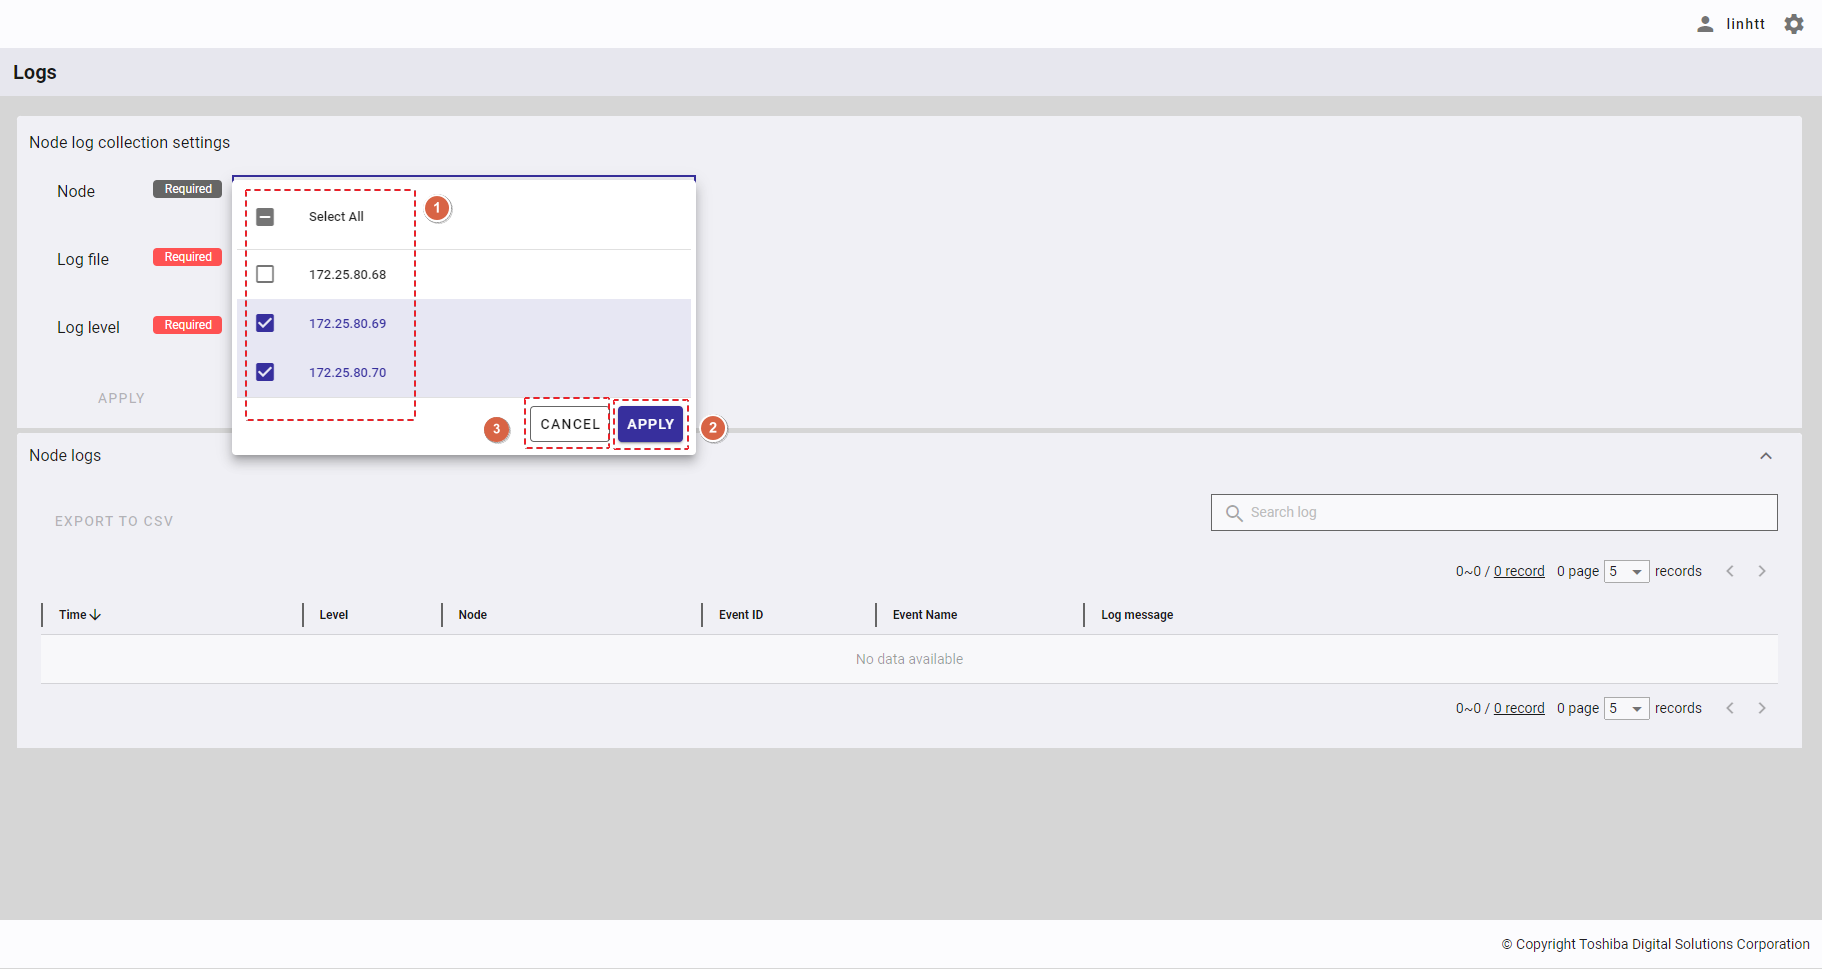
Step 2: Select the log files you want to obtain. In the drop-down list (②), select one or multiple log file(s). You can also enter the log file name in the text box (③) to search for the log file name you want to select.
To select all log files, check the checkbox for [Select All] (①).
To sort log files by the date the file was created, click the [Sort] button (④).
To apply the choices you have made, click [APPLY] (⑤). You can also discard them by clicking the [CANCEL] button (⑥).
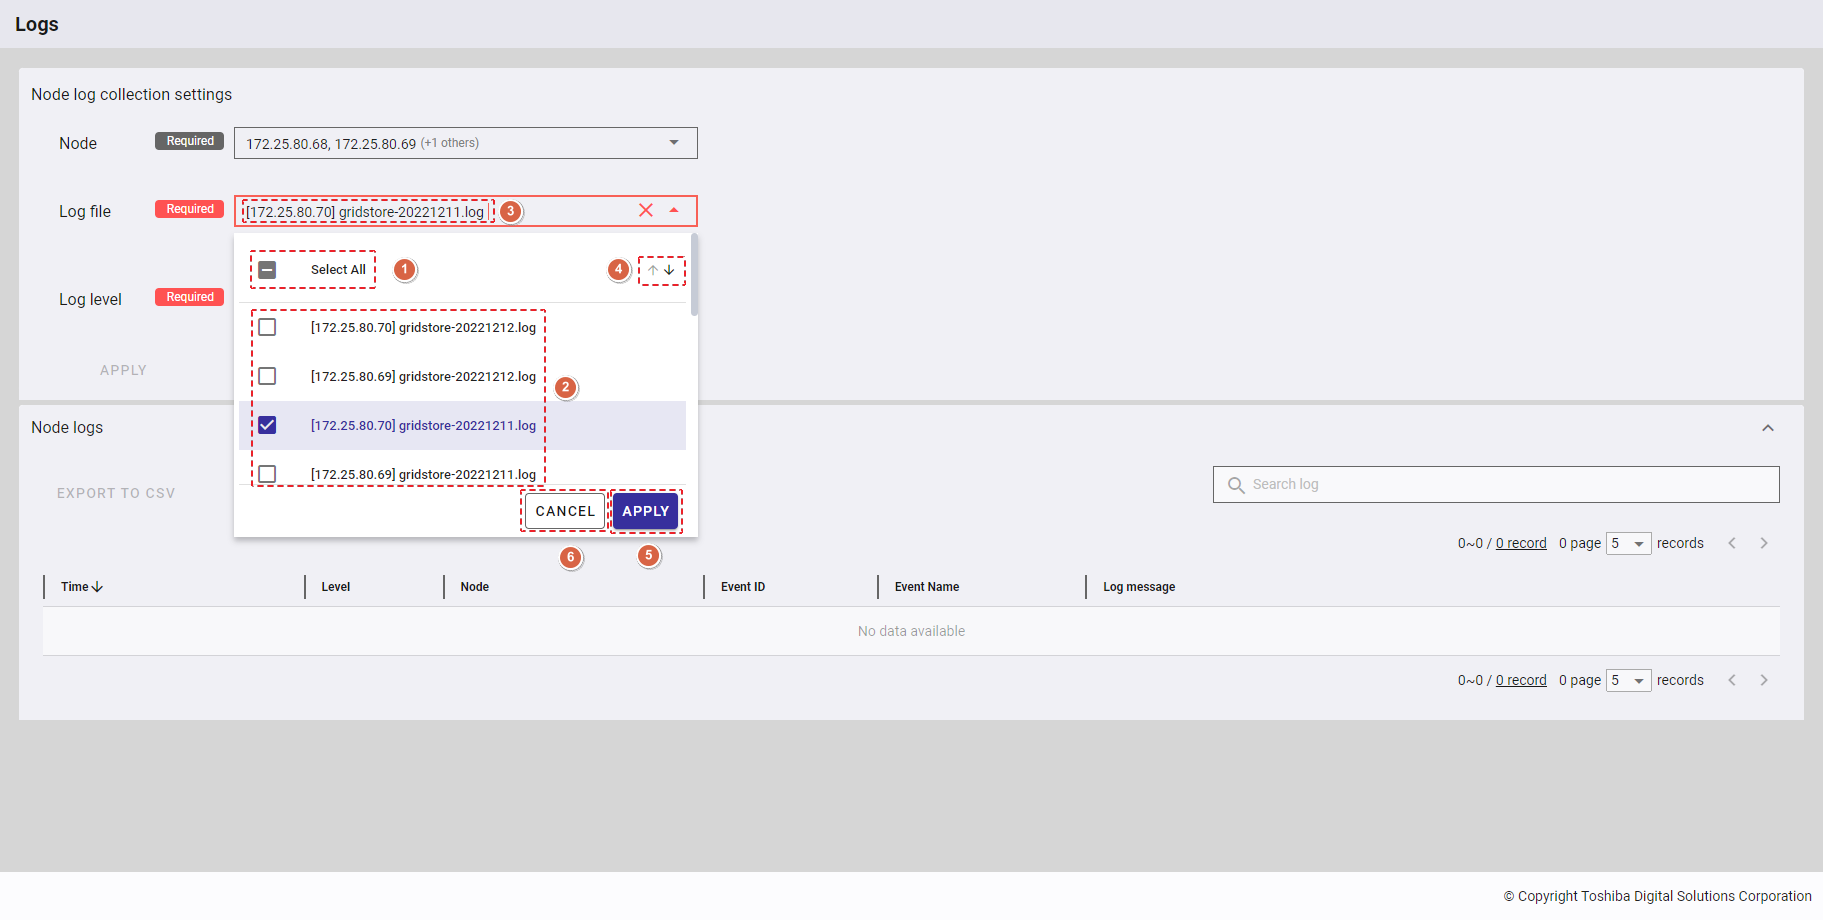
[Note]: The [Log file] will be disabled if there is no log available for the chosen node list.
Step 3: Select one or multiple log levels in the [Log level] list. There are four levels: ERROR, WARNING, INFO, and DEBUG (⑤). You can also quickly select all log levels by choosing [Select All](①).
To apply the choices you have made, click [APPLY] (⑥). You can also discard all the changes made above by clicking the [CANCEL] button (⑦).
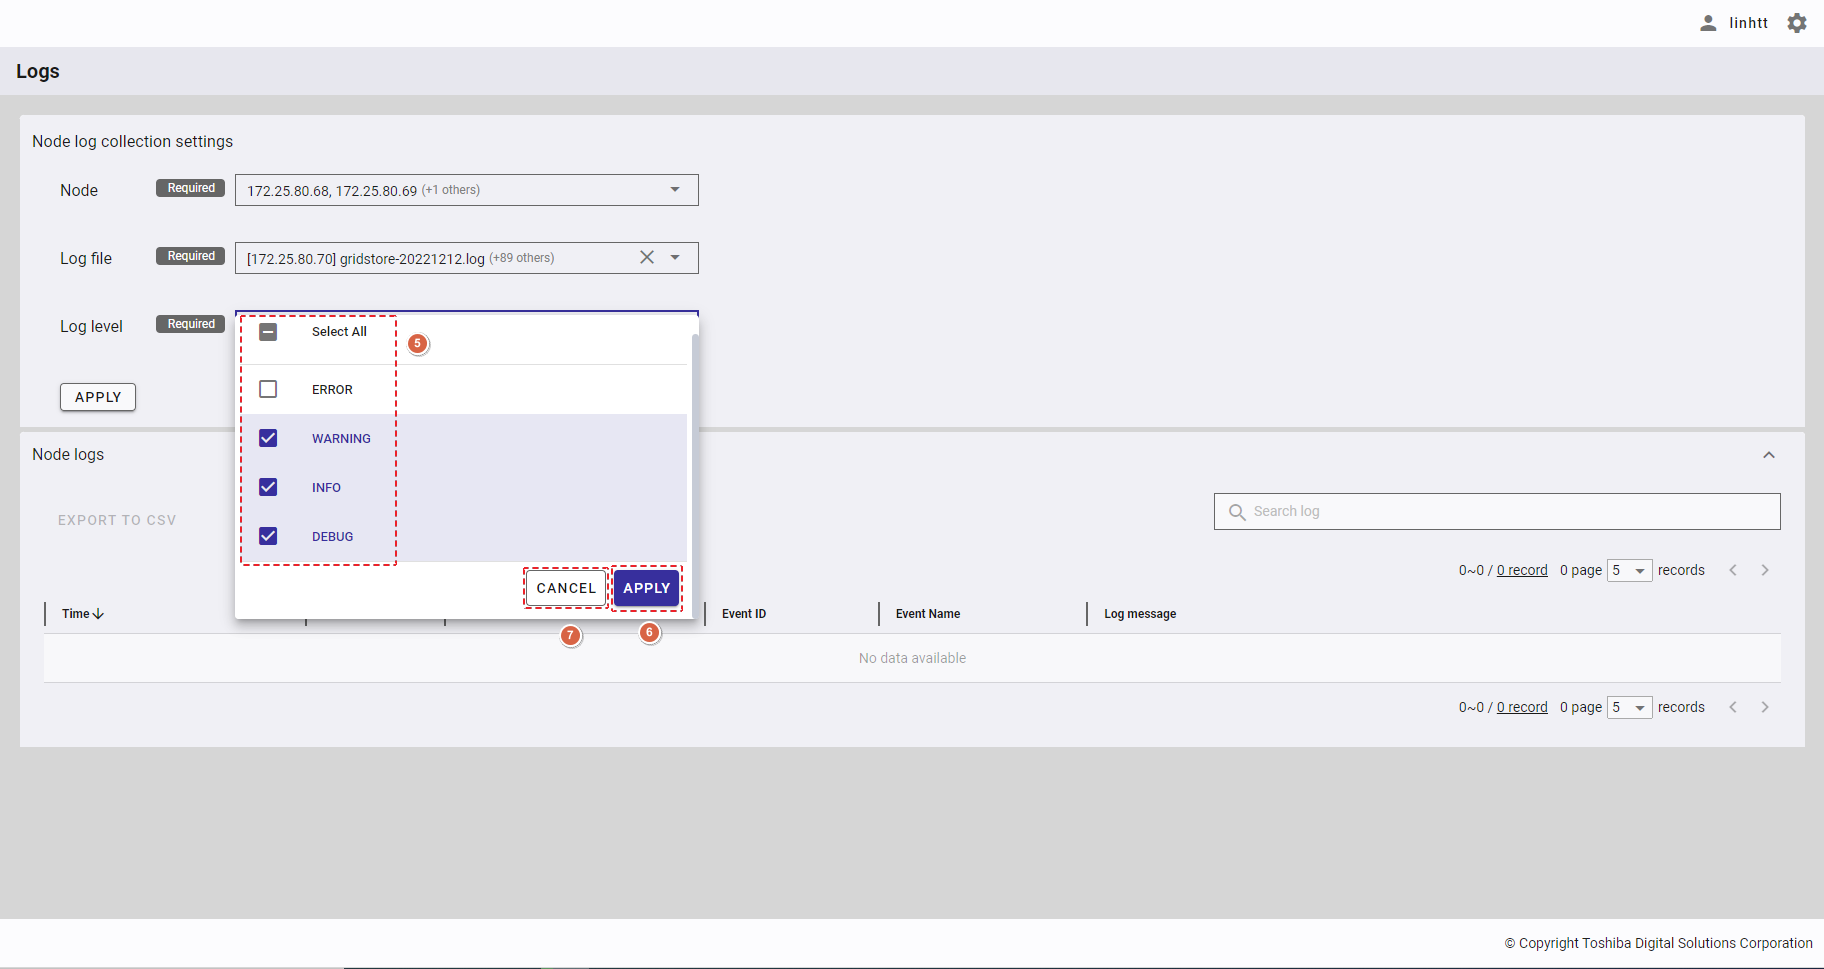
Step 4: Then, click the [APPLY] button to display logs.
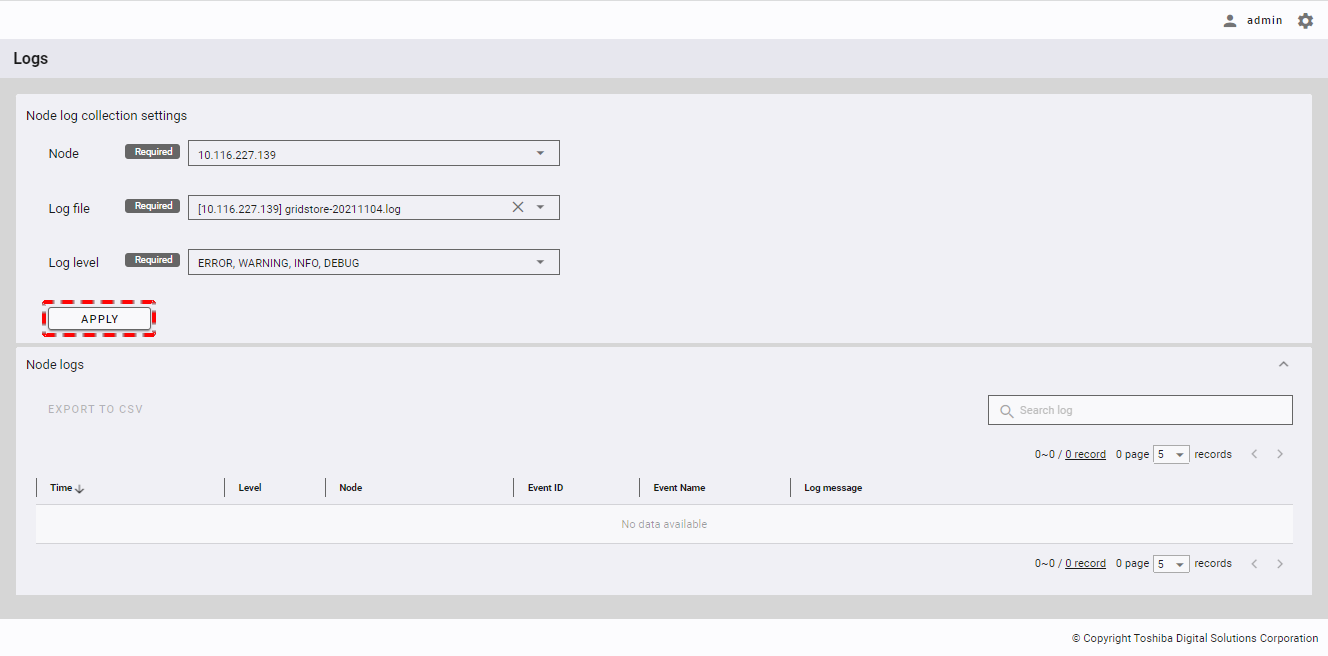
Step 5: Once the [APPLY] button is clicked, a confirmation dialog will be displayed. Click the [YES] button to continue displaying logs. If you do not want to continue, you can click the [NO] button to close the confirmation dialog and return to node logs screen.
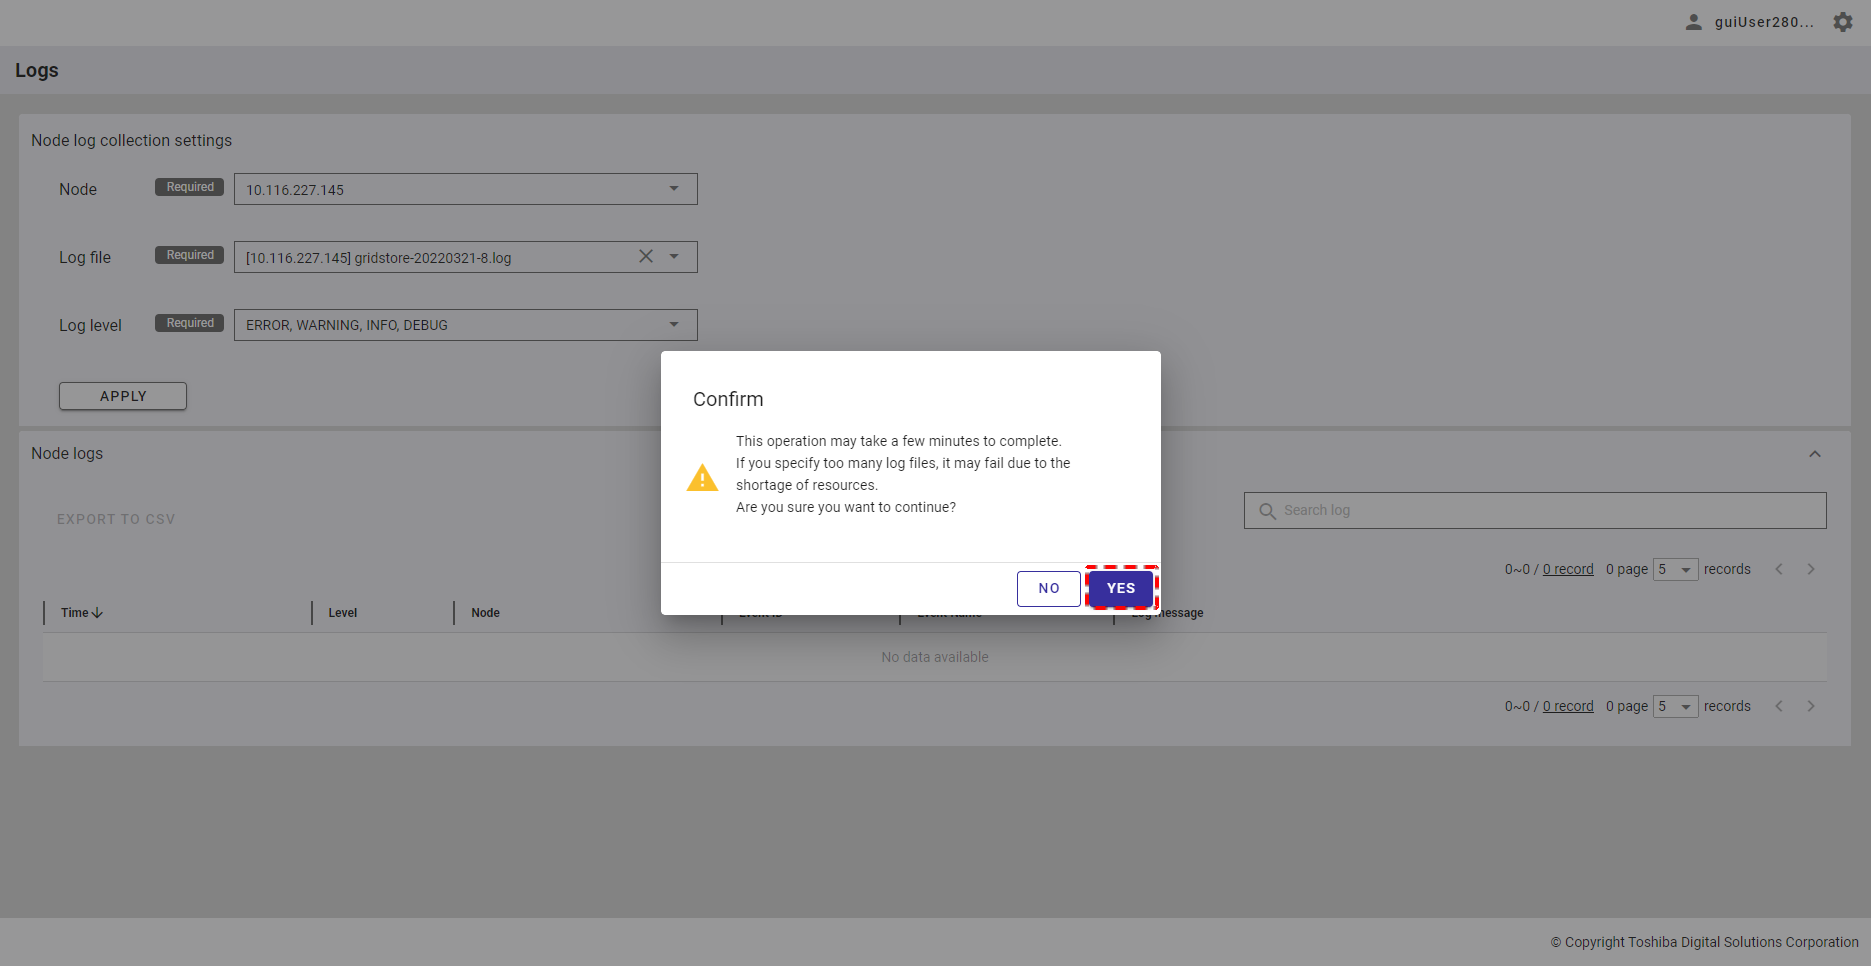
- You can choose the number of logs displayed on one page by selecting the number from [5, 10, 15, All] (②) at the top or bottom of the page. Click the [Next] button (④) or the [Back] button (③), or click the page number (⑥) to view another page.
- To search for a specific log, you can type the time, level, node, event ID, event name, or message of log in the search bar (①).
- You can sort the list of logs by time, by level, by node, by event ID, by event name, or by log message, by clicking the header (⑤) of each column.
- You can adjust the column size by dragging and dropping the vertical bar "|" on the header.
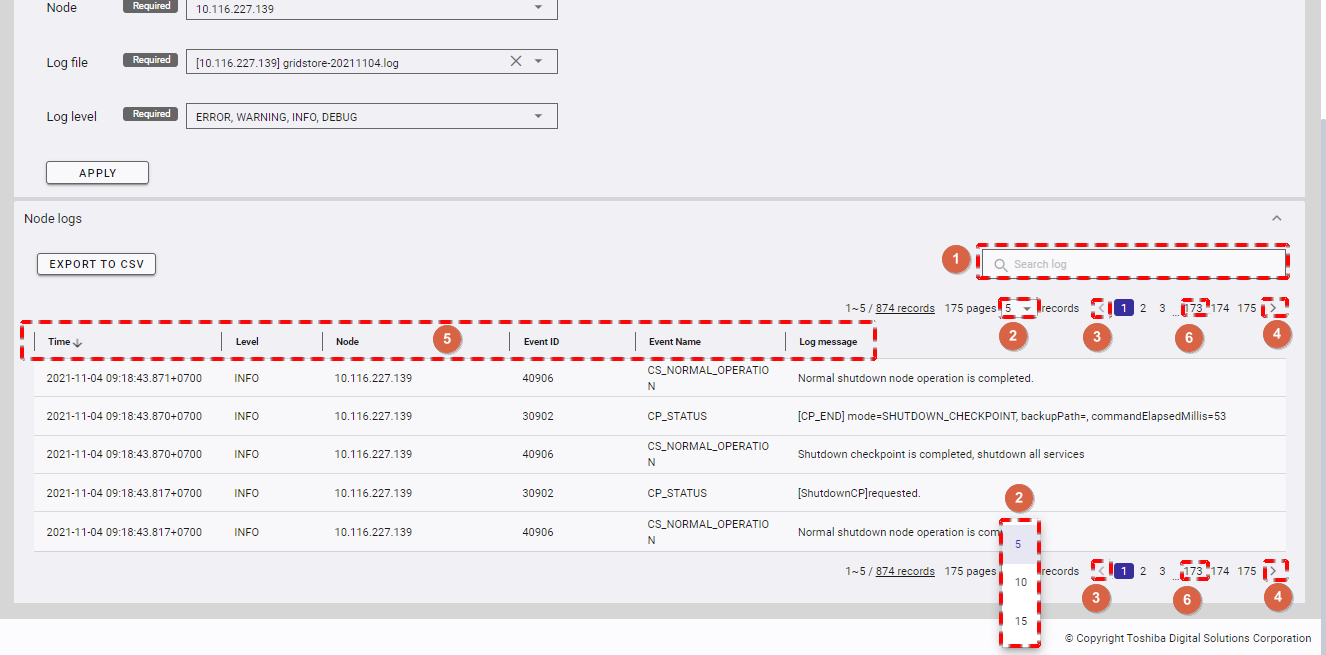
4.17.3 Exporting data to a CSV file
Step 1: To export data to a CSV file, click the [EXPORT TO CSV] button.
[Note]: The [EXPORT TO CSV] button is deactivated when the logs above contain no data.
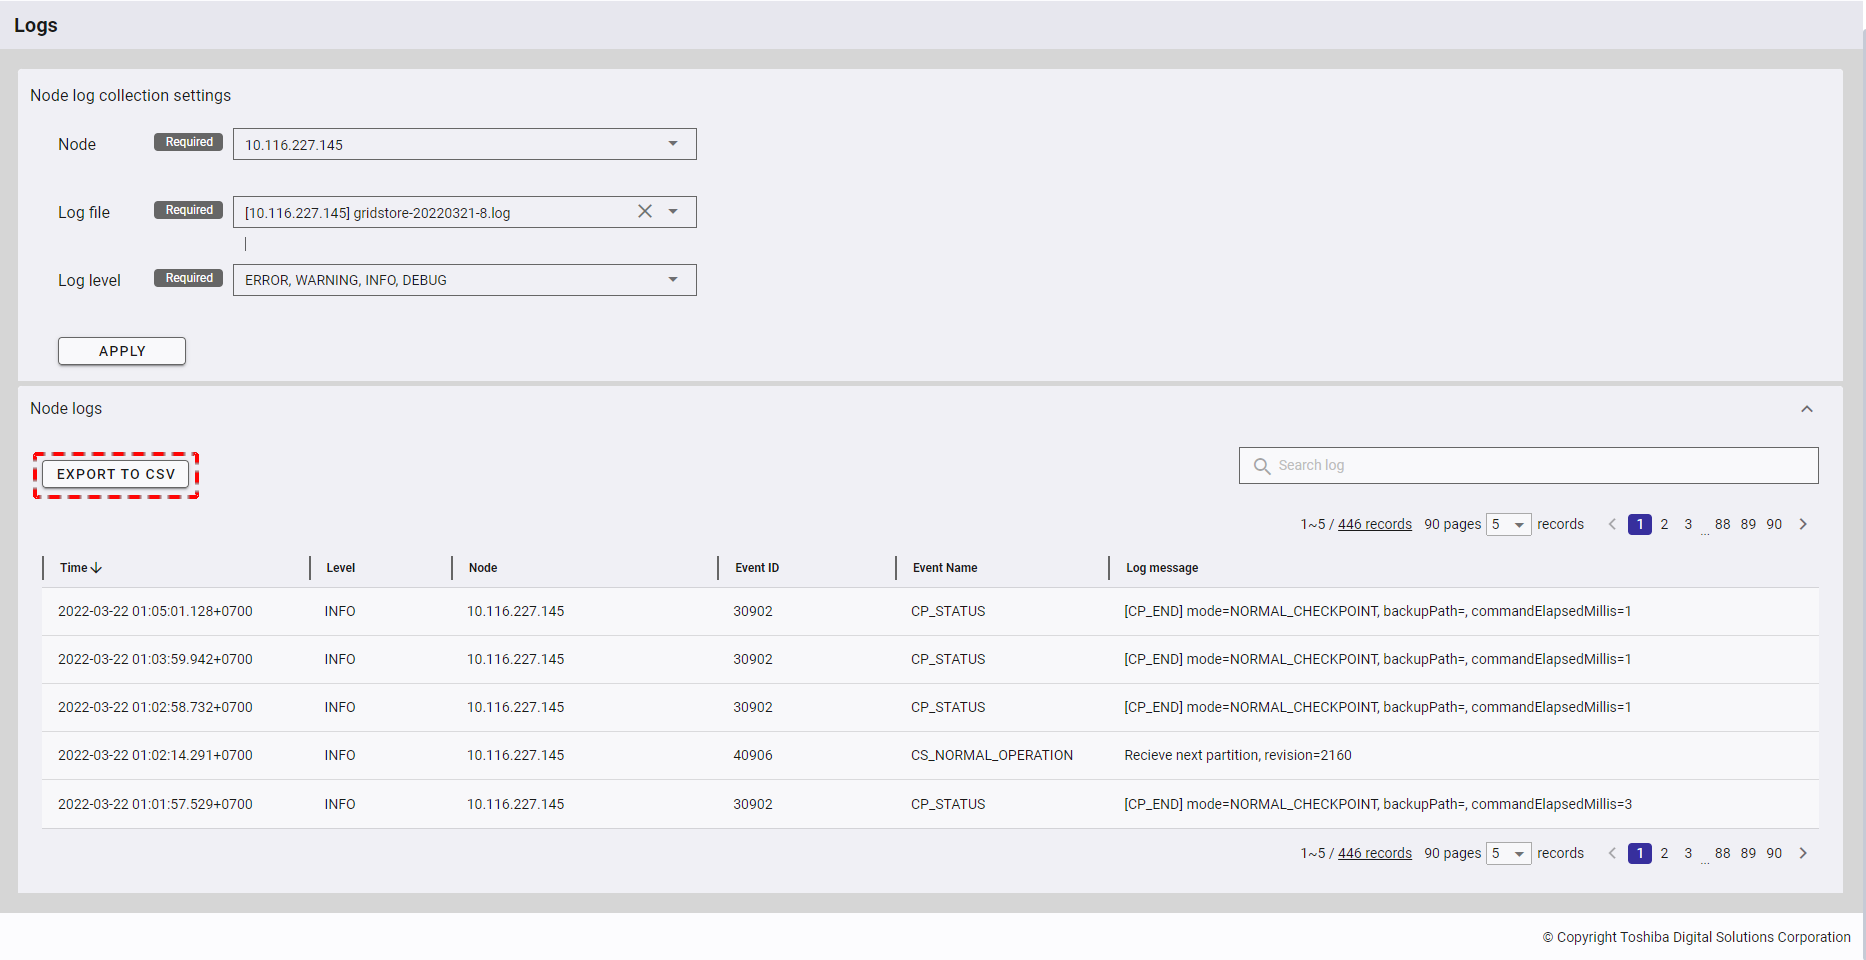
Step 2: Once the [EXPORT TO CSV] button is clicked, a confirmation dialog will be displayed. Click the [YES] button to export data to a CSV file. If you do not want to export data to a CSV file, you can click the [NO] button to close the confirmation dialog and return to the Node Logs screen without exporting data to a CSV file.
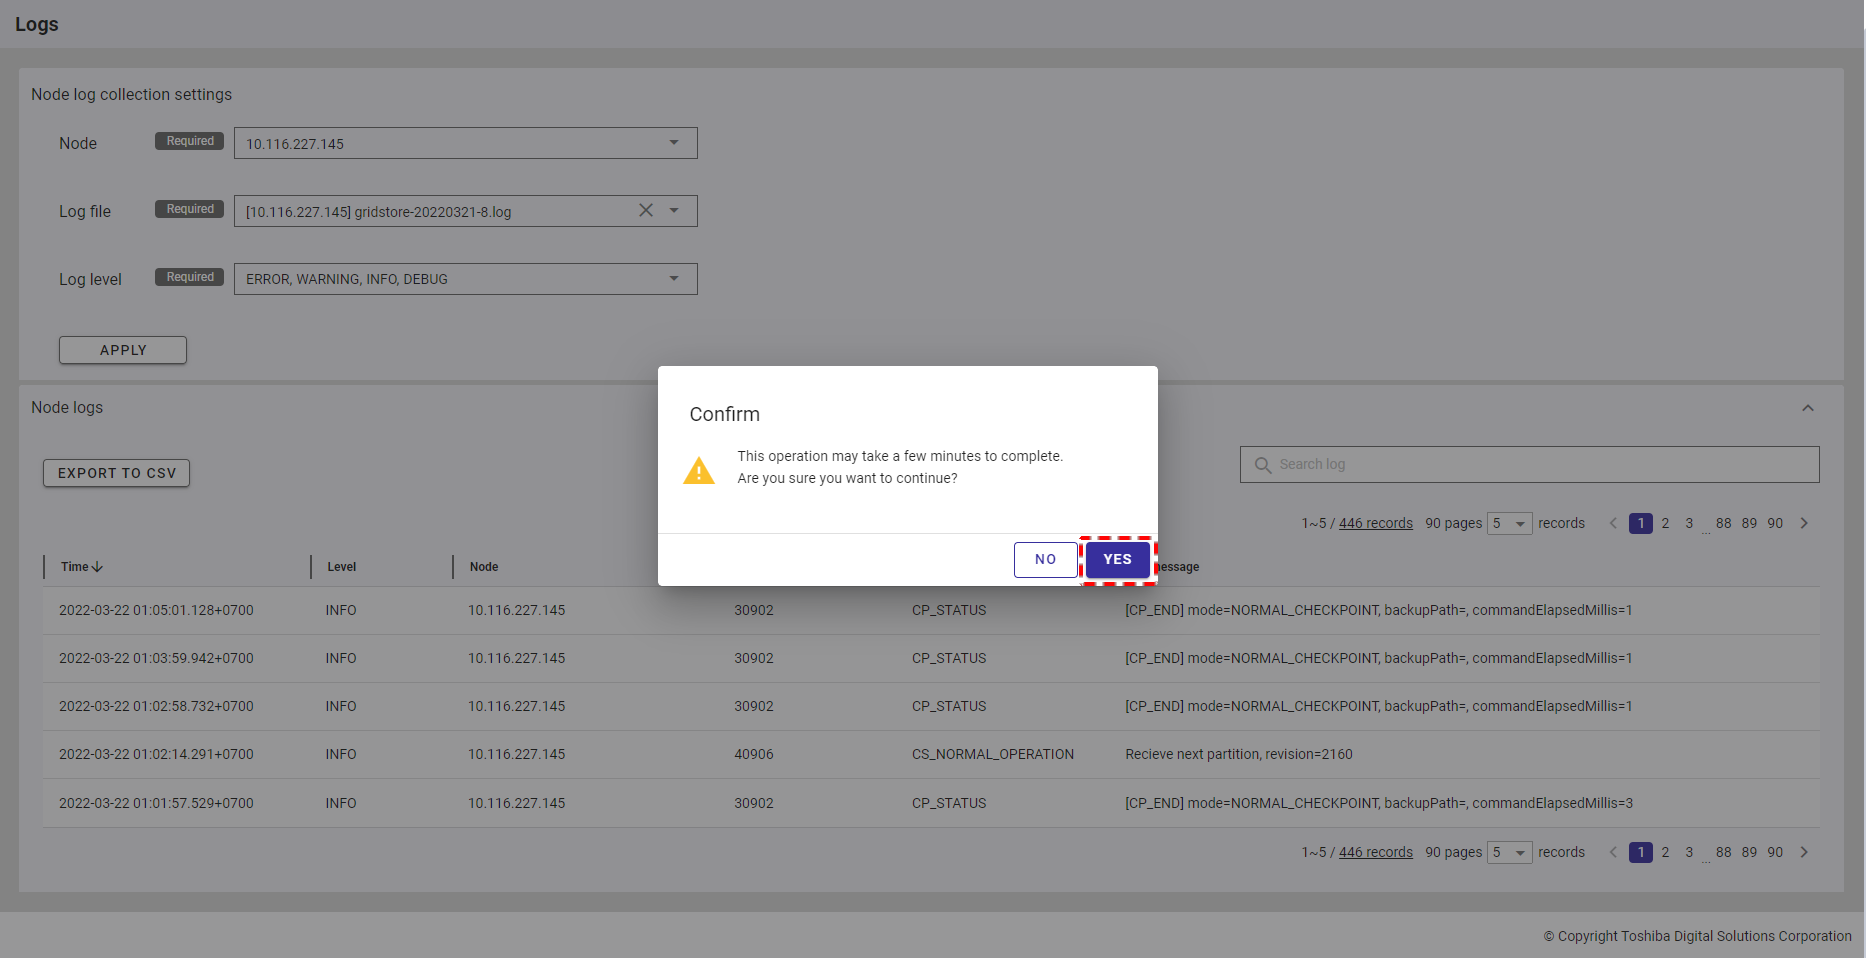
The exported data will be downloaded directly by your browser as a CSV file.
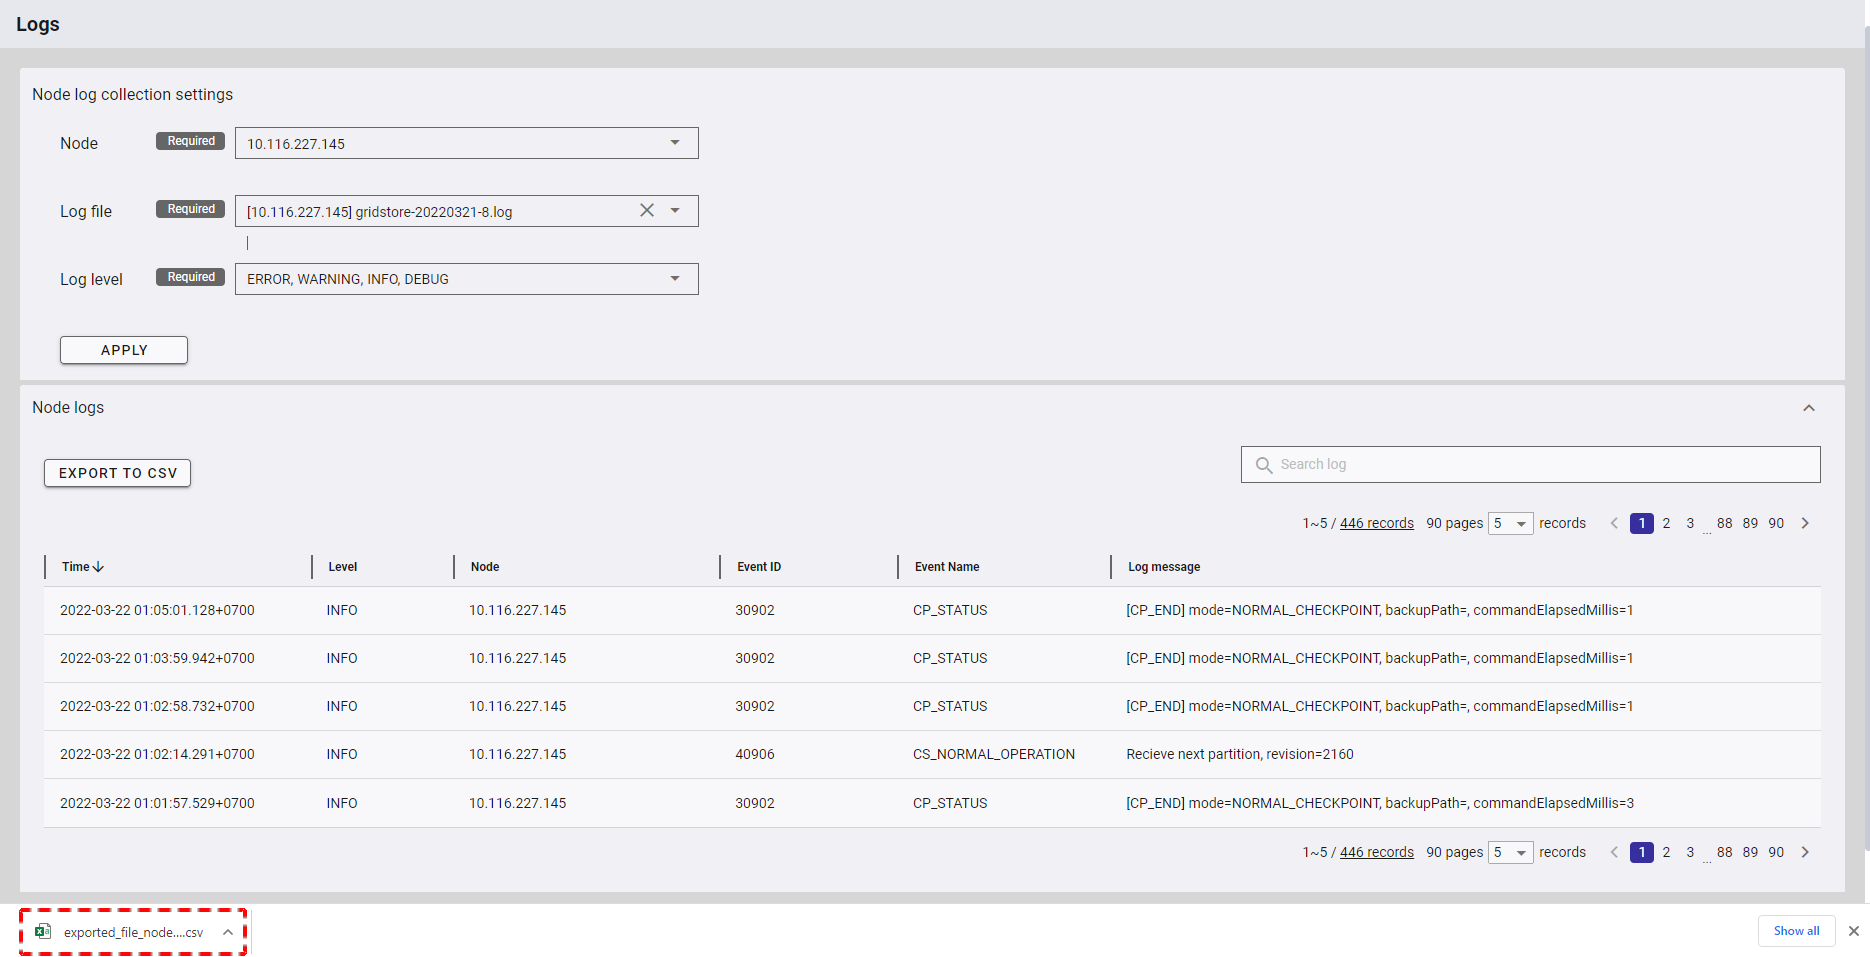
4.18 Peering connection function
This function is used for operating a peering connection between GridDB Cloud VNet (Virtual Network) and your VNet in Azure, such as creating and deleting a peering connection and viewing the peering connection list.
4.18.1 Available roles
In the table below, the role with a plus sign (+) can use the function on the left whereas the role with a minus sign (-) cannot use it.
| No. | Function | General user | Administrator user |
|---|---|---|---|
| 1 | Display a peering connection list | - | + |
| 2 | Create a peering connection | - | + |
| 3 | Delete a peering connection | - | + |
4.18.2 Displaying a peering connection list
To access the peering connection list screen, first you must log in to the system and then click the item [Network Access] in the left menu.
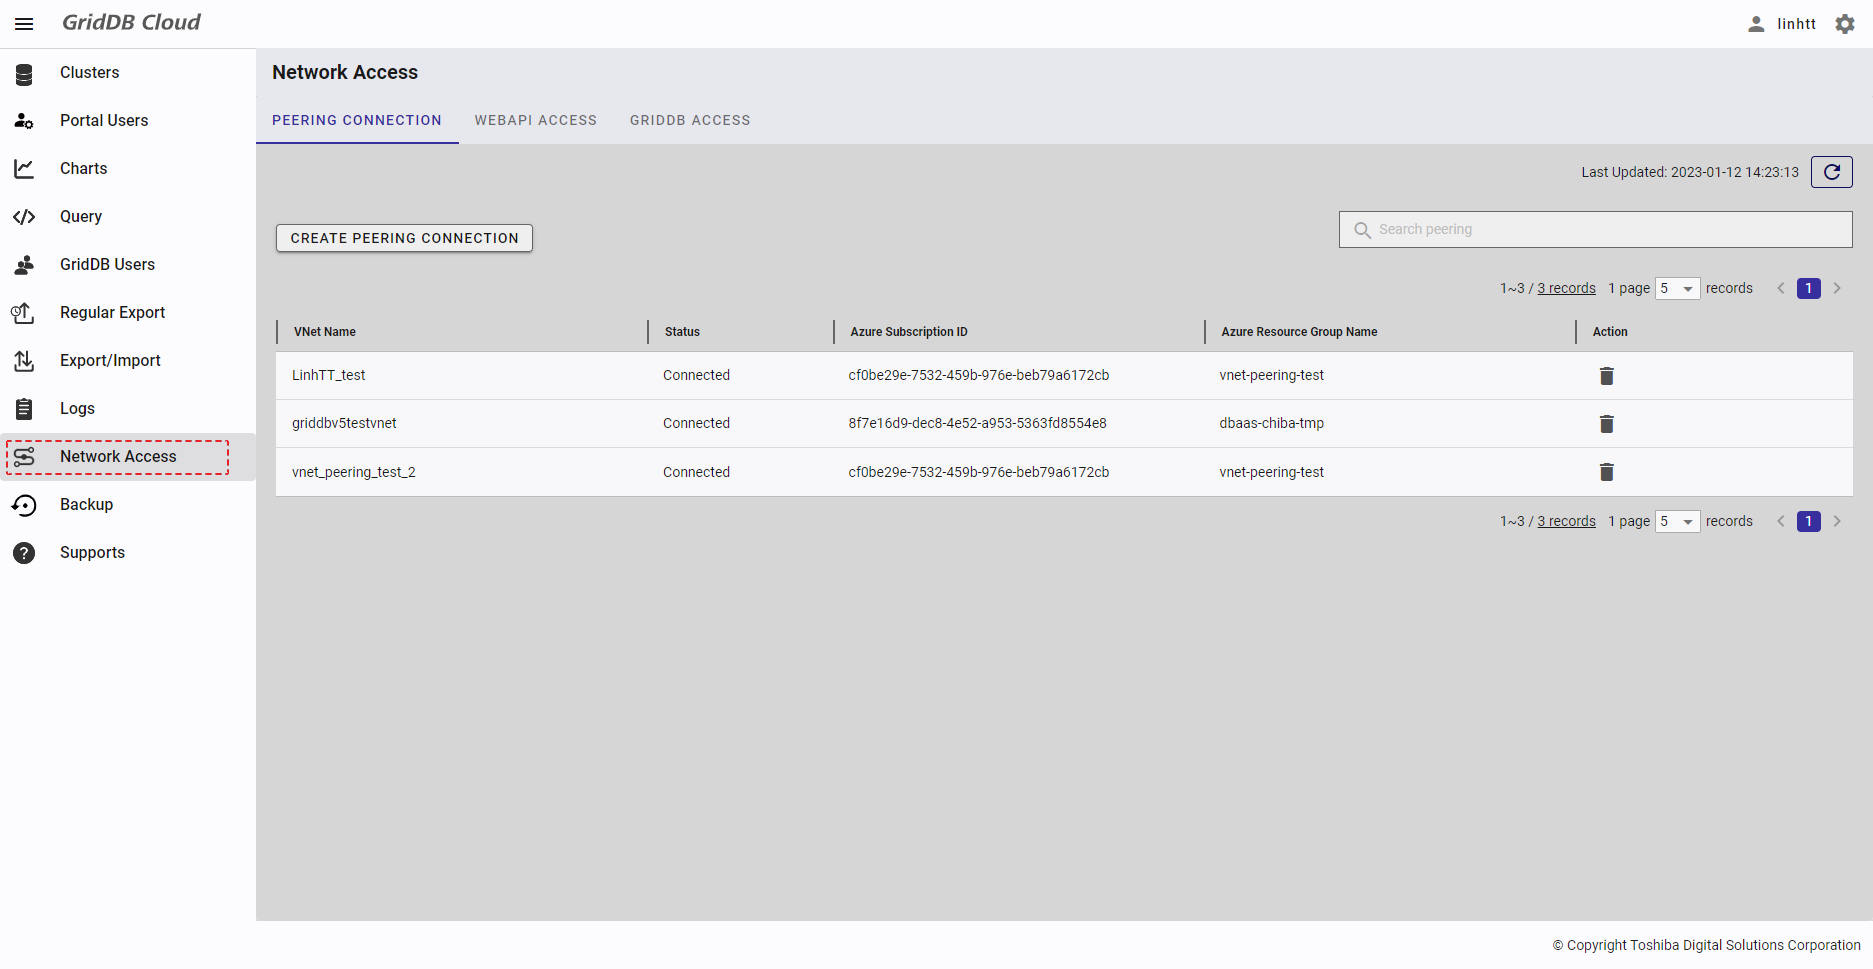
- You can click the [Refresh] button (①) to refresh the peering connection list and get the latest information about the list.
- To search for a specific peering connection, type the information about this connection in the search bar (②).
- You can choose the number of peering connections displayed on one page by selecting the number from [5, 10, 15, All] (④) at the top or bottom of the page. Click the [Next] button (⑥) or the [Back] button (⑤), or click the page number (⑦) to view another page.
- You can order the list of peering connections by VNet name, by status, by Azure subscription id, or by Azure resource group name, by clicking the header (③) of each column.
- You can adjust the column size by dragging and dropping the vertical bar "|" on the header.
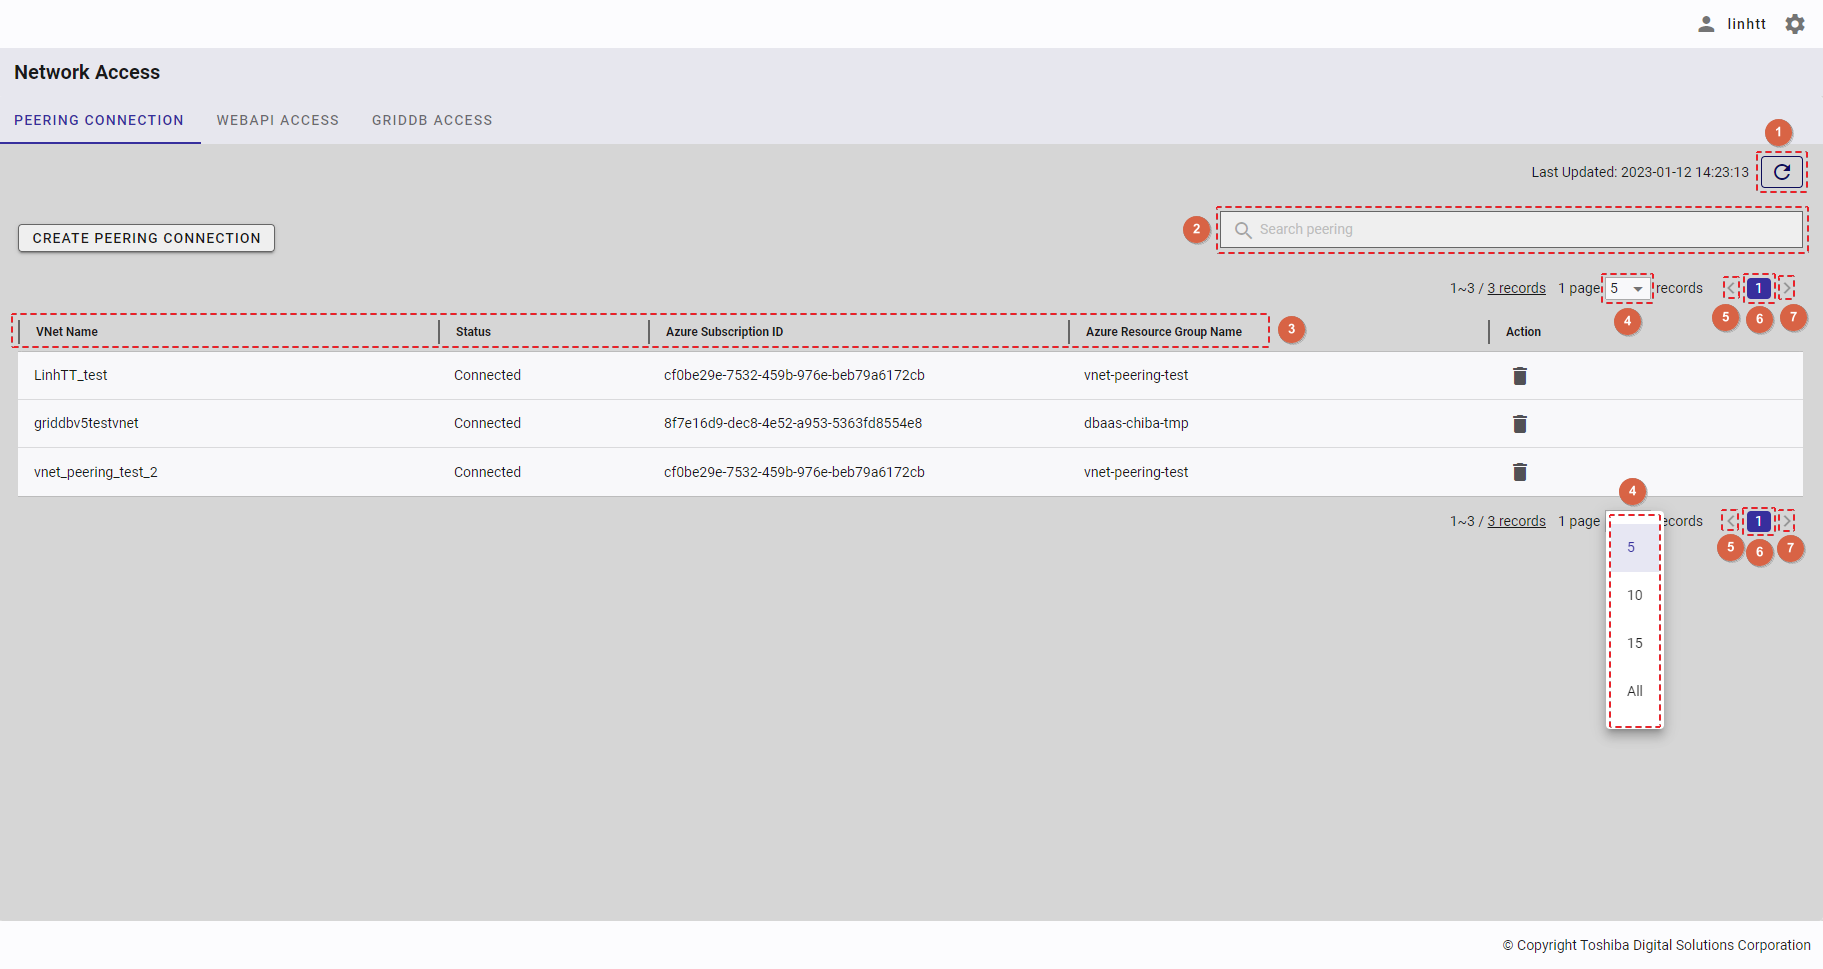
4.18.3 Creating a peering connection
Creation of a peering connection consists of three phases:
- Cloud Provider (Step 2)
- VNet Settings (Step 3)
- Grant Access (Steps 4-6)
Step 1: To create a peering connection, click the [CREATE PEERING CONNECTION] button.
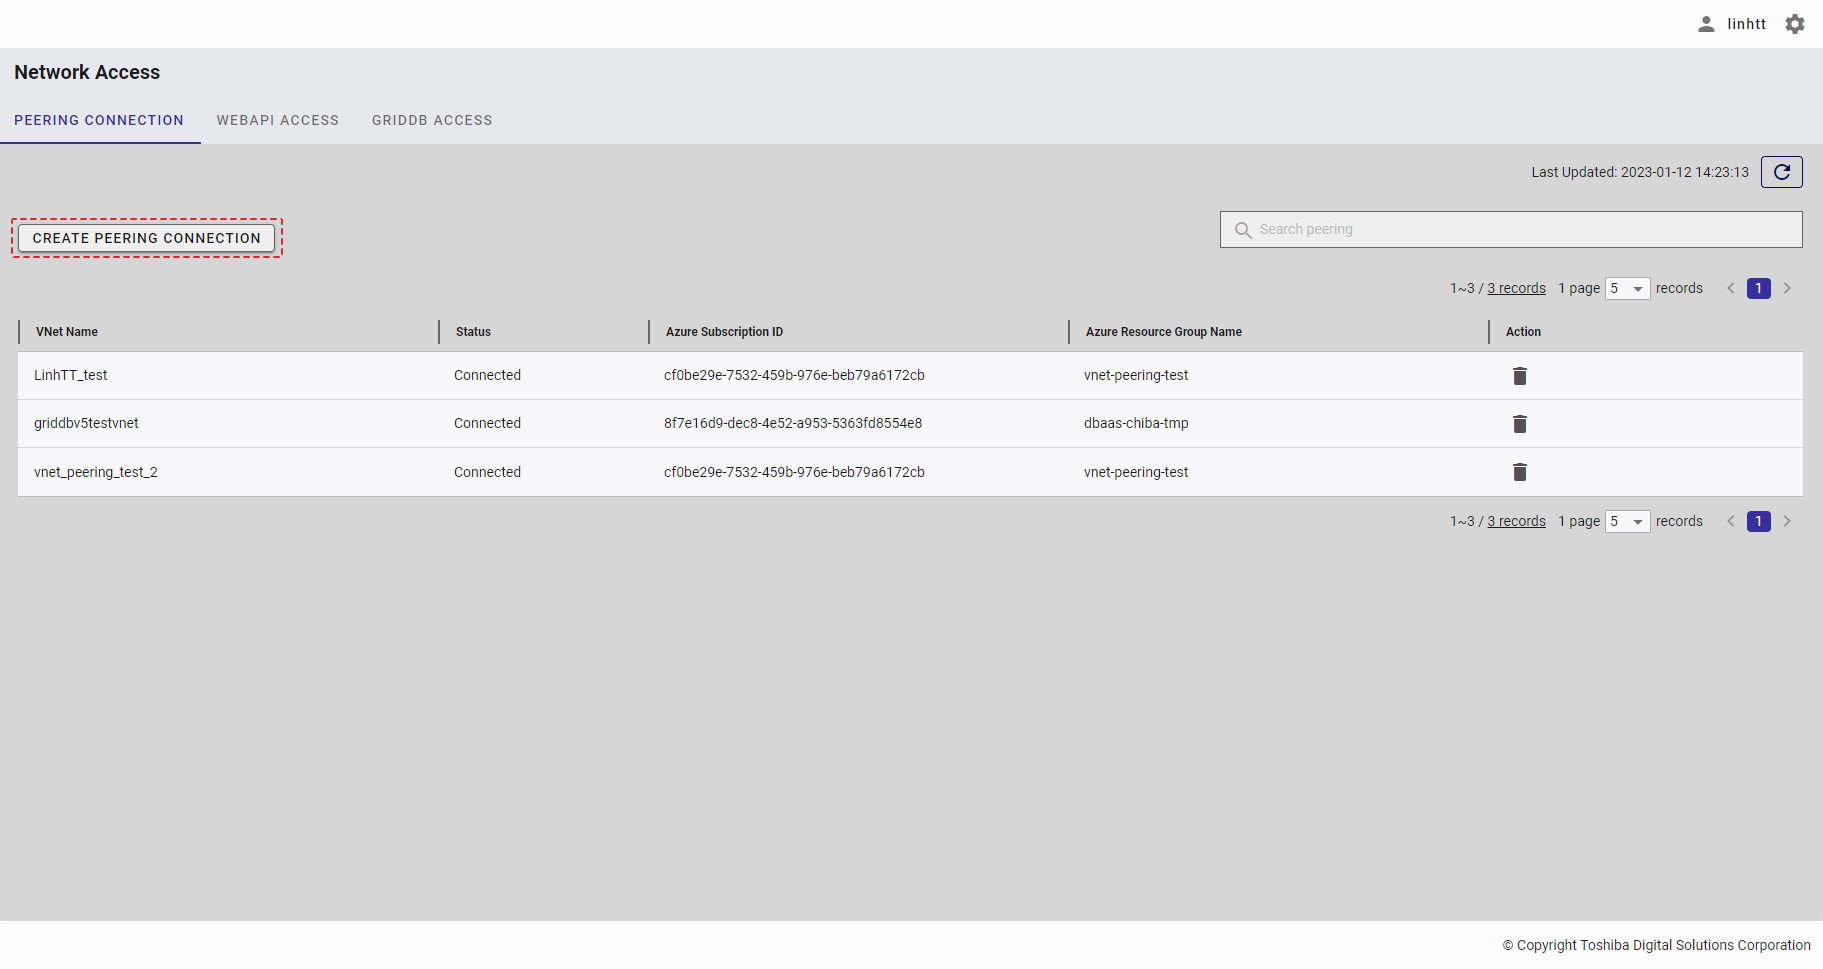
Step 2: When the Create peering connection dialog is displayed, choose the Cloud provider that you want (①). Then, click the [NEXT] button (②) to go to the next step. If you do not want to create a connection, click the [CANCEL] button to close the dialog.
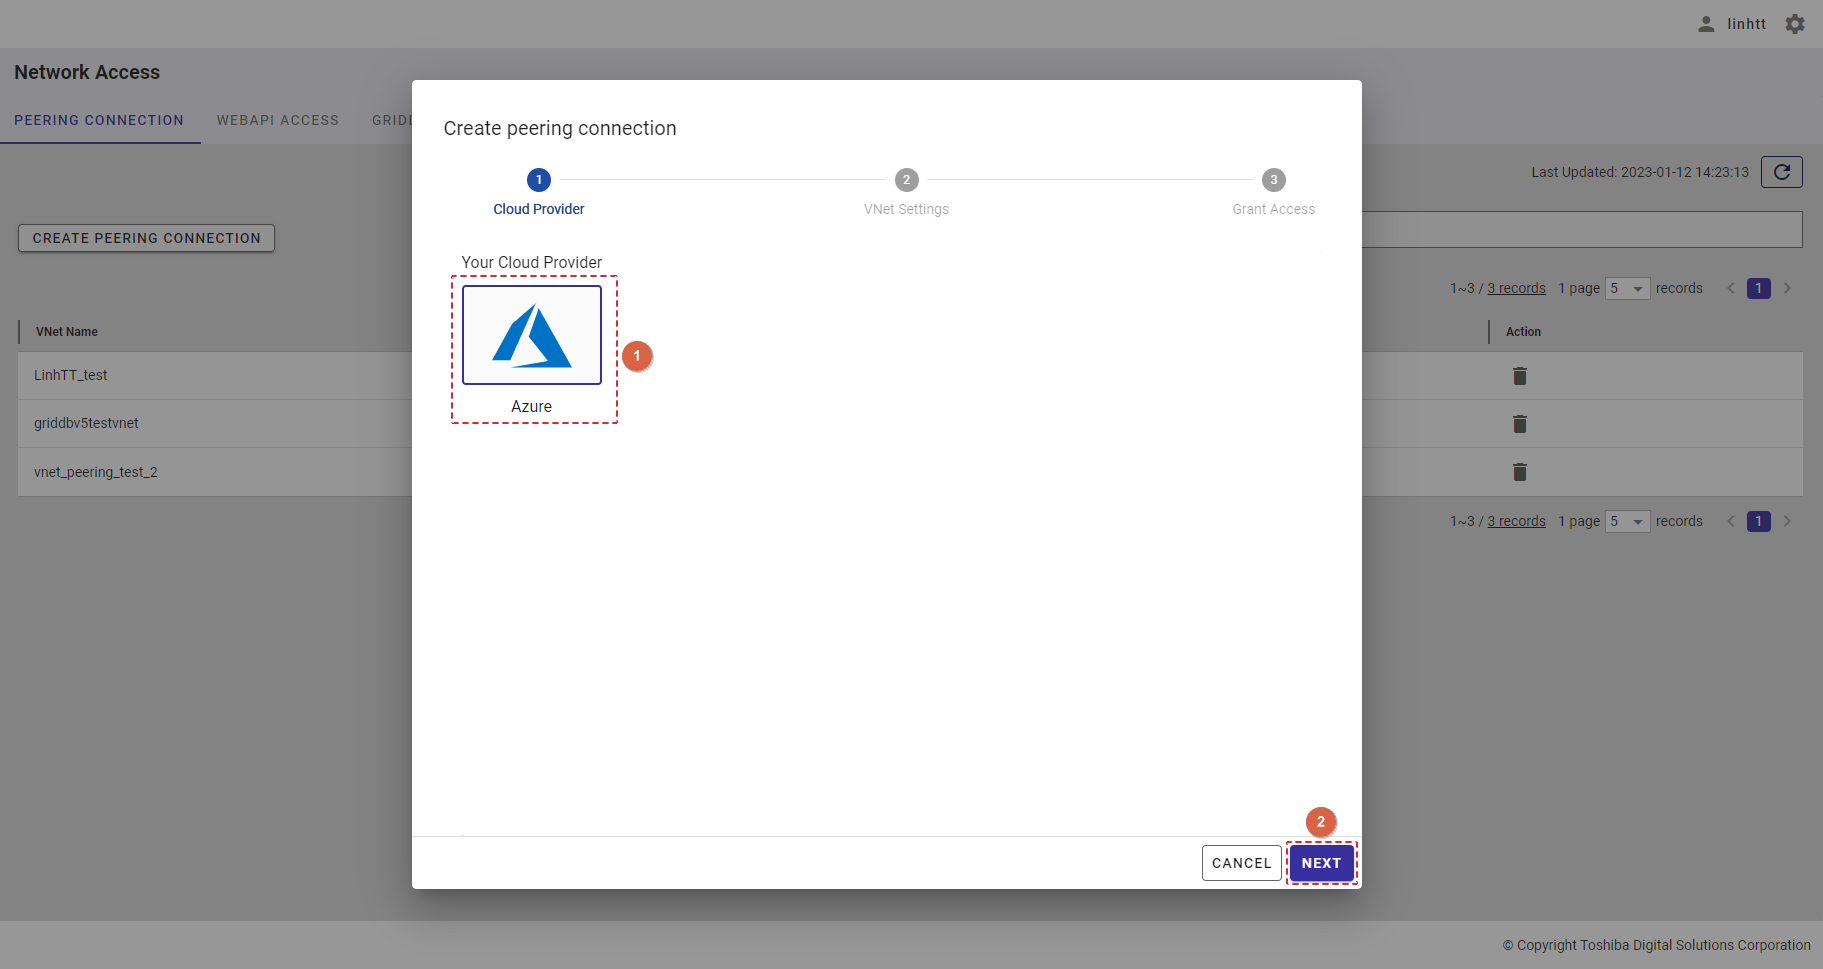
Step 3: Enter the following information:
- subscription ID: [Subscription ID] (①)
- directory/tenant ID: [Directory/Tenant ID] (②)
- resource group name: [Resource Group Name] (③)
- VNet name: [VNet Name] (④)
You can click the [Show Instructions] (⑤) to know how to get the relevant information for each item.
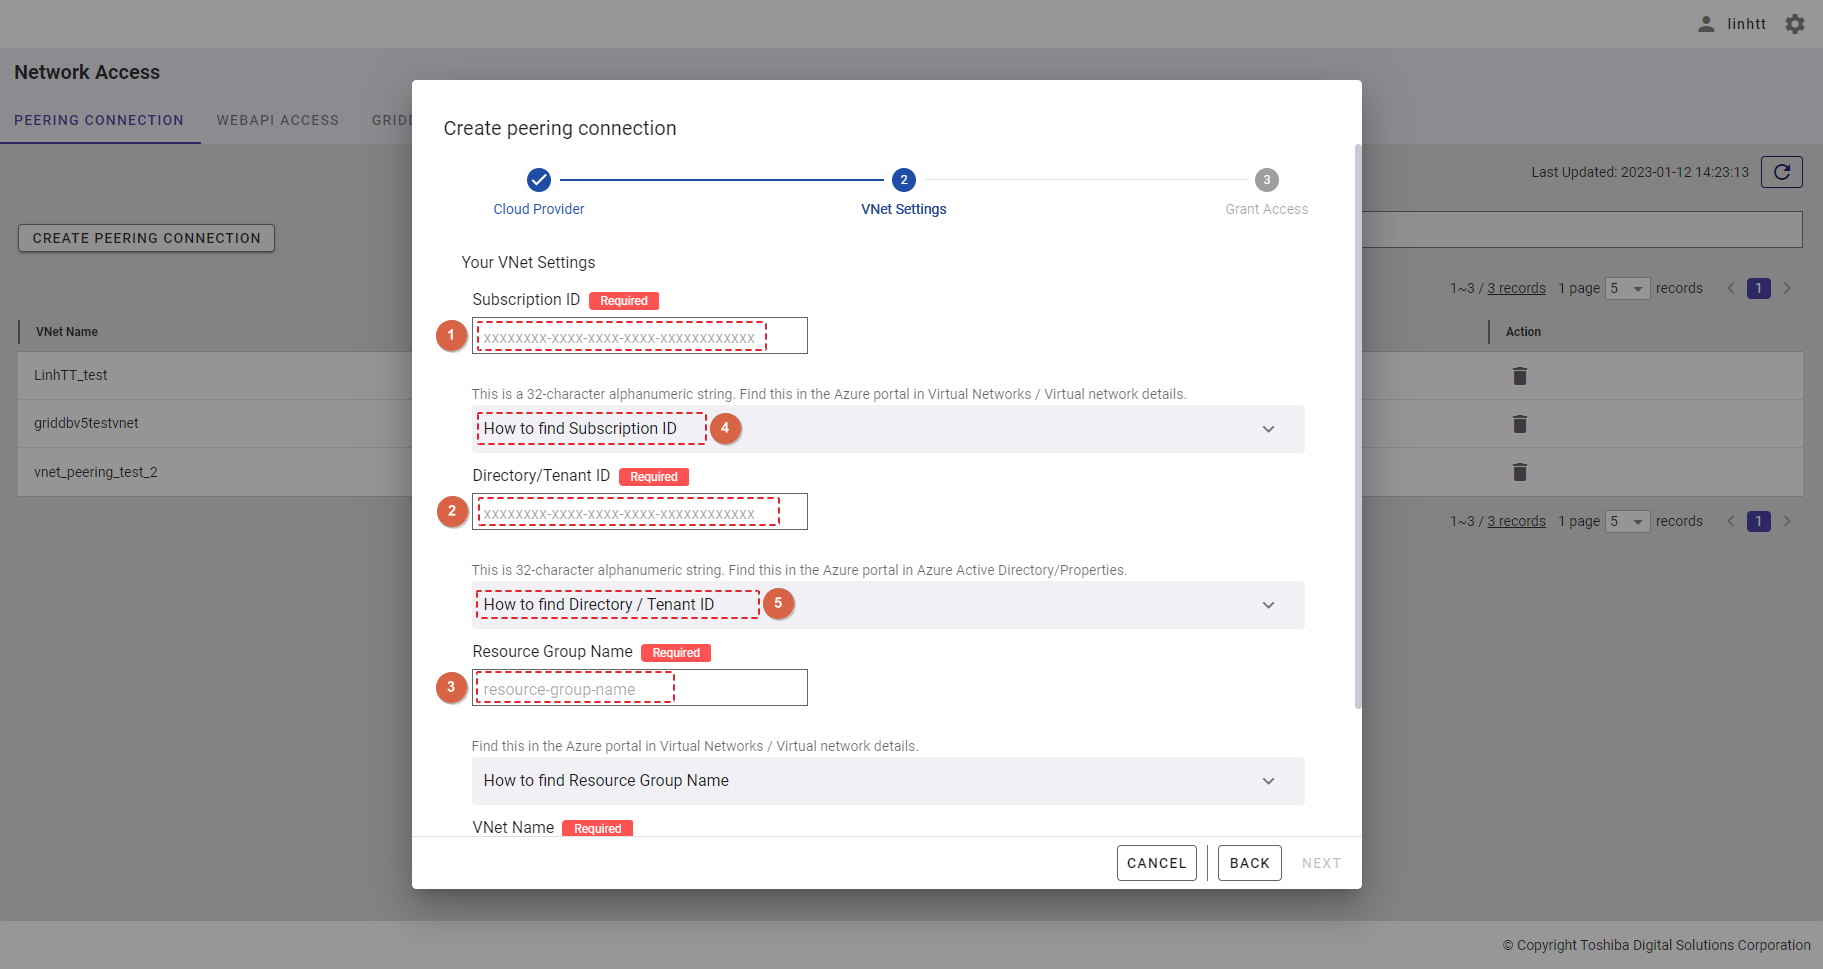
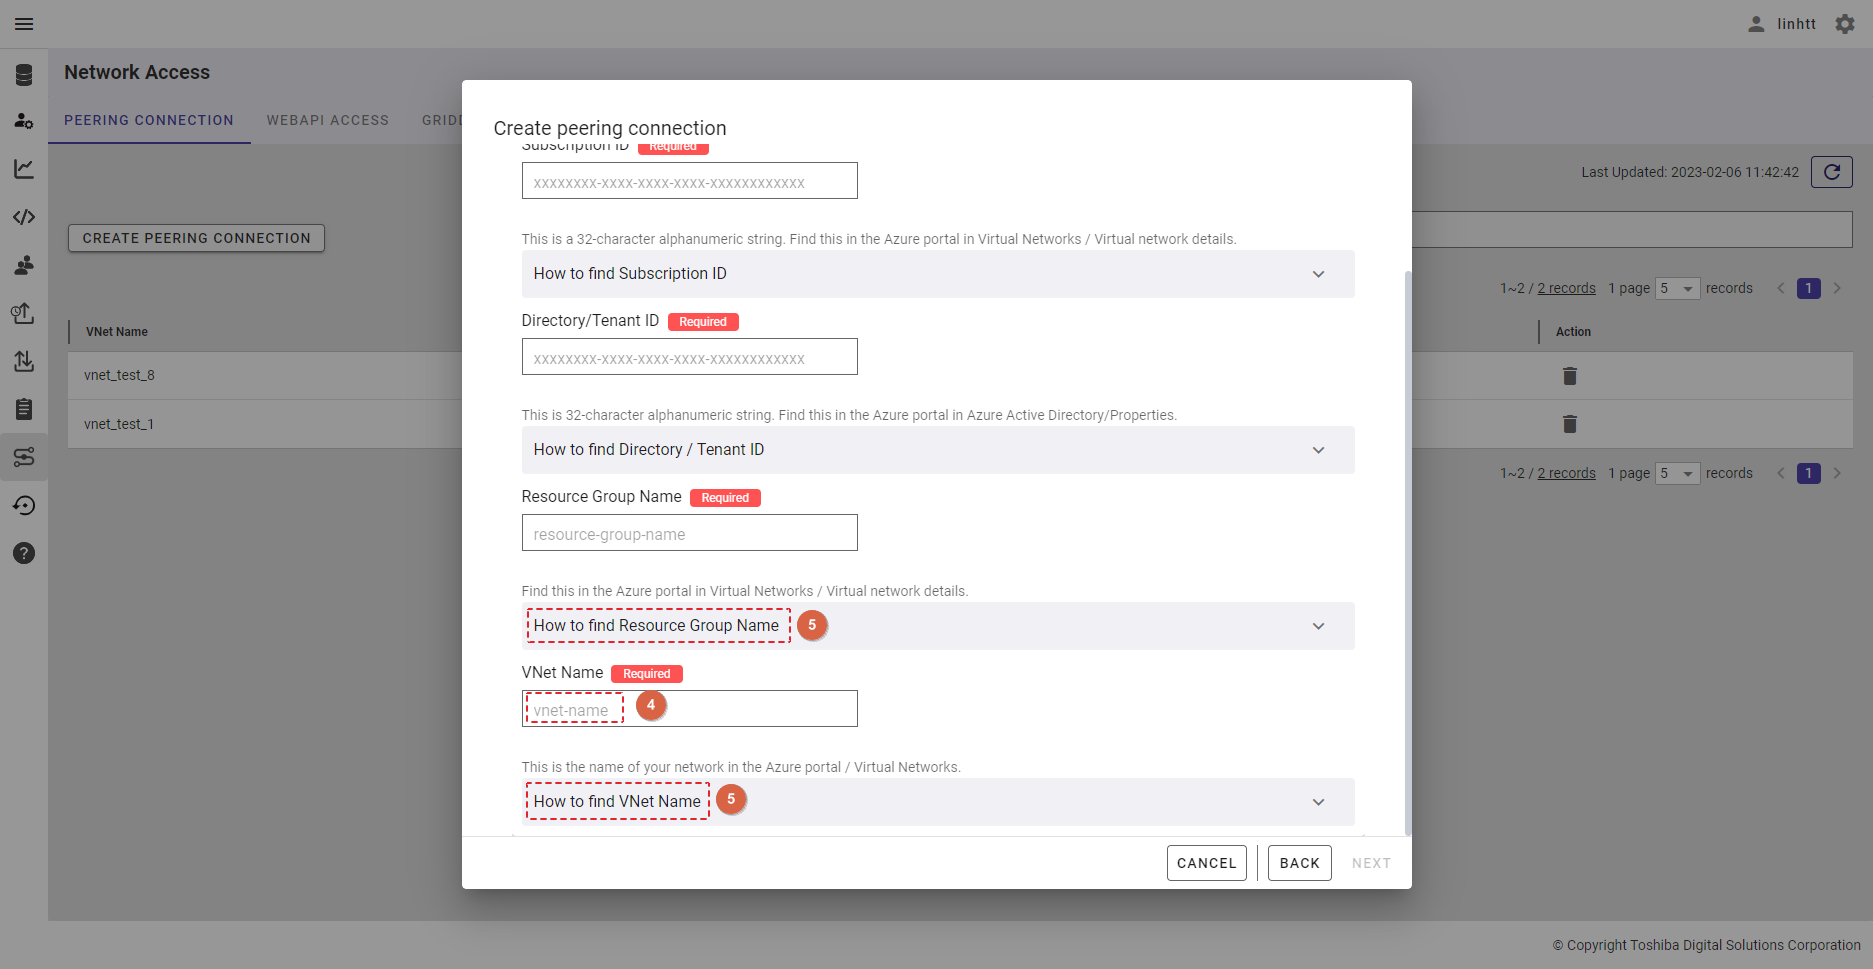
After entering your VNet settings, click the [NEXT] button (②) to go to Step 4 ("Grant Access" phase) If you want to change the Cloud provider, you can click the [BACK] button (①) to go back to Step 2 ("Cloud Provider" phase). To close the dialog without creating a peering connection, click the [CANCEL] button.
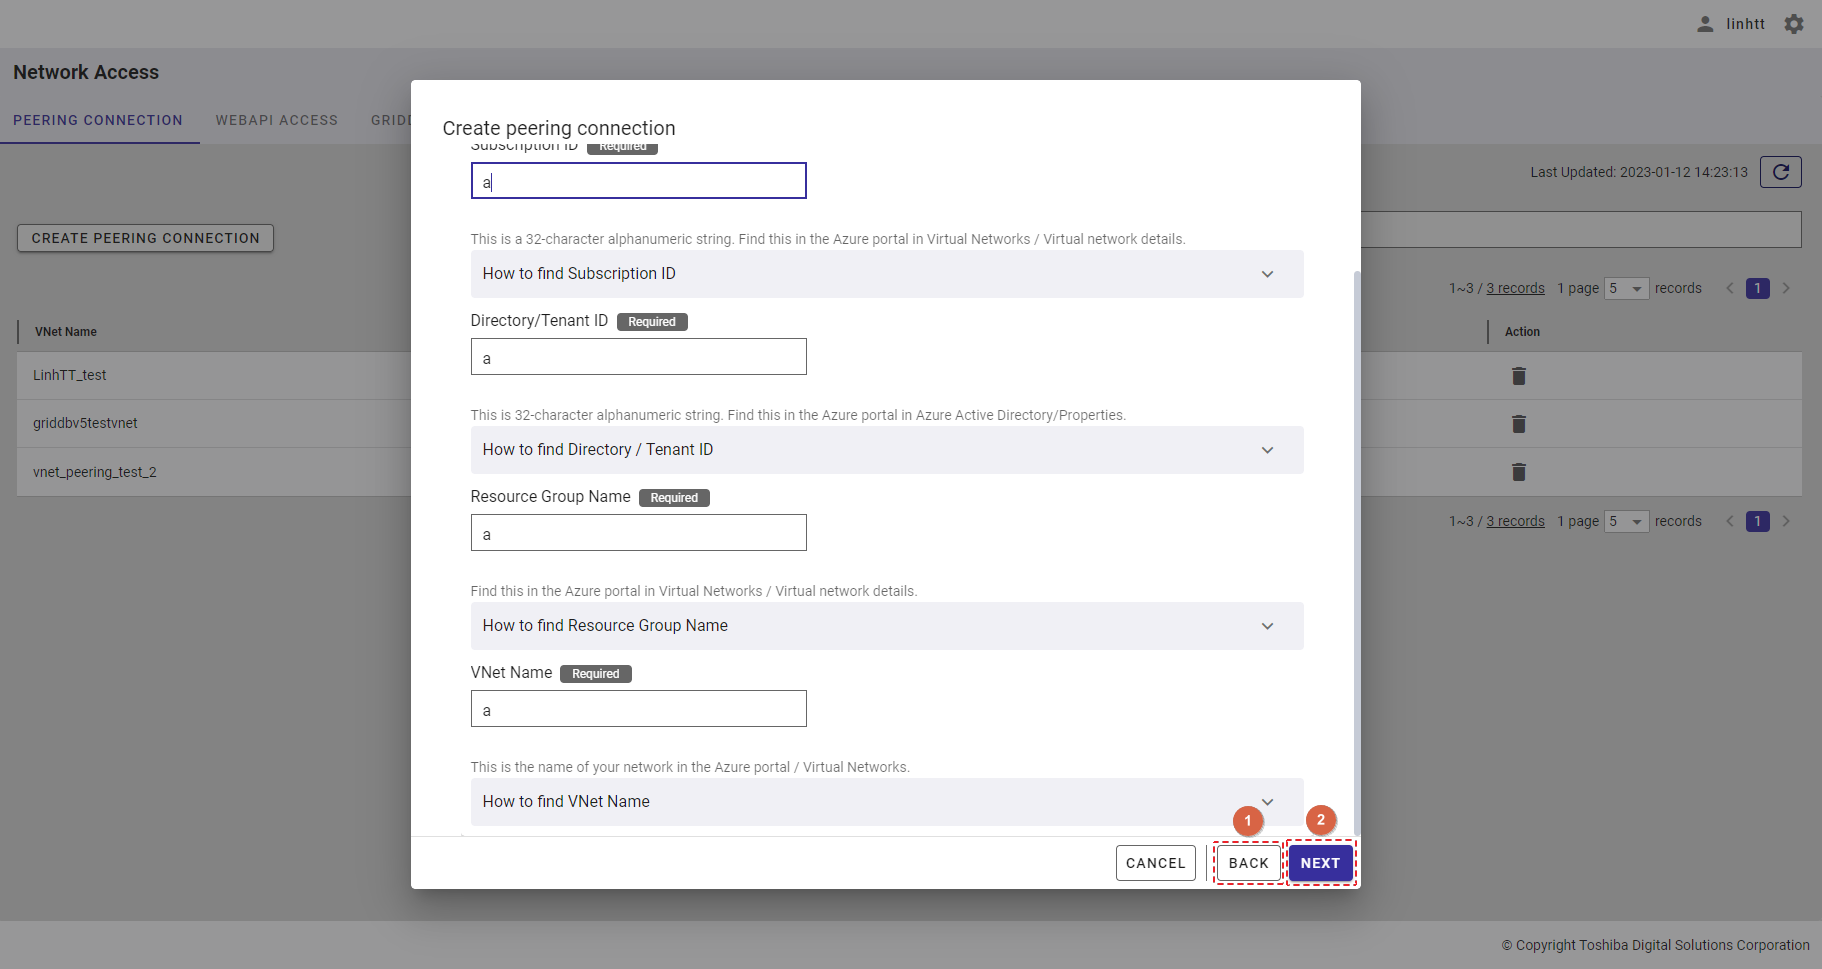
Step 4: In this step, you can click the [COPY] button (①, ②, ③, and ④) to copy the command on the left. You should run these commands in the right order before going to the next step.
You can hover the mouse pointer over the "information" icon (⑤) to show the tooltip.
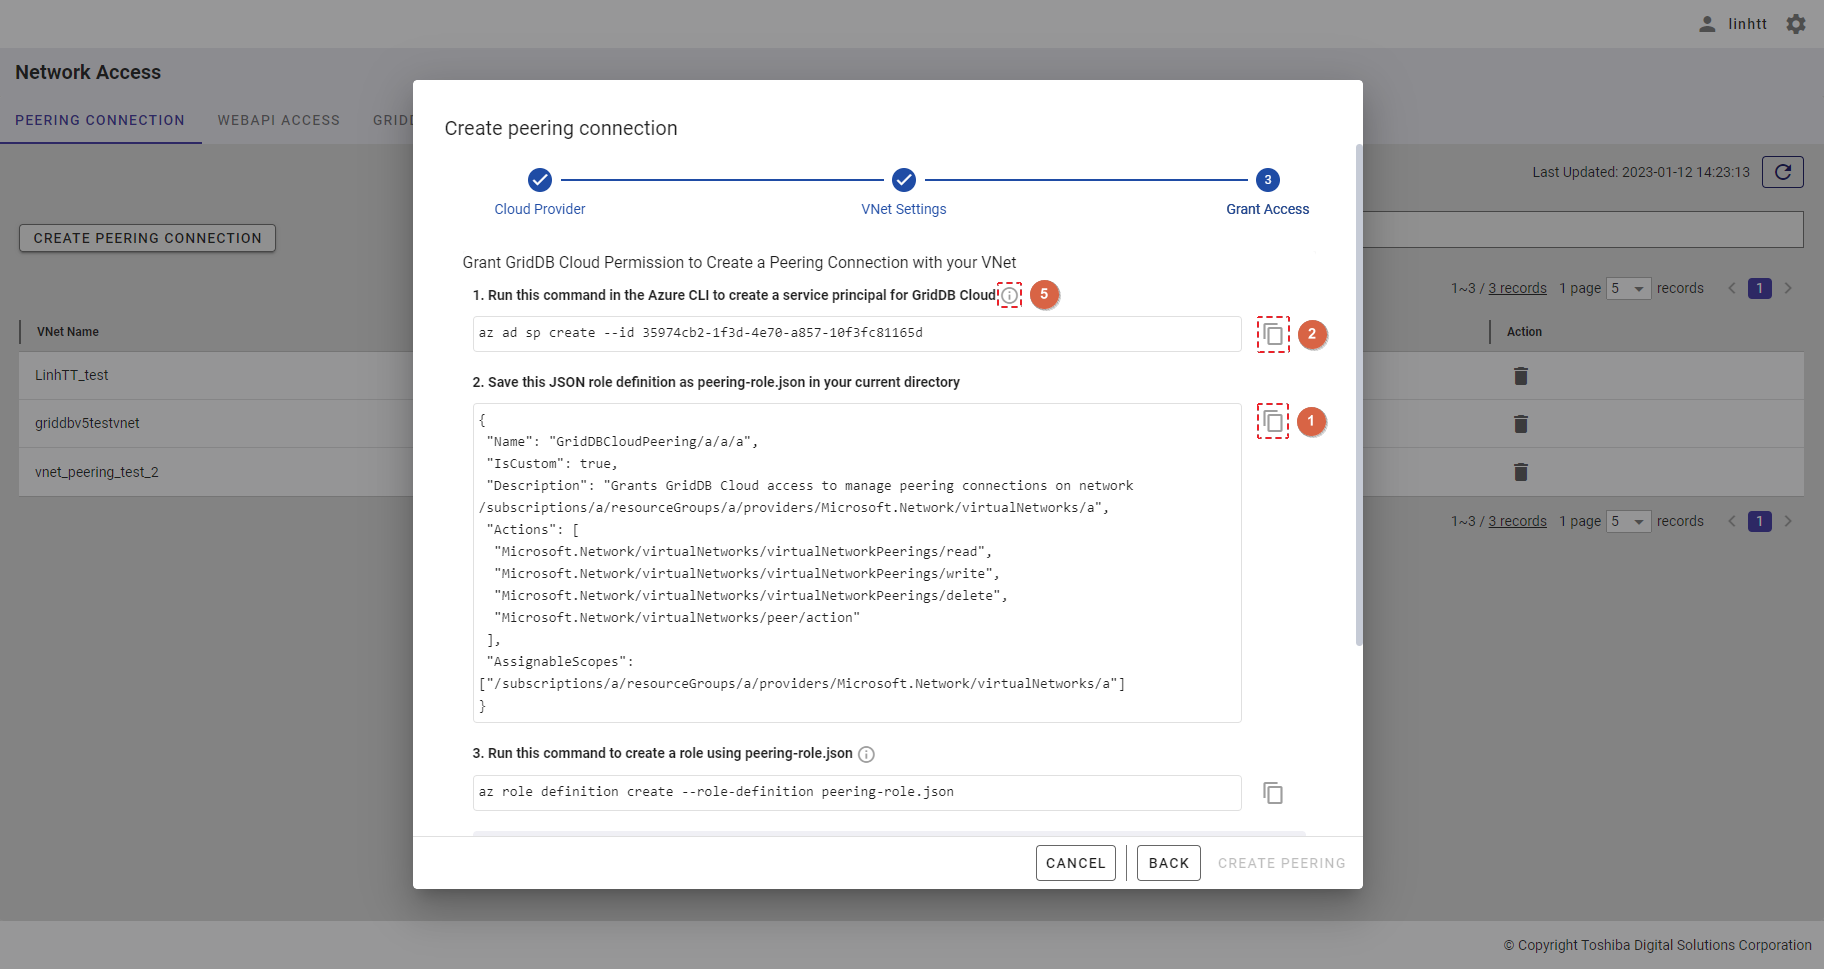
If an error occurs while running the third command, click the [If you face any error when creating a custom role] tab (⑥) to show/hide the instruction.
Step 5: Click the [VALIDATE] button (⑦) to confirm that the connection works.
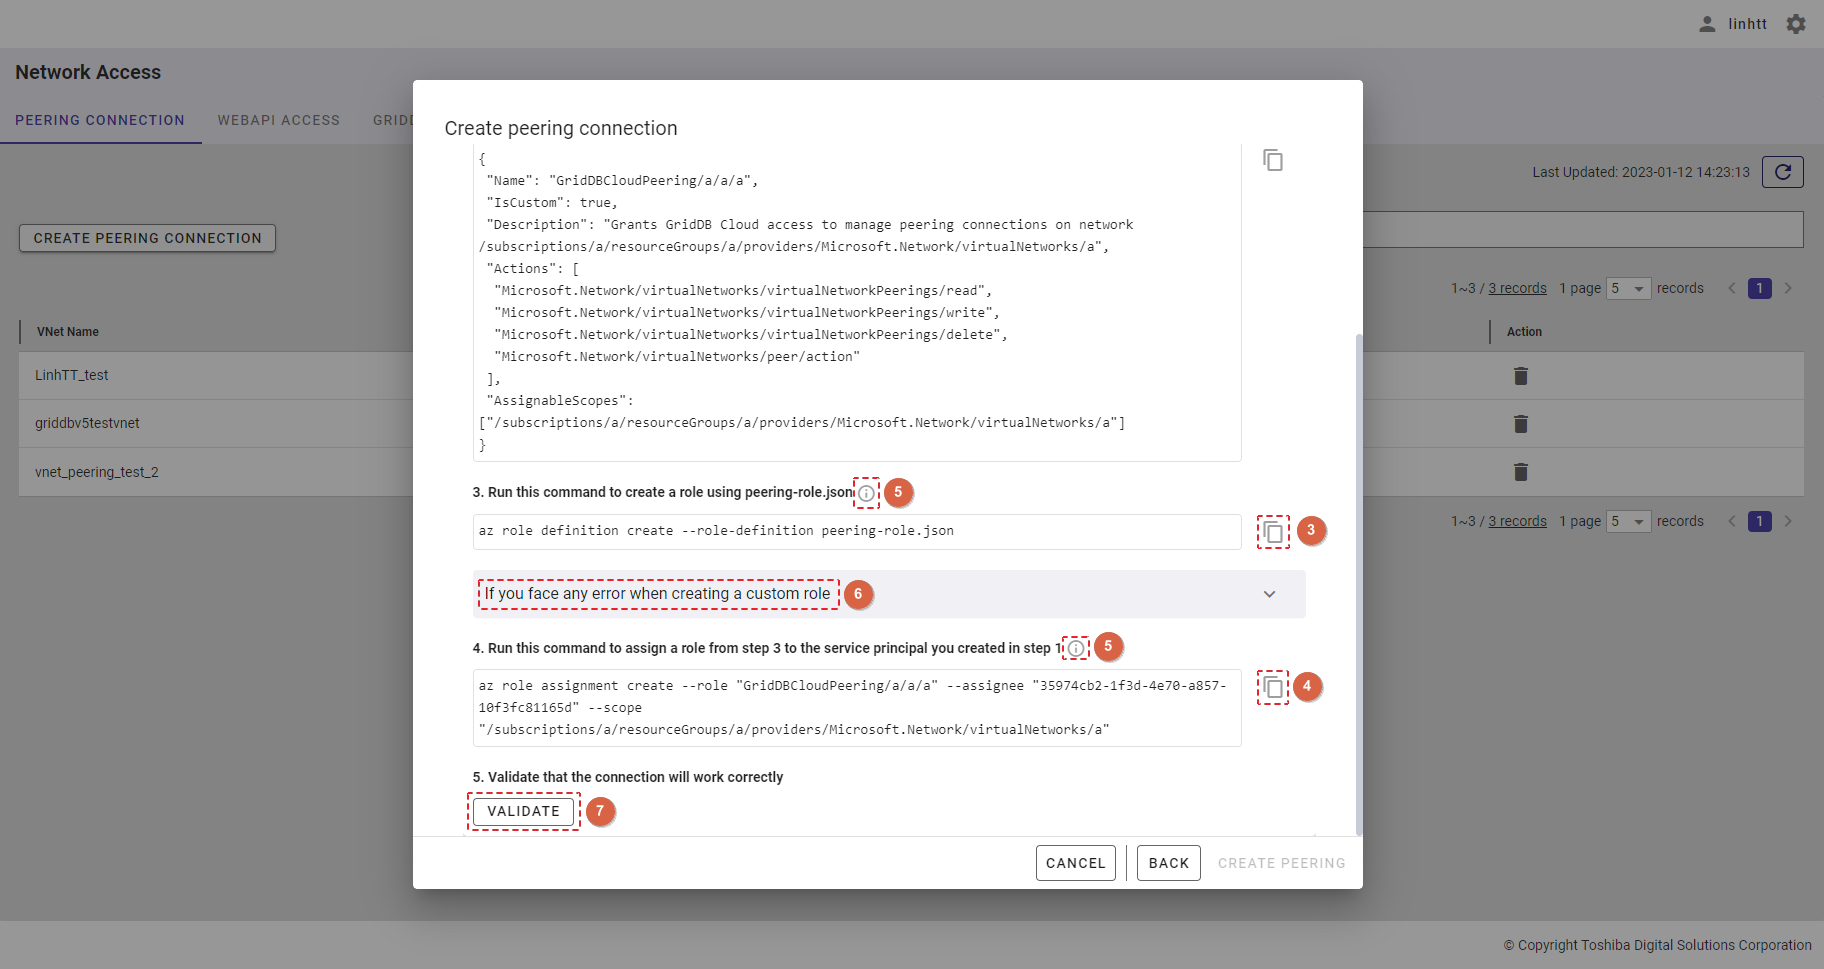
Step 6:
- If you validate the connection has succeeded, the [CREATE PEERING] button (②) will be enabled; click this button to finish creating the peering connection.
- If the validation fails, please check the previous steps. You can go back to Step 3 ("VNet Settings" phase) by clicking the [BACK] button (①).
- If you want to close the dialog without creating the connection, click the [CANCEL] button.
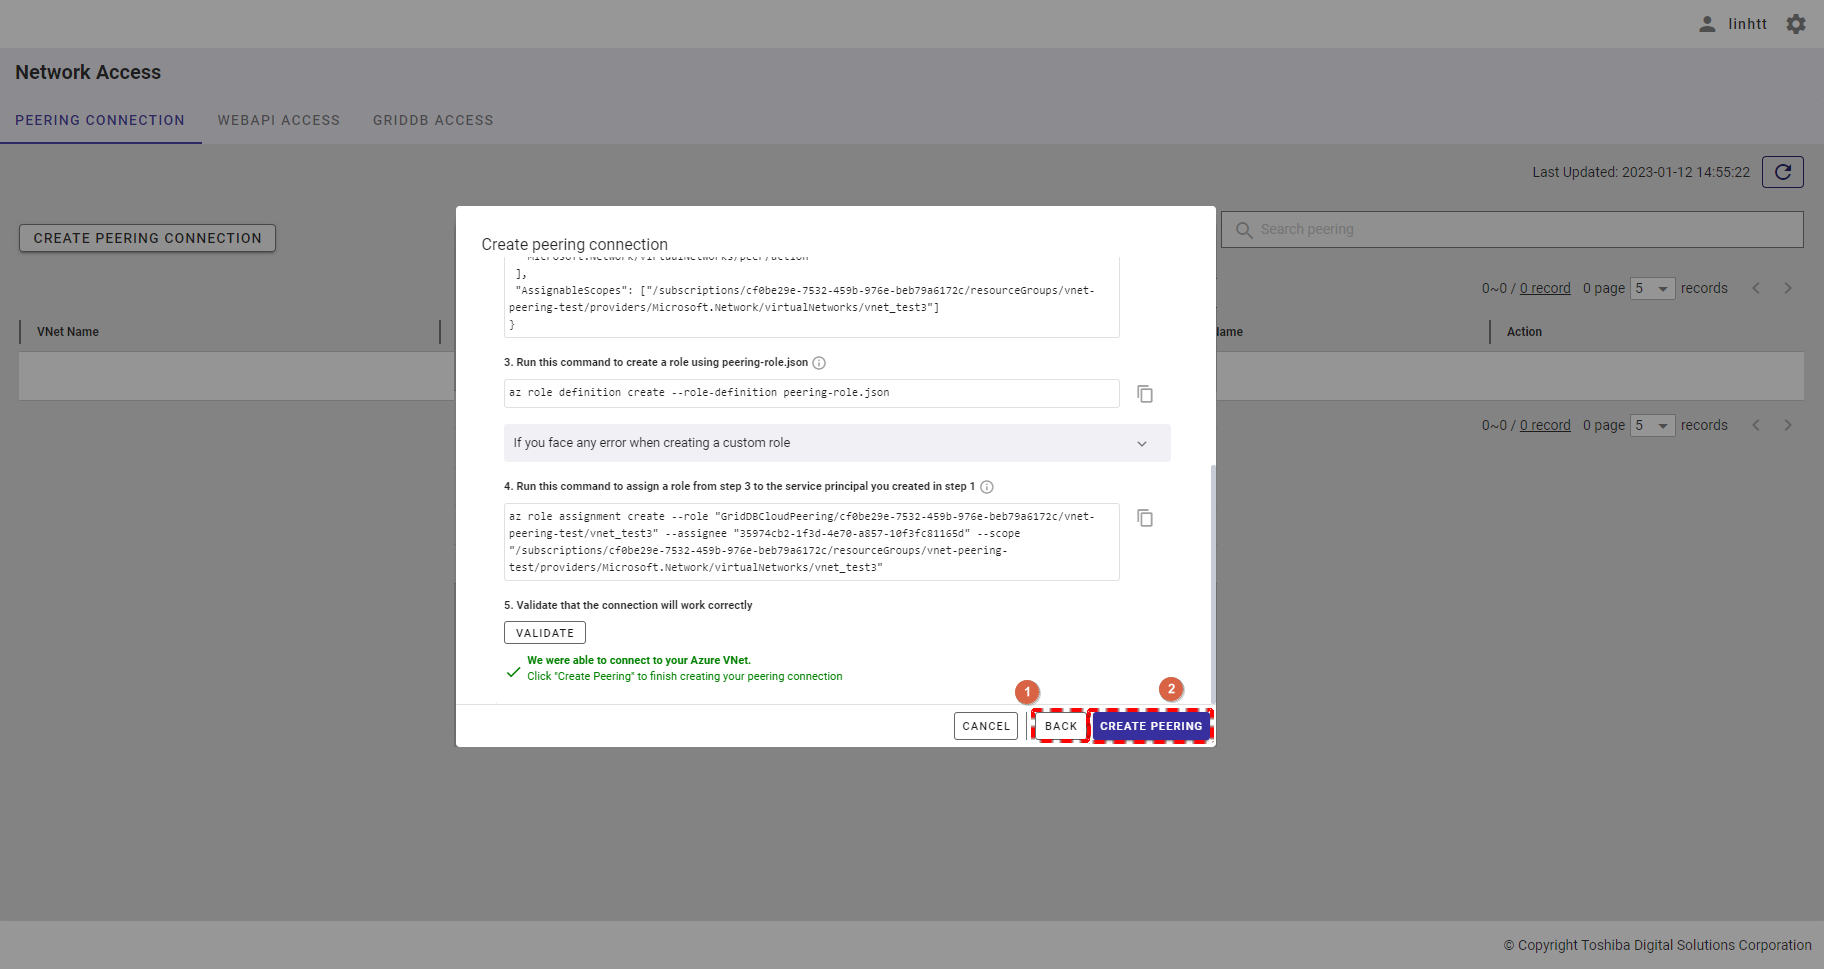
After you have created the connection, you will be directed to the peering connection list screen which contains your new peering connection.
4.18.4 Deleting a peering connection
Step 1: To delete a peering connection, click the [DELETE] button.
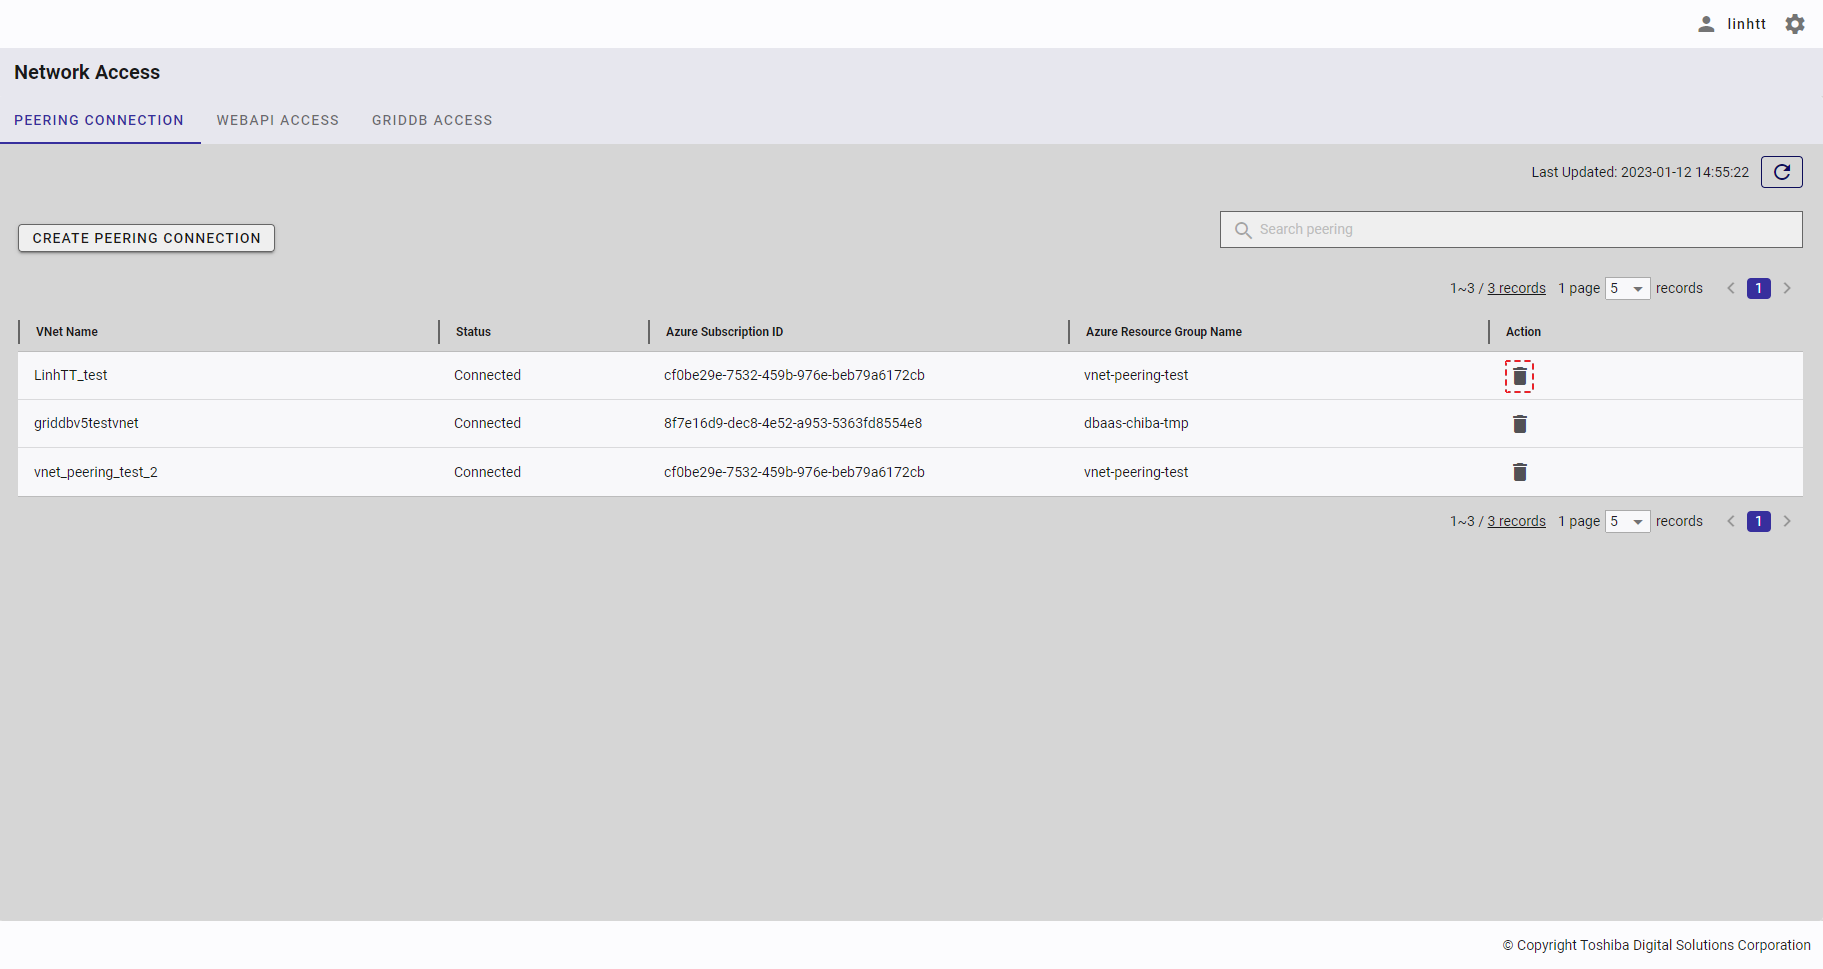
Step 2: Once the [DELETE] button is clicked, a confirmation dialog will be displayed. Click the [YES] button to continue. If you do not want to continue, click the [NO] button to close the confirmation dialog and return to the Peering Connection screen.
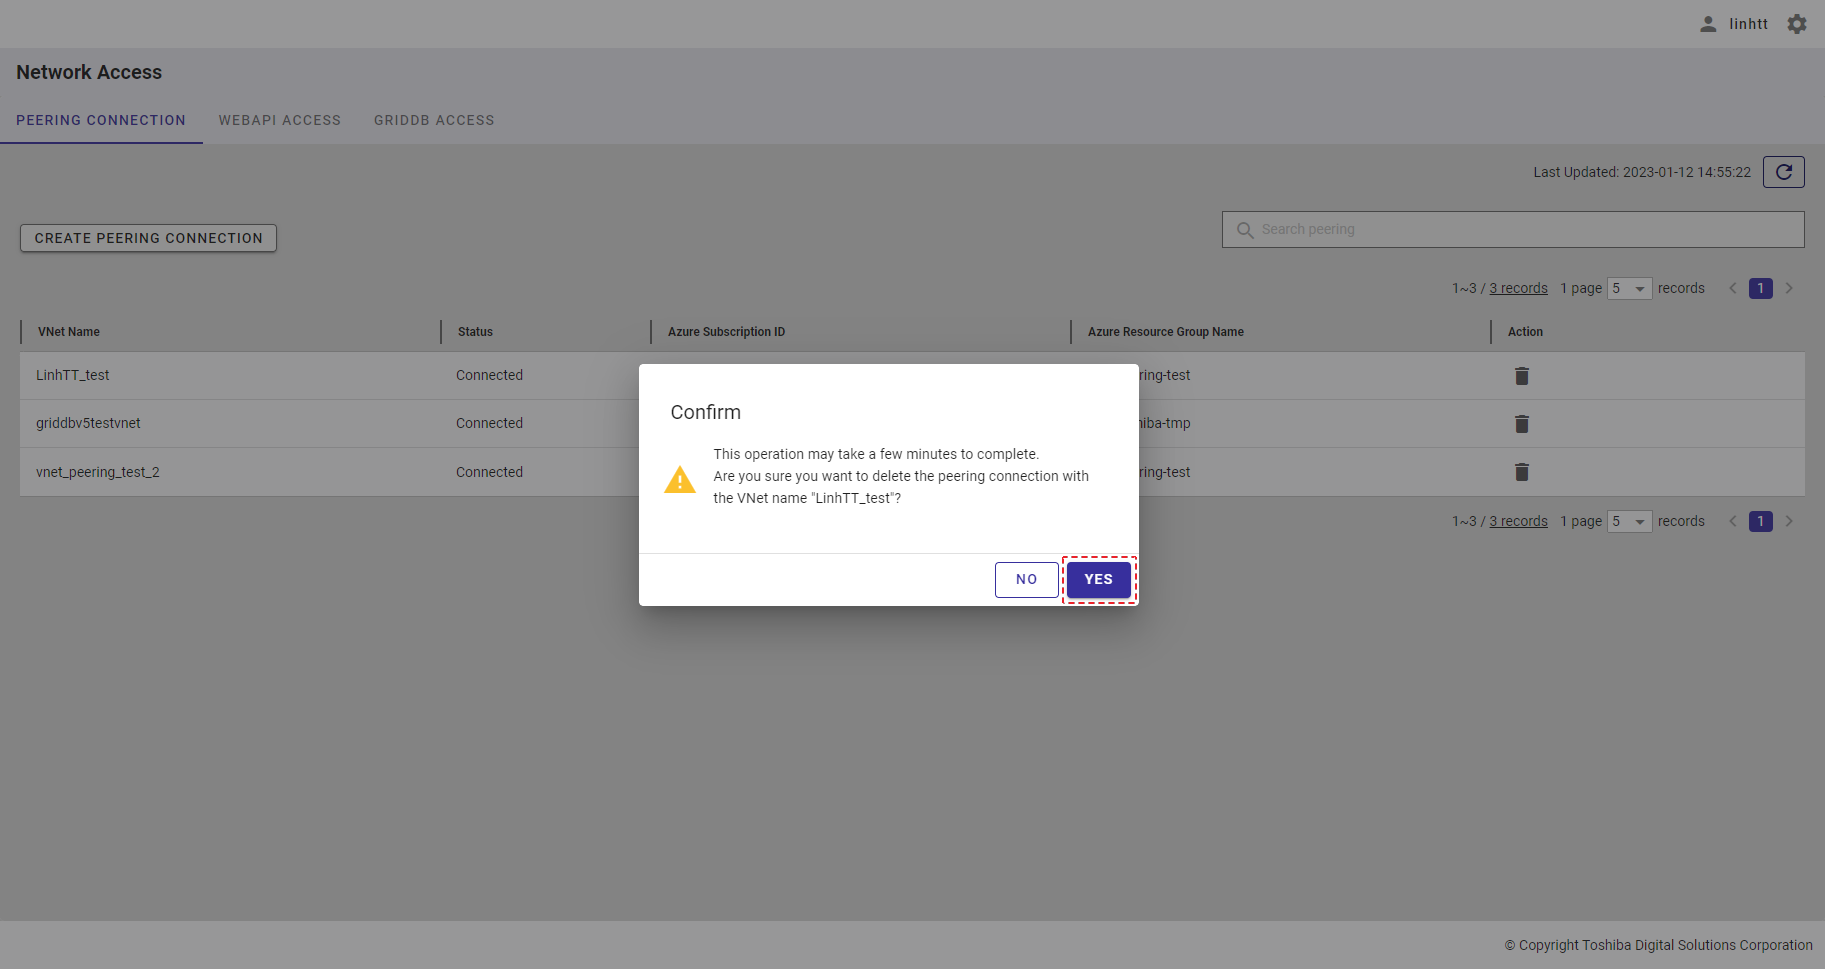
4.19 WebAPI access function
4.19.1 Available roles
In the table below, the role with a plus sign (+) can use the function on the left.
| No. | Function | General user | Administrator user |
|---|---|---|---|
| 1 | Display an exceptional IP address list | - | + |
| 2 | Add an exceptional IP address | - | + |
| 3 | Allow/block all access | - | + |
4.19.2 Displaying an exceptional IP address list
An exceptional IP address list is a list of IP addresses that are allowed to access the WebAPI. You can view the list on the WebAPI Access screen.
To display this list, first you must log in to the system and then click the item [Network Access] (①) in the left menu and select the [WEBAPI ACCESS] tab (②) to display the WebAPI Access screen.
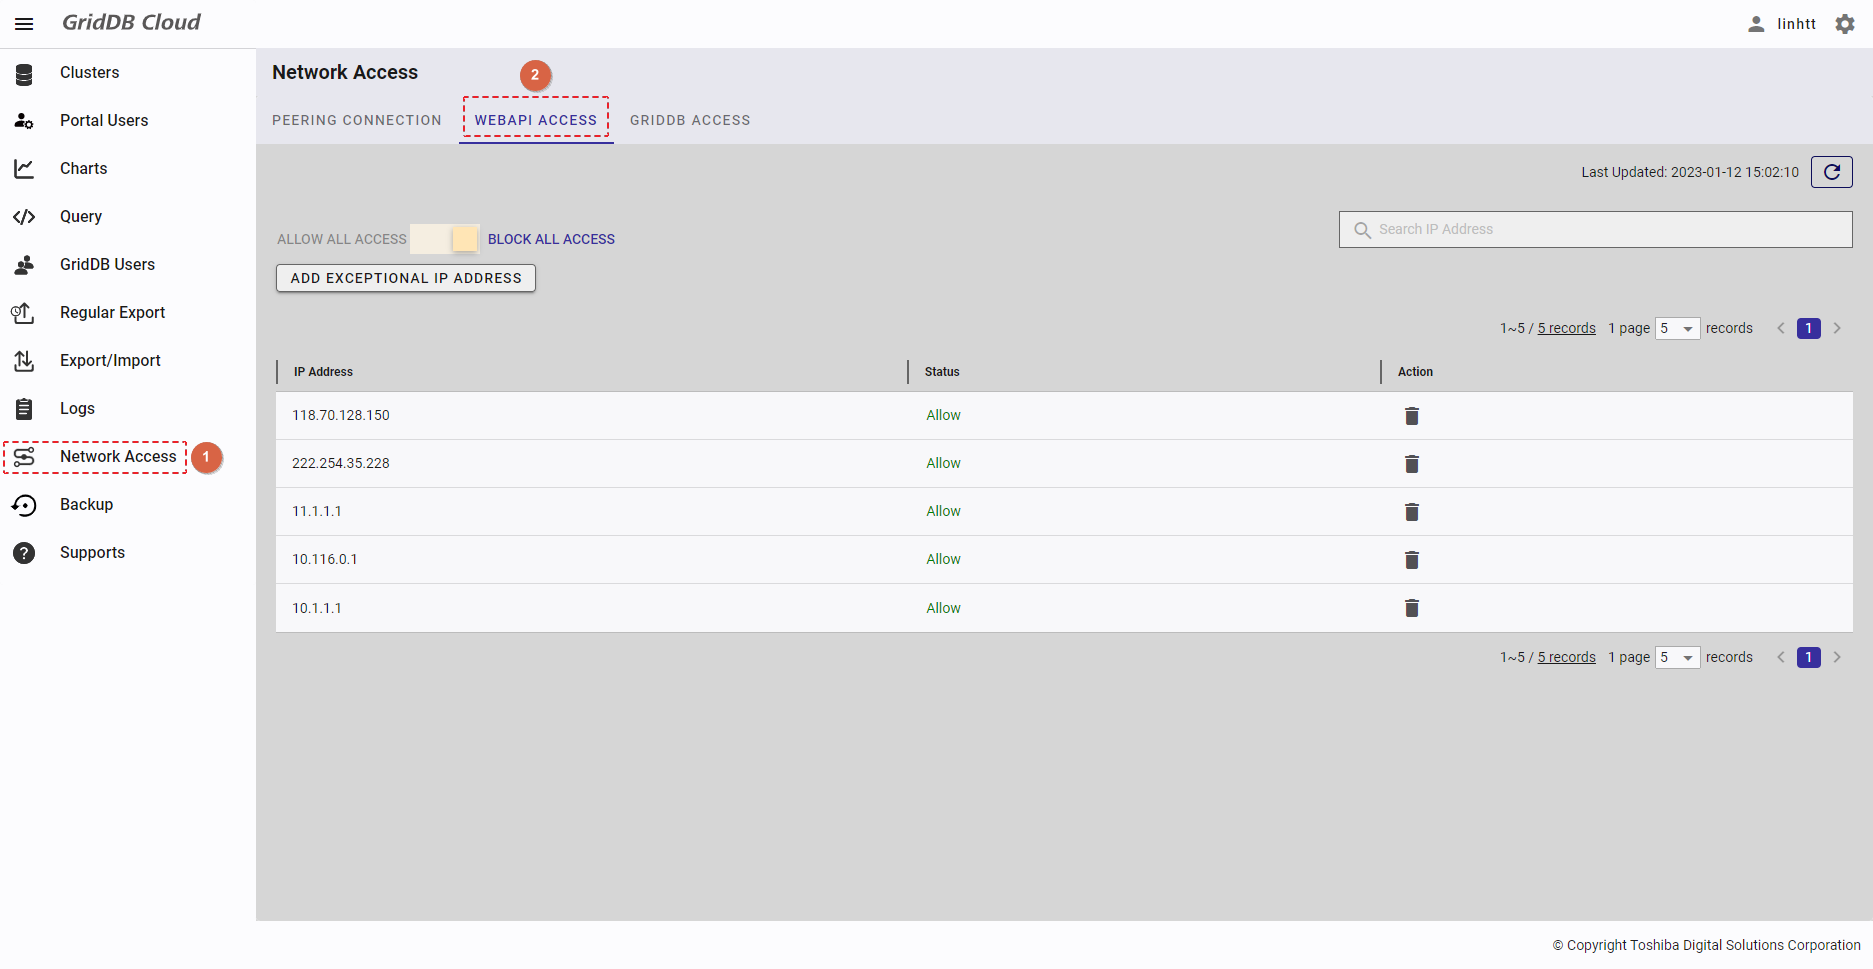
You can click the [Refresh] button (①) to refresh the exceptional IP address list and get the latest information about the list.
To search for a specific IP address, enter its address in the search field (②).
You can choose the number of IP addresses displayed on one page by selecting the number from [5, 10, 15, All] (④) at the top or bottom of the page. Click the [Next] button (⑥) or the [Back] button (⑤), or click the page number (⑦) to view another page.
You can order the exceptional IP address list by IP address or by status, by clicking the header (③) of each column.
You can adjust the column size by dragging and dropping the vertical bar "|" on the header.
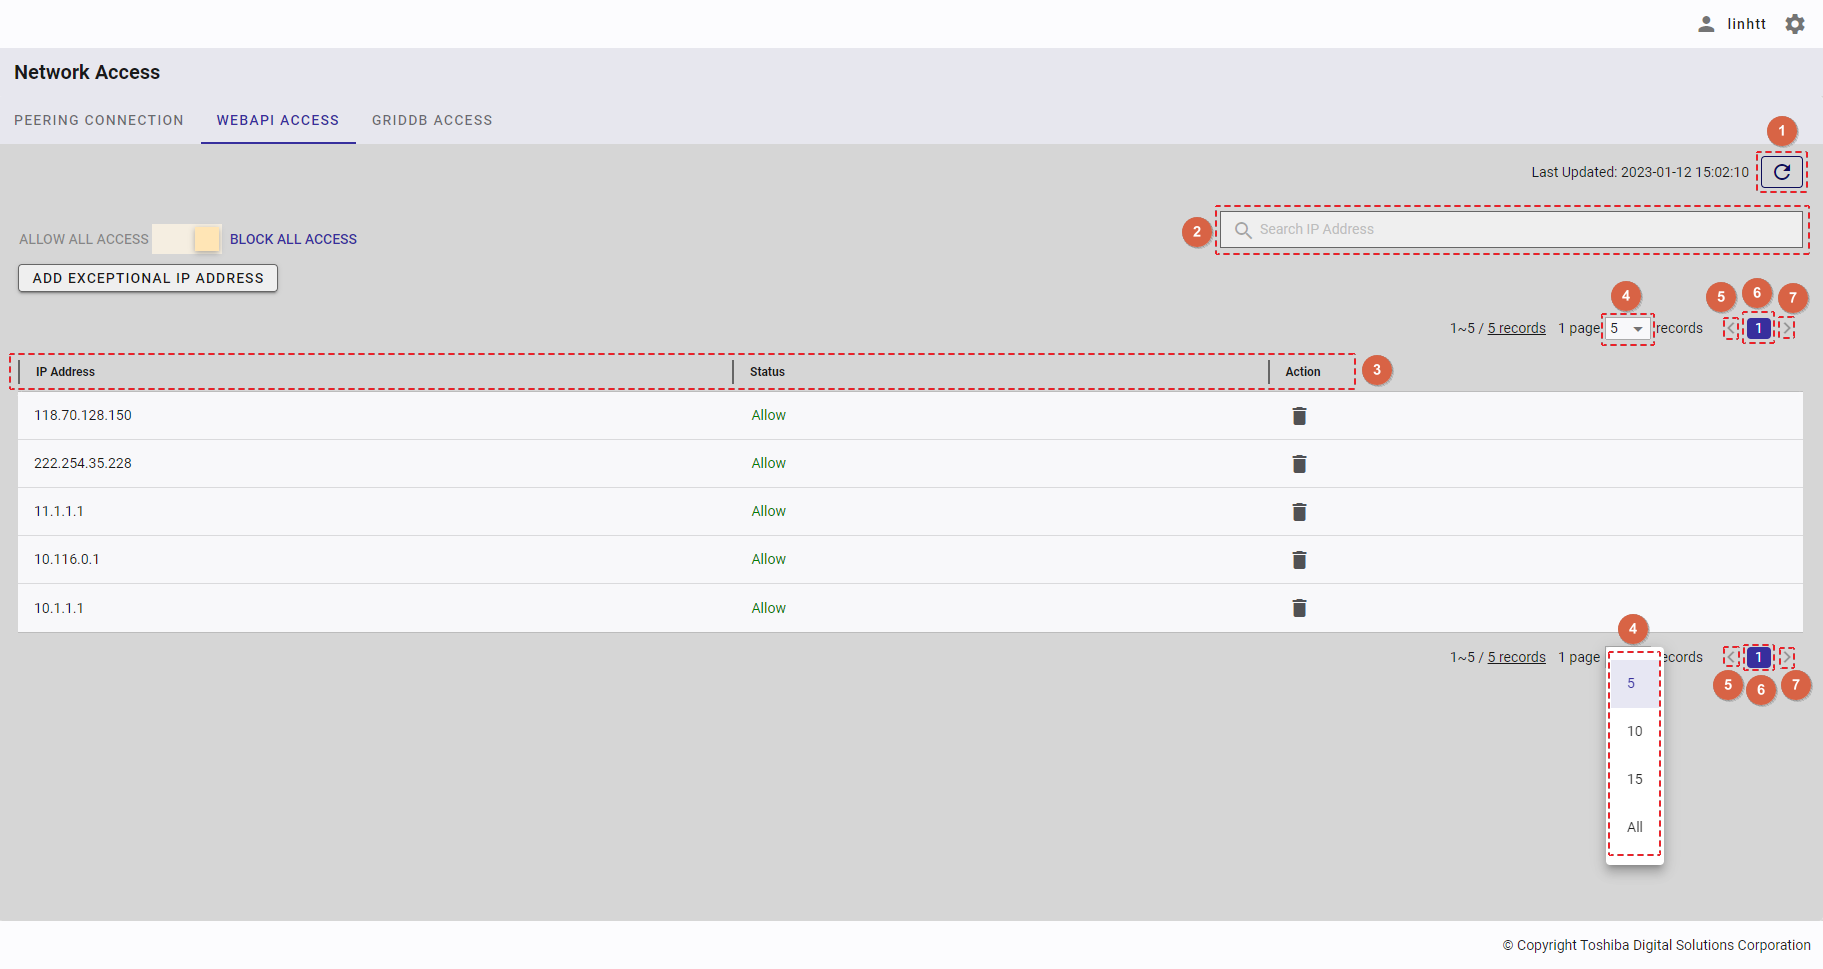
4.19.3 Adding an exceptional IP address
Step 1: To add an exceptional IP address to the exceptional IP address list, click the [ADD EXCEPTIONAL IP ADDRESS] button.
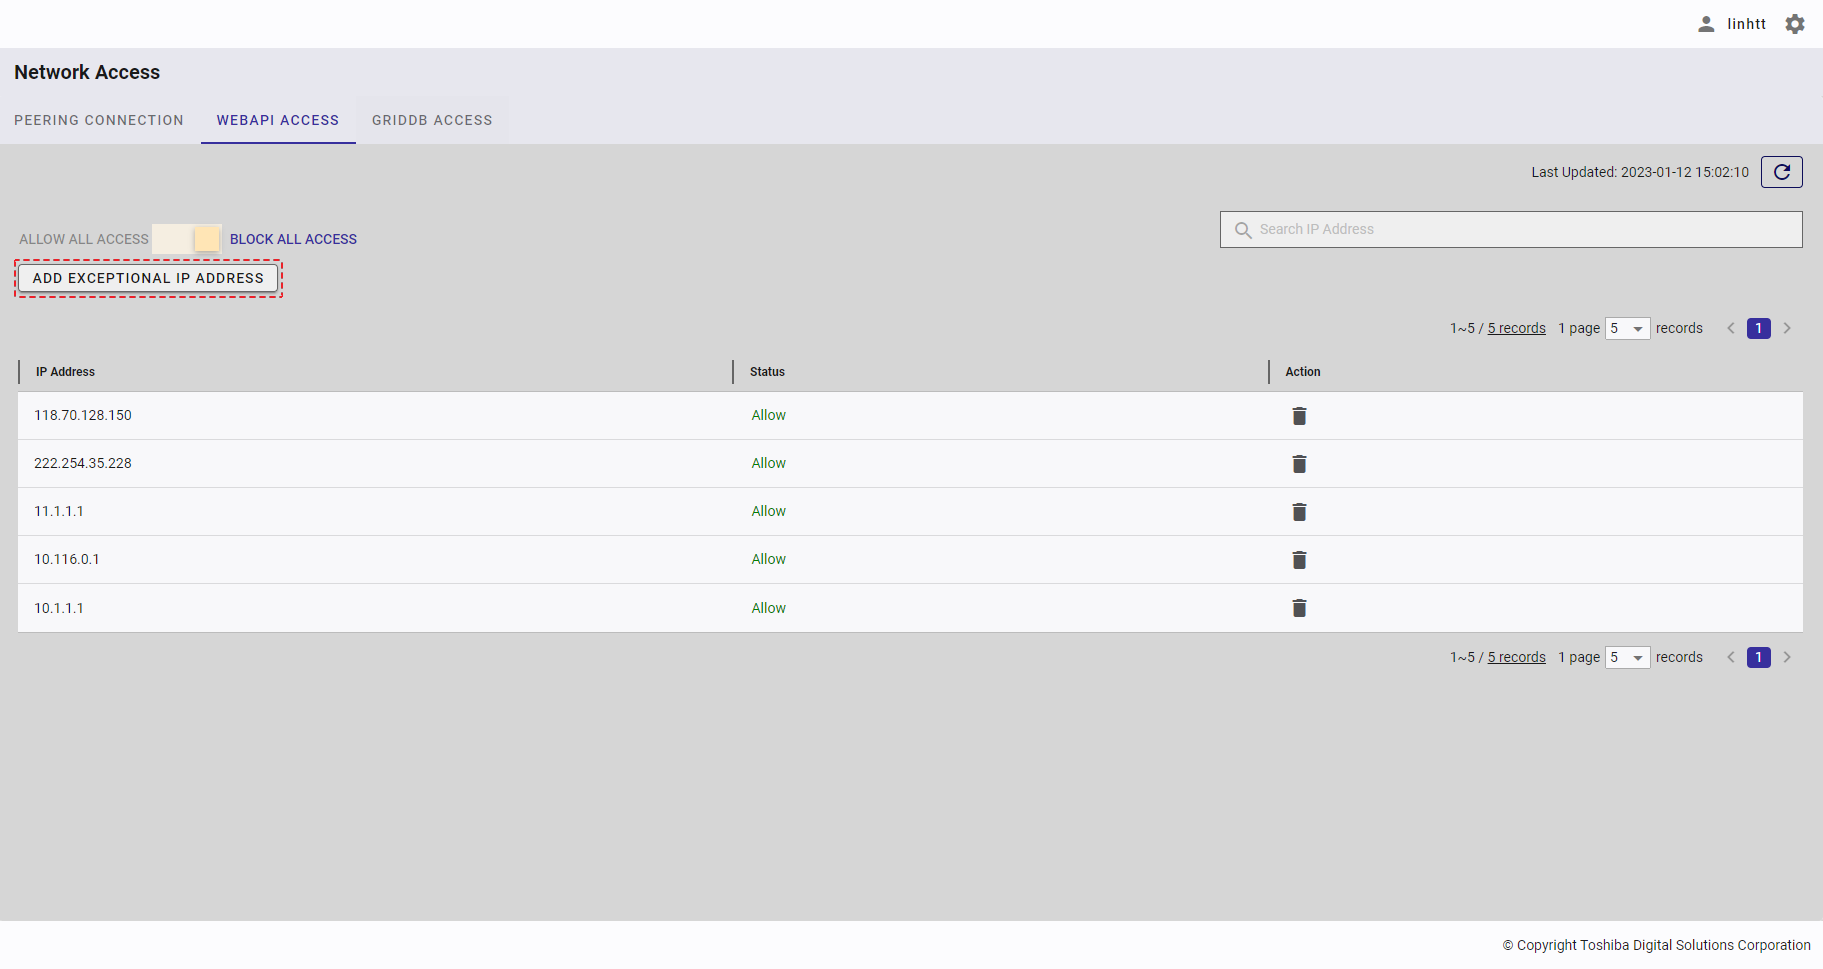
Step 2: Enter an exceptional IP address to be added in the [Exceptional IP address] text box.
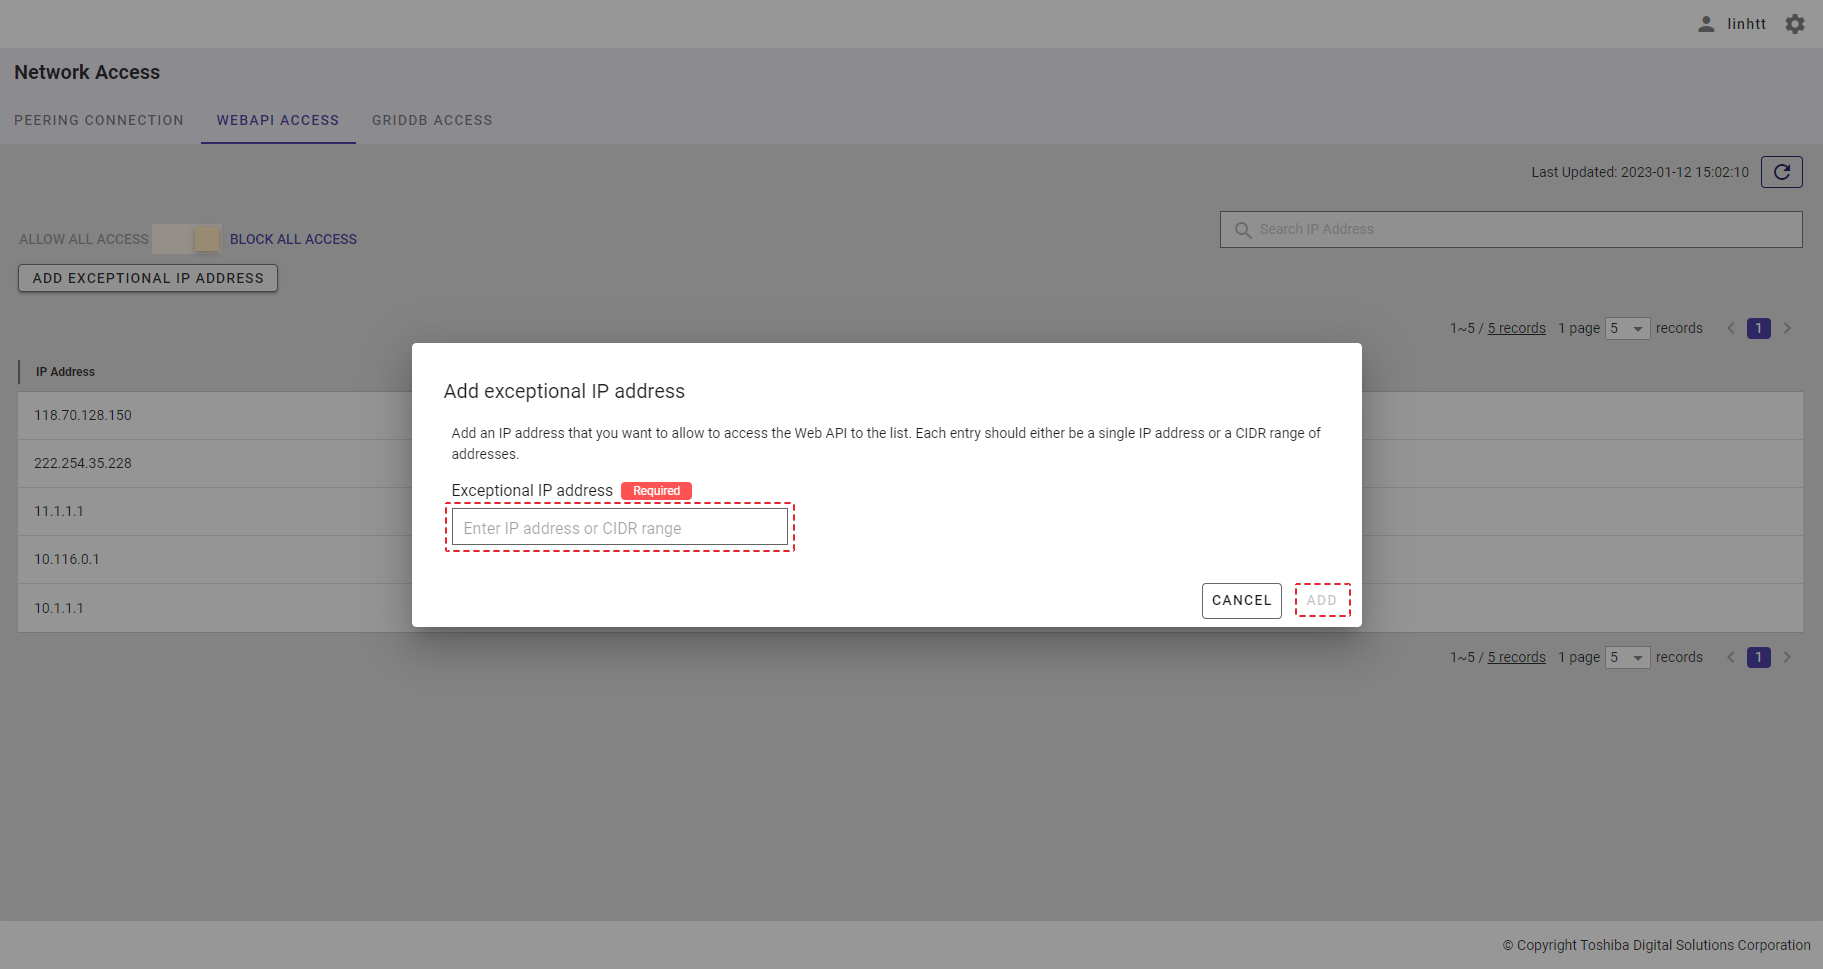
Step 3: Click the [ADD] button to add, or click the [CANCEL] button to close the dialog.
4.19.4 Allowing/blocking all access
Step 1: To allow or block all access to the WebAPI, click the toggle switch for [ALLOW ALL ACCESS] or [BLOCK ALL ACCESS] (①) at the top of the screen.
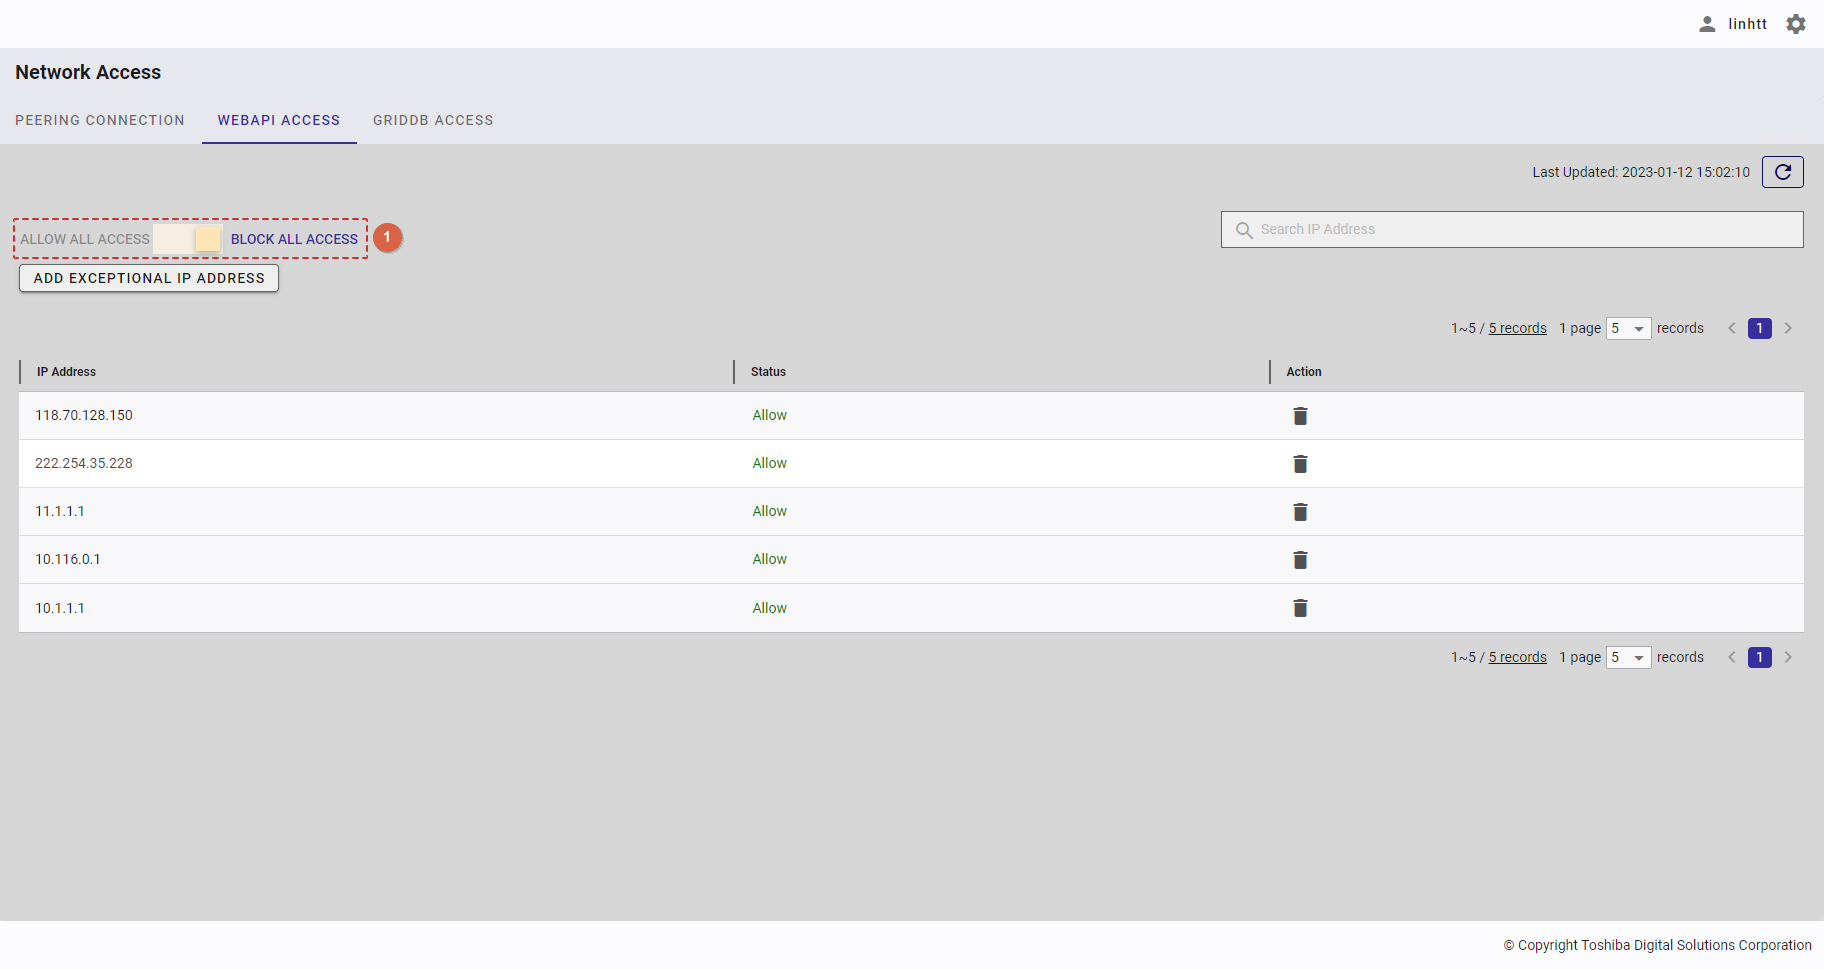
Step 2: If you click the toggle switch for [ALLOW ALL ACCESS] to allow all access, a confirmation dialog will appear. Click the [YES] button to allow all access, or click the [CANCEL] button to close the dialog without changing the status. Once the [YES] button is clicked, the system will delete all IP addresses from the exceptional IP address list to allow all access to the WebAPI.
As a result, the [ADD EXCEPTIONAL IP ADDRESS] button (②) is disabled.
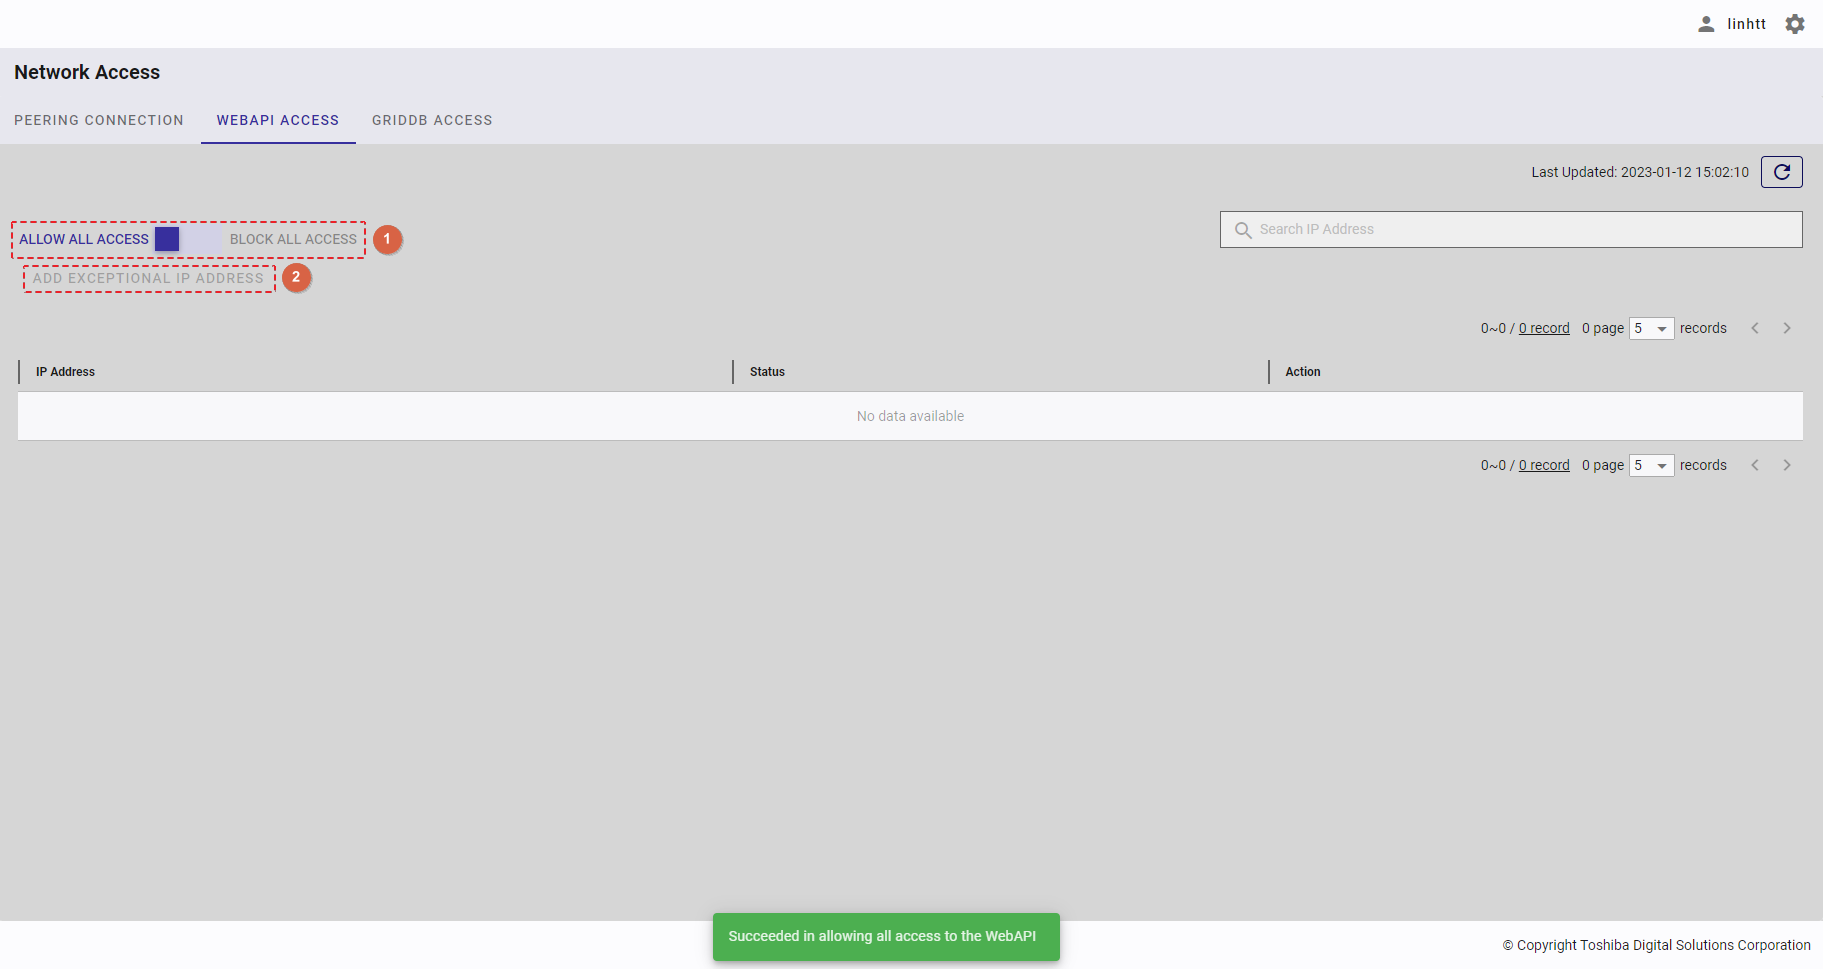
On the other hand, if you click the toggle switch for [BLOCK ALL ACCESS] to block all access, the system will change the system status to block all access to the WebAPI.
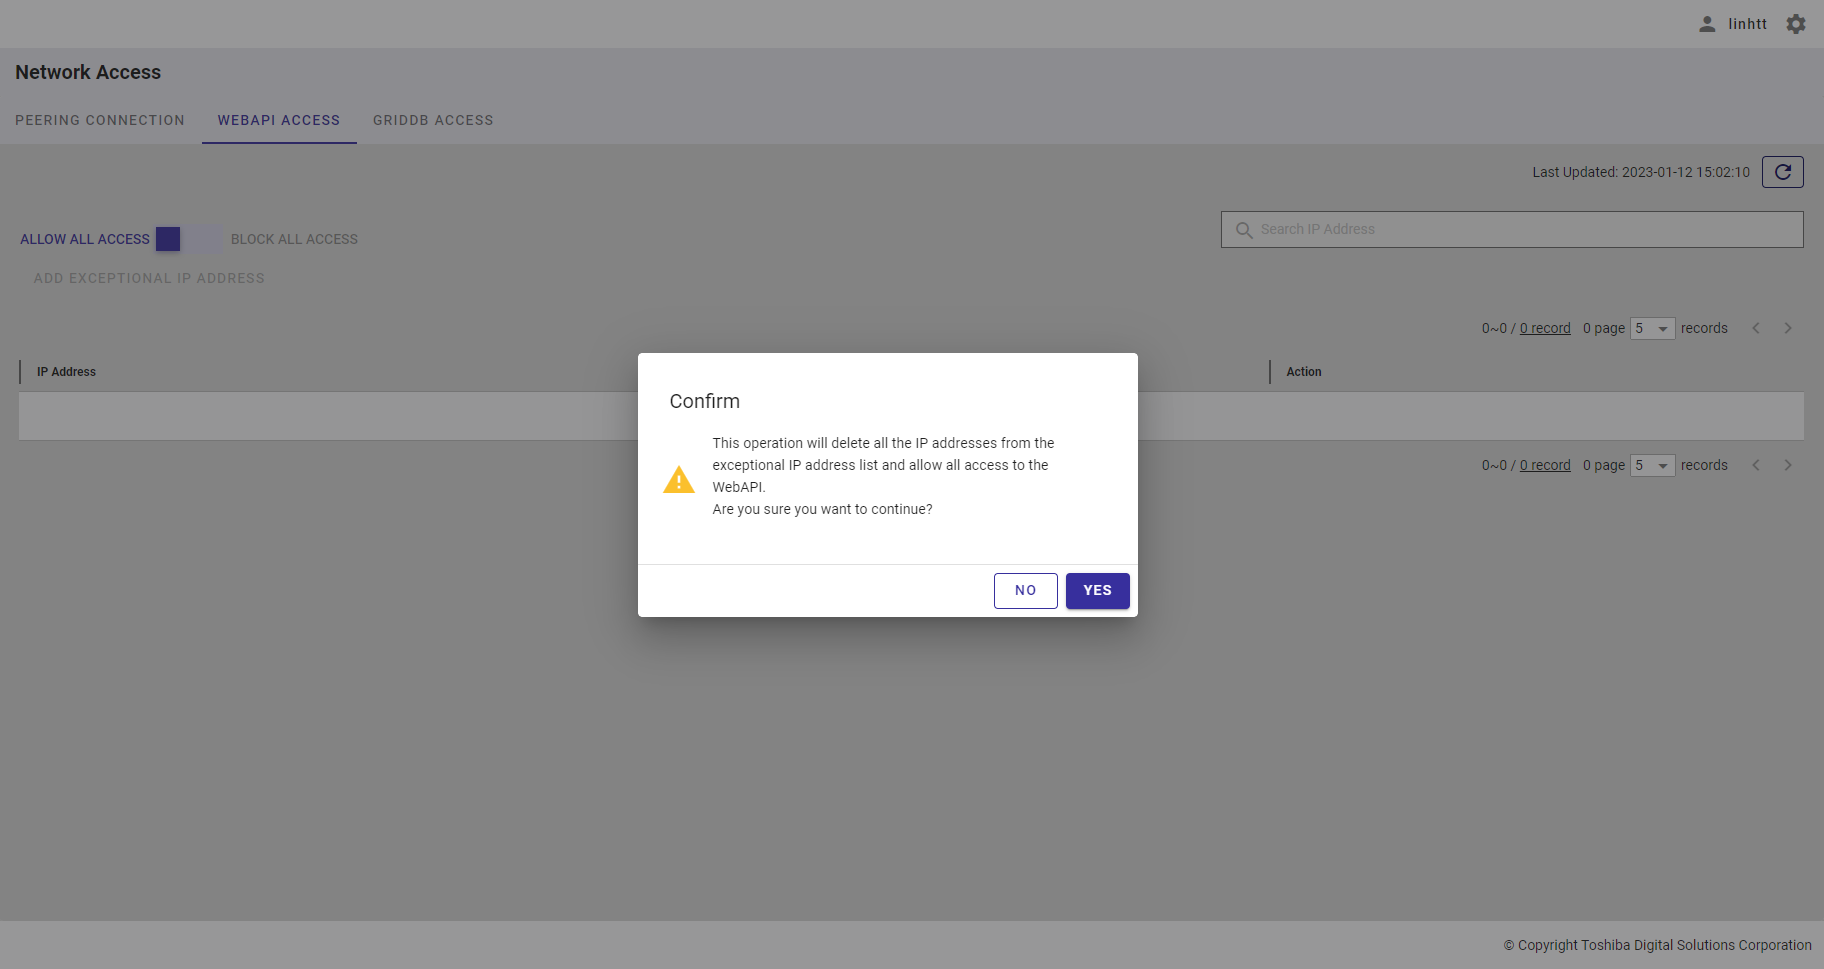
4.20 GridDB access function
4.20.1 Available roles
In the table below, the role with a plus sign (+) can use the function on the left.
| No. | Function | General user | Administrator user |
|---|---|---|---|
| 1 | Display an exceptional IP address list | - | + |
| 2 | Add an exceptional IP address | - | + |
| 3 | Delete an IP address | - | + |
| 4 | Delete multiple IP addresses | - | + |
4.20.2 Displaying an exceptional IP address list
An exceptional IP address list is a list of IP addresses that are allowed to access the GridDB. You can view the list on the GridDB Access screen.
To display this list, first you must log in to the system and then click the item [Network Access] (①) in the left menu and select the [GridDB ACCESS] tab (②) to display the GridDB Access screen.
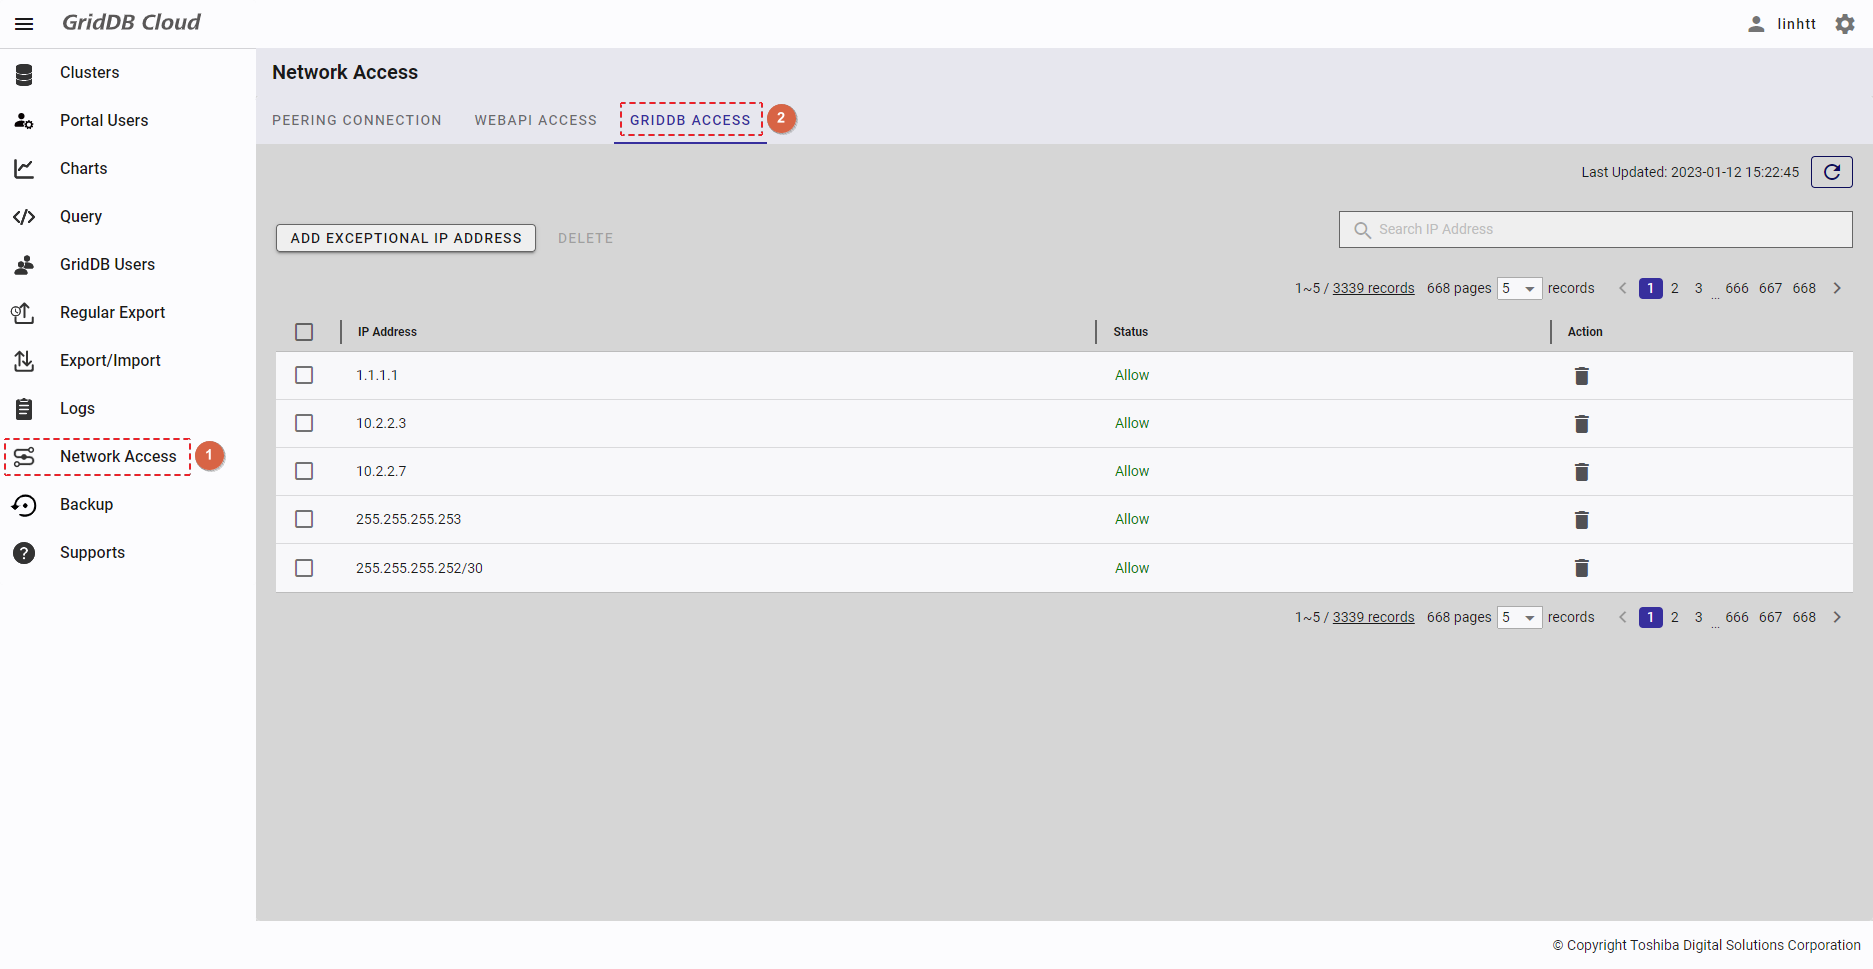
- You can click the [Refresh] button (①) to refresh the exceptional IP address list and get the latest information about the list.
- To search for a specific IP address, enter its address in the search field (②).
- You can choose the number of IP addresses displayed on one page by selecting the number from [5, 10, 15, All] (④) at the top or bottom of the page. Click the [Next] button (⑥) or the [Back] button (⑤), or click the page number (⑦) to view another page.
- You can order the exceptional IP address list by IP address or by status, by clicking the header (③) of each column.
- You can adjust the column size by dragging and dropping the vertical bar "|" on the header.
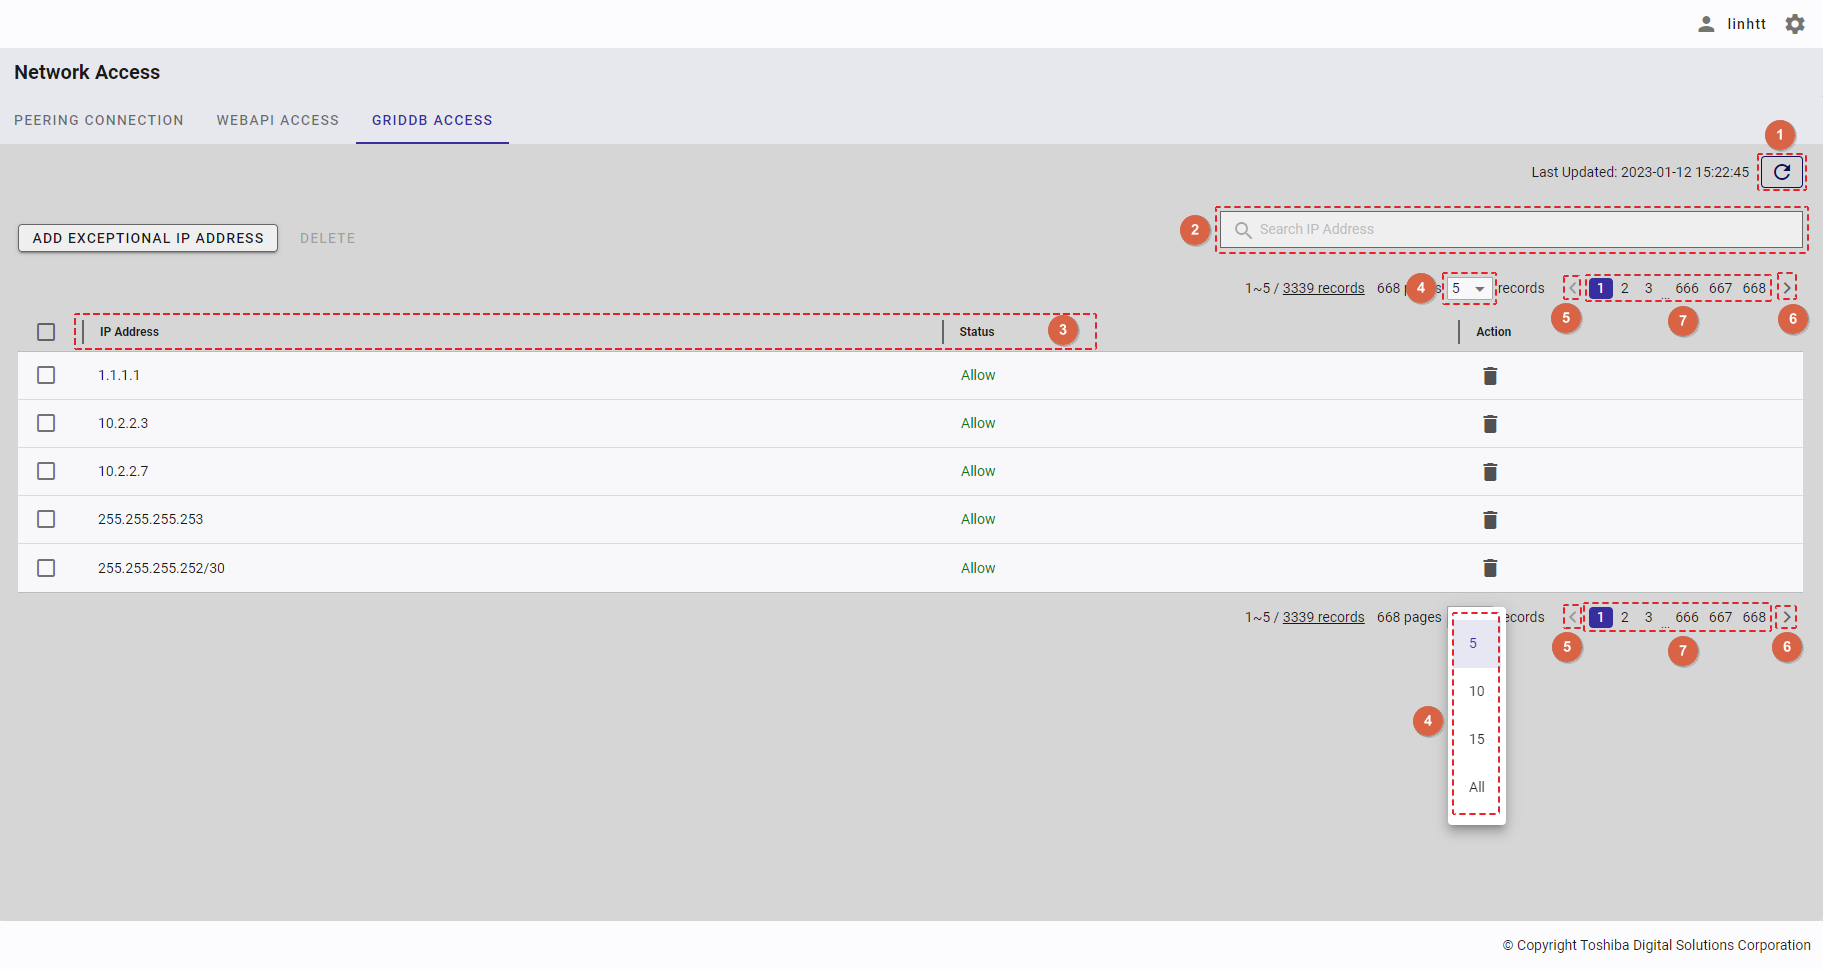
4.20.3 Adding an exceptional IP address
Step 1: To add an exceptional IP address to the exceptional IP address list, click the [ADD EXCEPTIONAL IP ADDRESS] button.
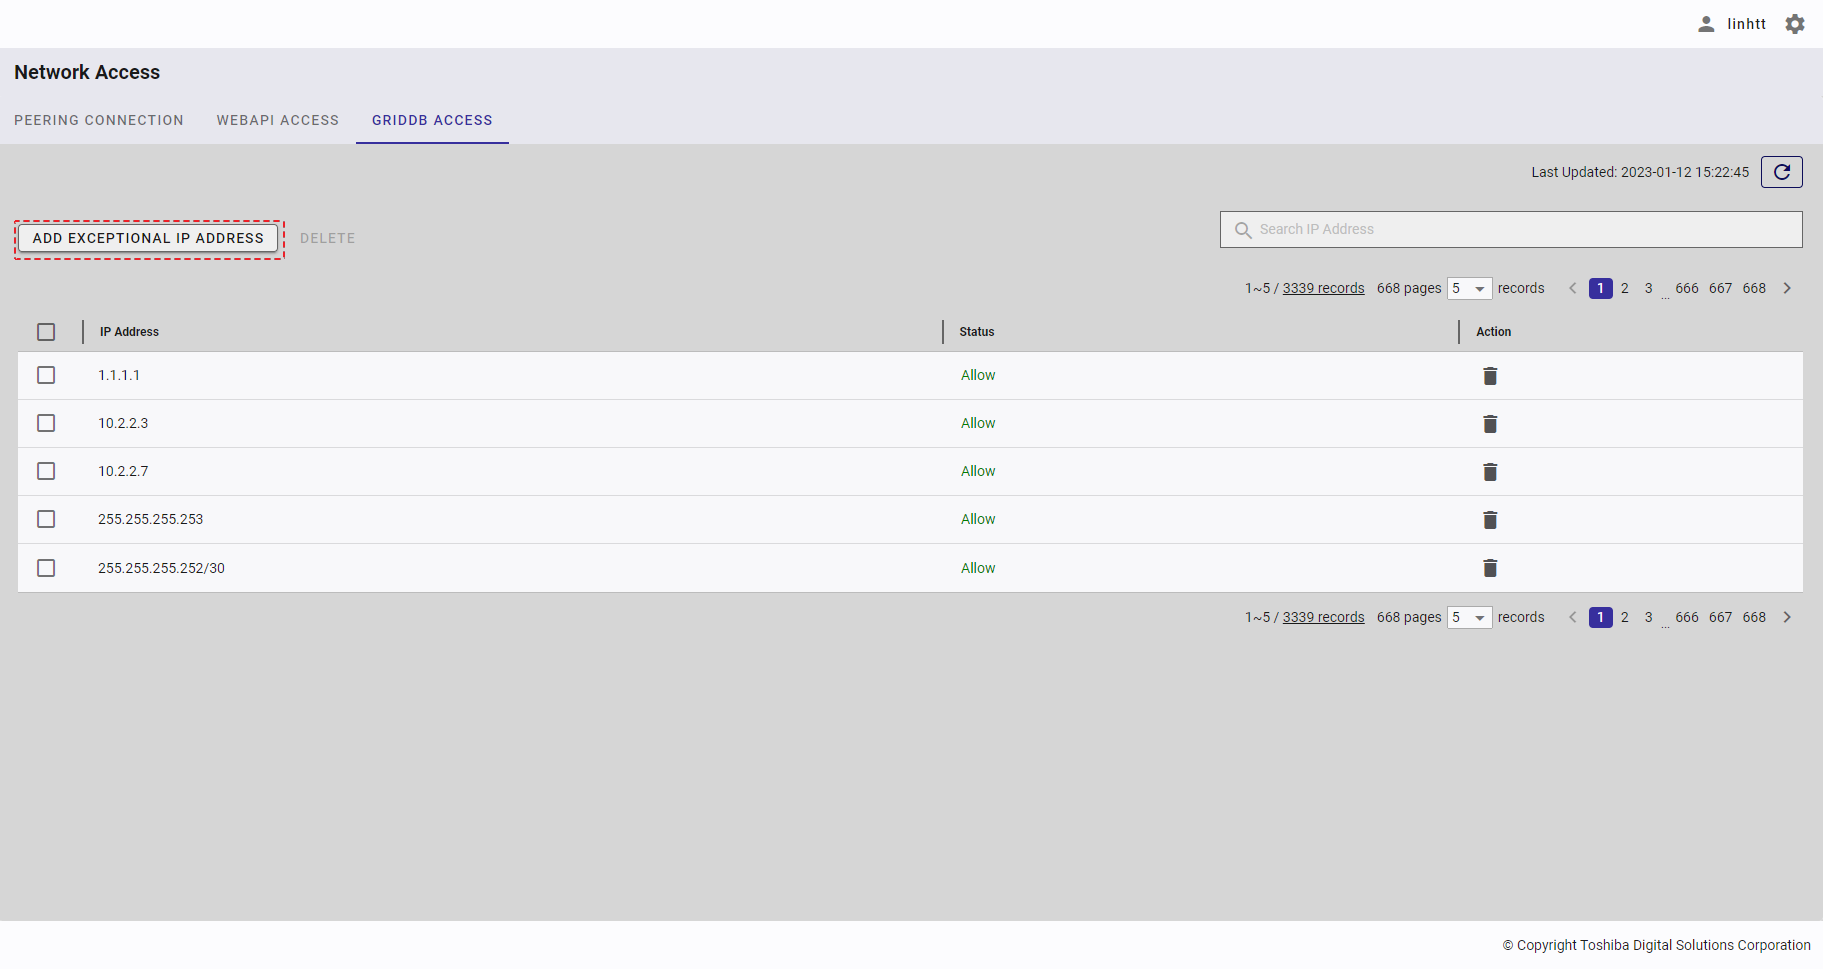
Step 2: Enter an exceptional IP address to be added in the [Exceptional IP address] text box.
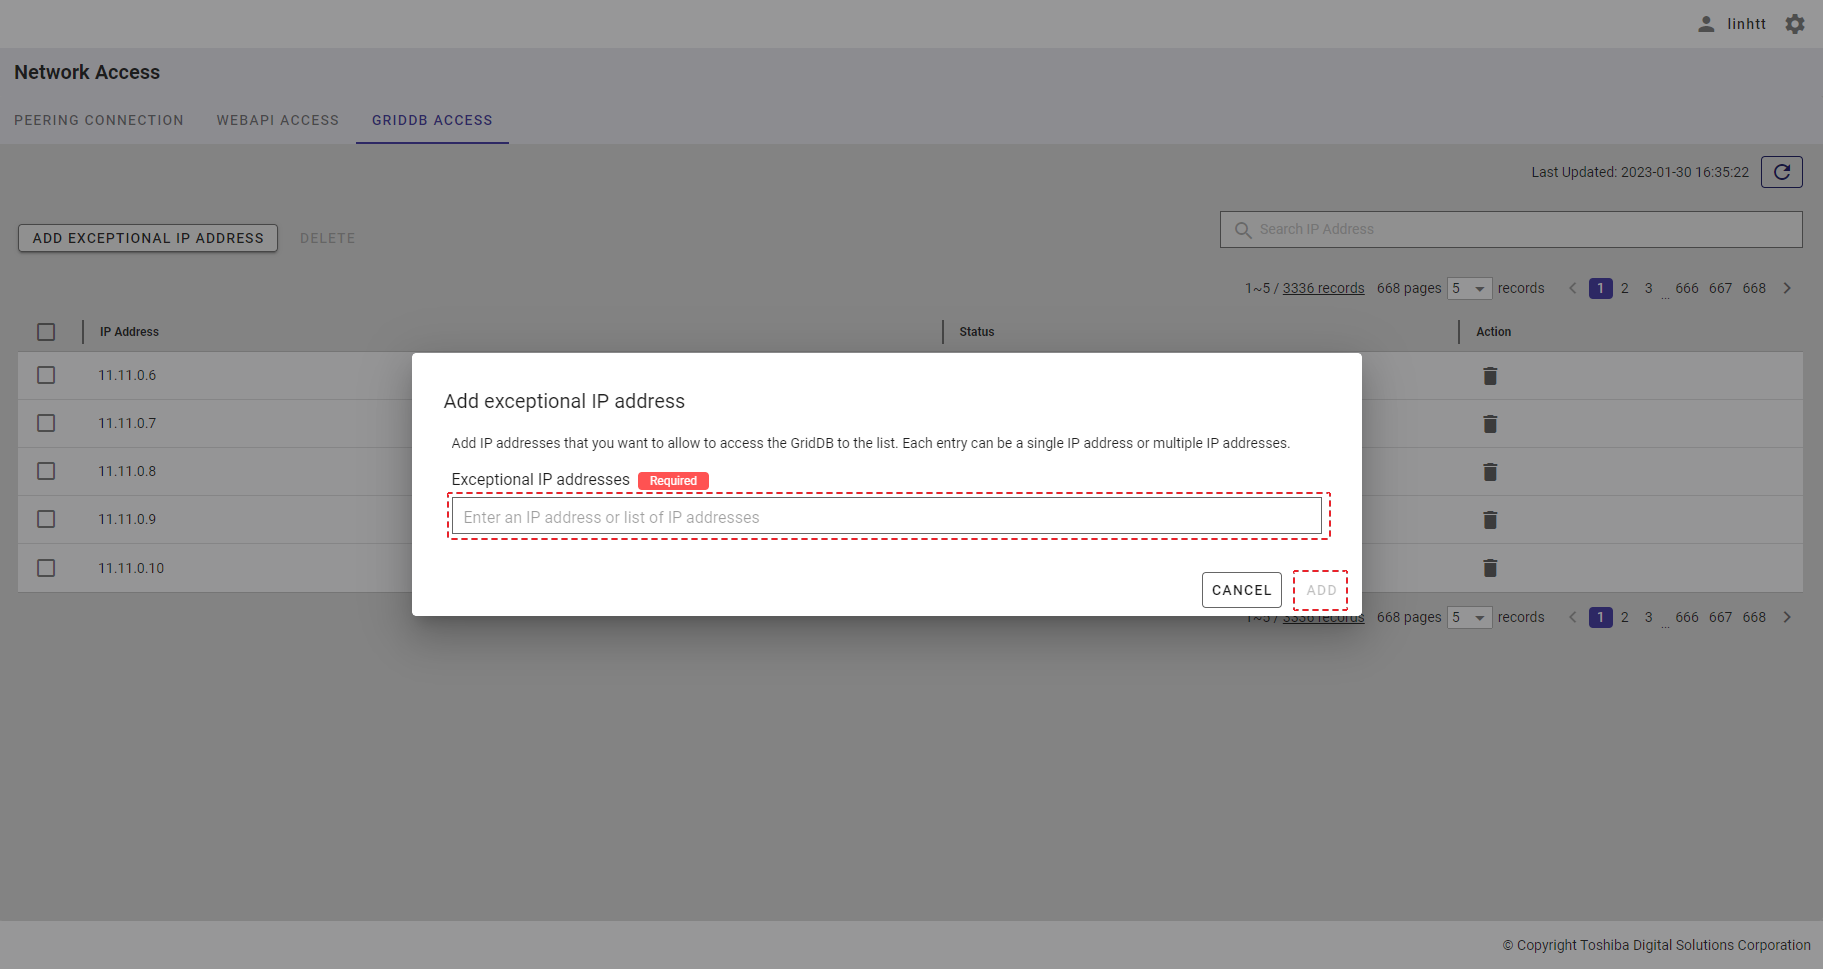
Step 3: Click the [ADD] button to add, or click the [CANCEL] button to close the dialog.
4.20.4 Deleting an IP address
Step 1: To delete an IP address, click the [Delete] button (①).
[Note]: An IP address that is currently in [Processing] status cannot be deleted using the [Delete] button.
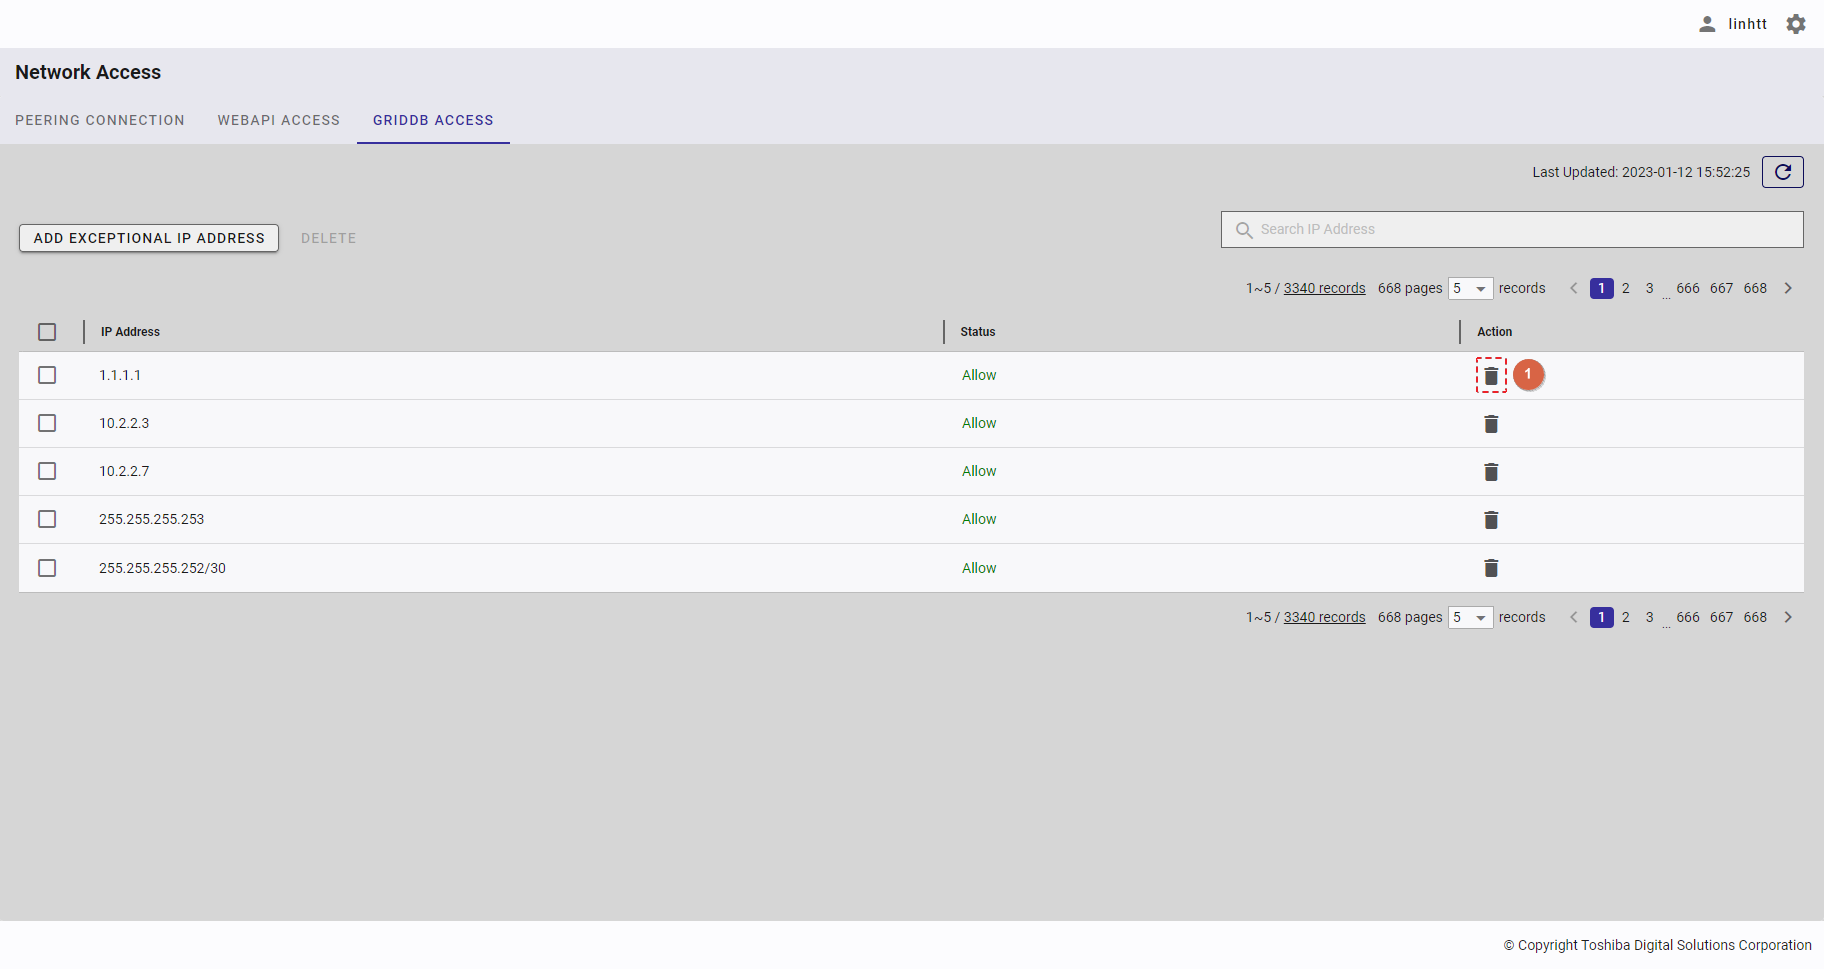
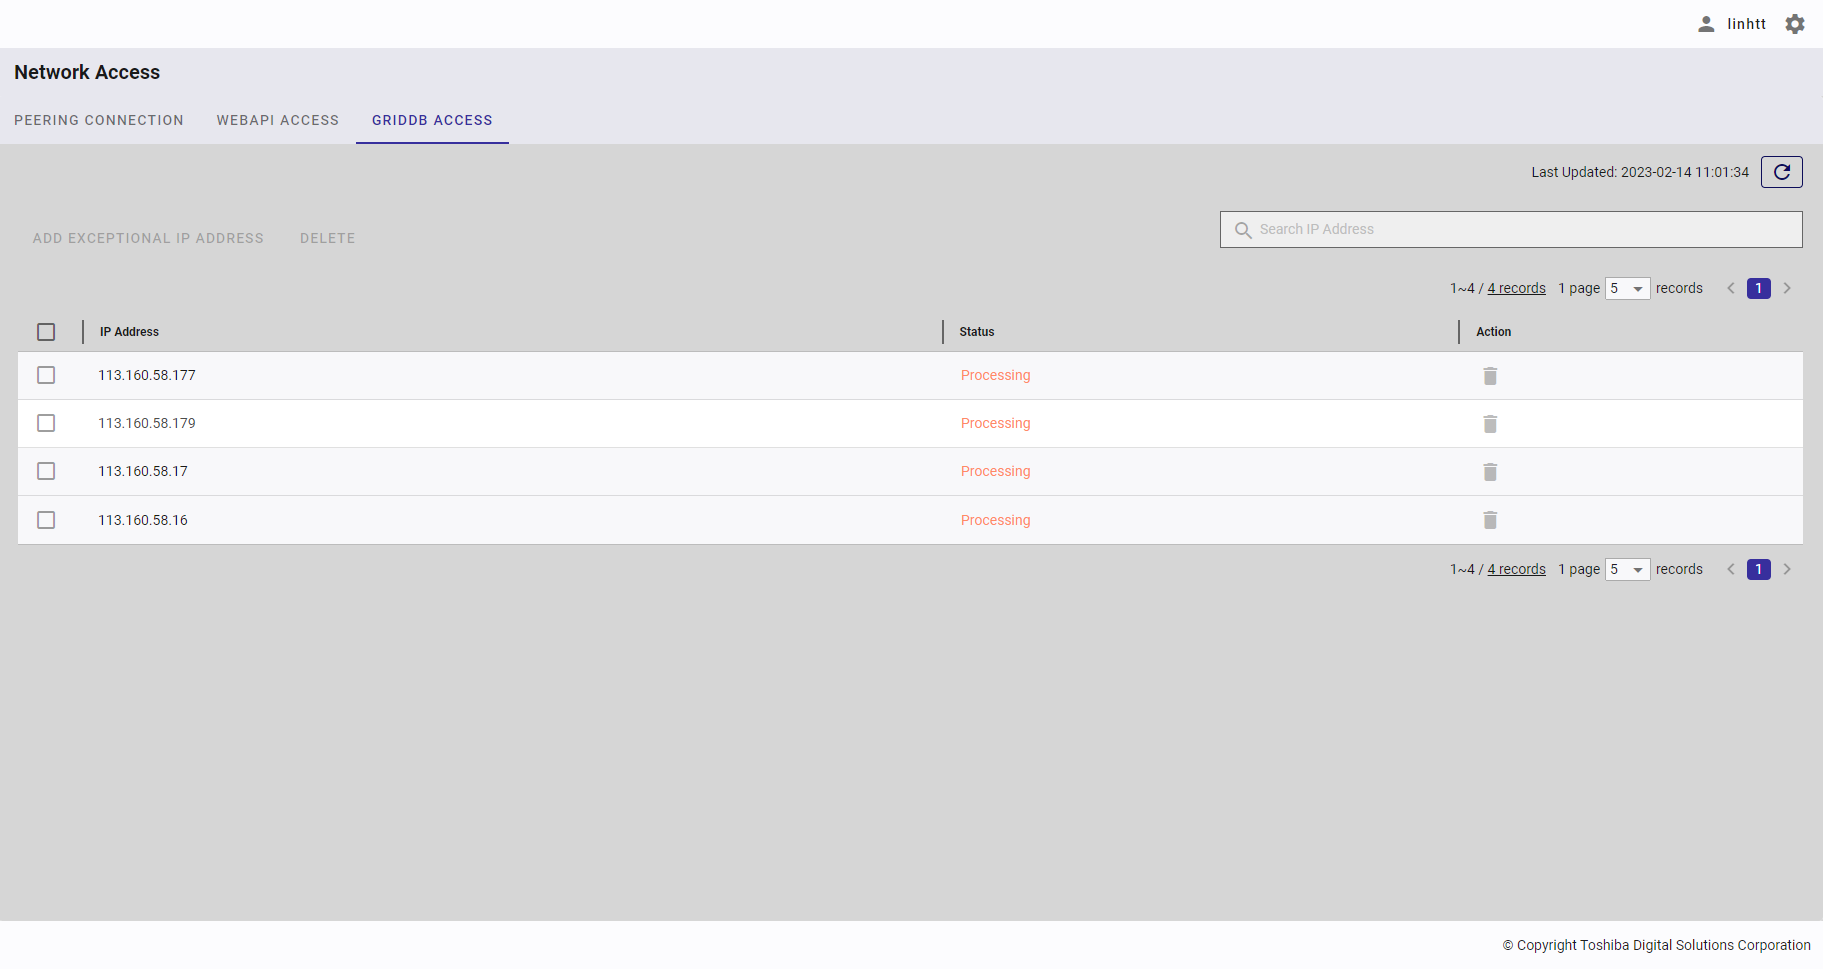
Step 2: Once the confirmation dialog is displayed, click the [YES] button to continue to delete the IP address. Or click the [NO] button to go back to the IP address list screen without deleting the IP address.
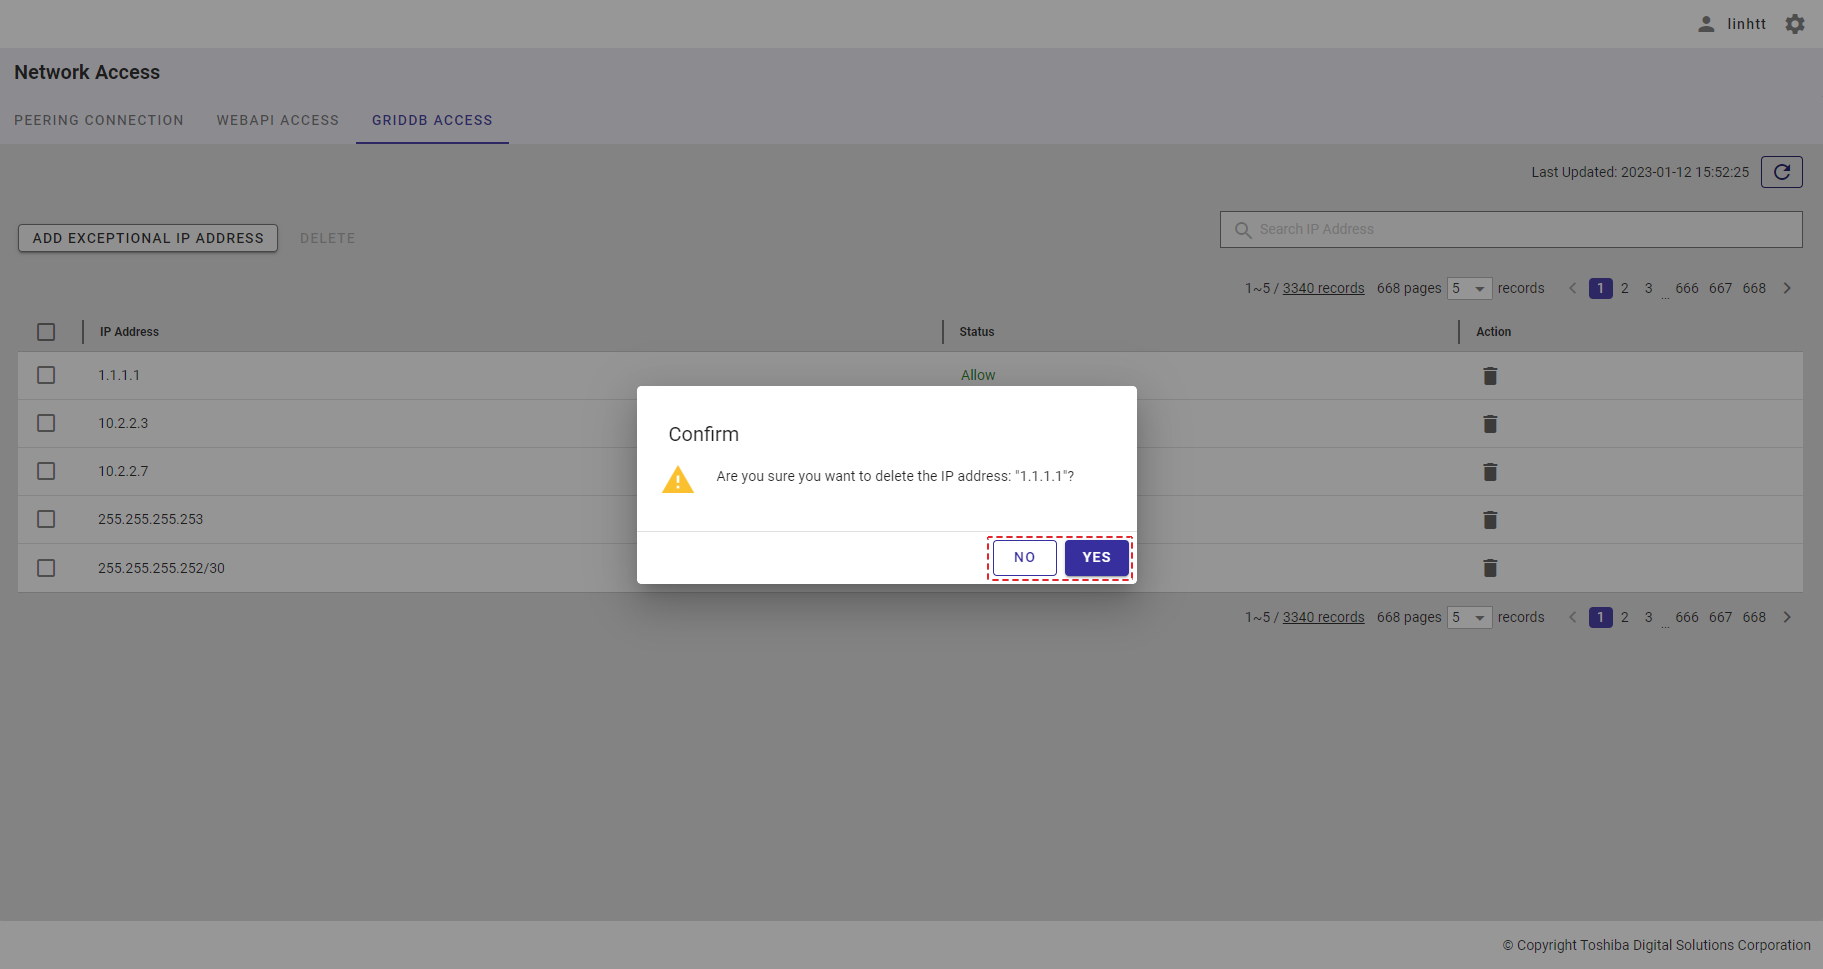
When the IP address is successfully deleted, the system will go back to the IP address list screen where the status of all IP addresses turns to [Processing]. After a few minutes, when the processing is completed, the deleted IP address is not found on the IP address list screen and the status of all other IP addresses turns to [Allow].
4.20.5 Deleting multiple IP addresses
Step 1: To delete multiple IP addresses, check the checkbox of the corresponding IP address to delete on the left of each record (①). Or click the top checkbox (②) on the left to select all the IP addresses on the same page.
Click the [DELETE] button (③). To enable the button, at least one IP address must be selected.
[Note]: IP addresses that are currently in [Processing] status cannot be deleted using the [DELETE] button.
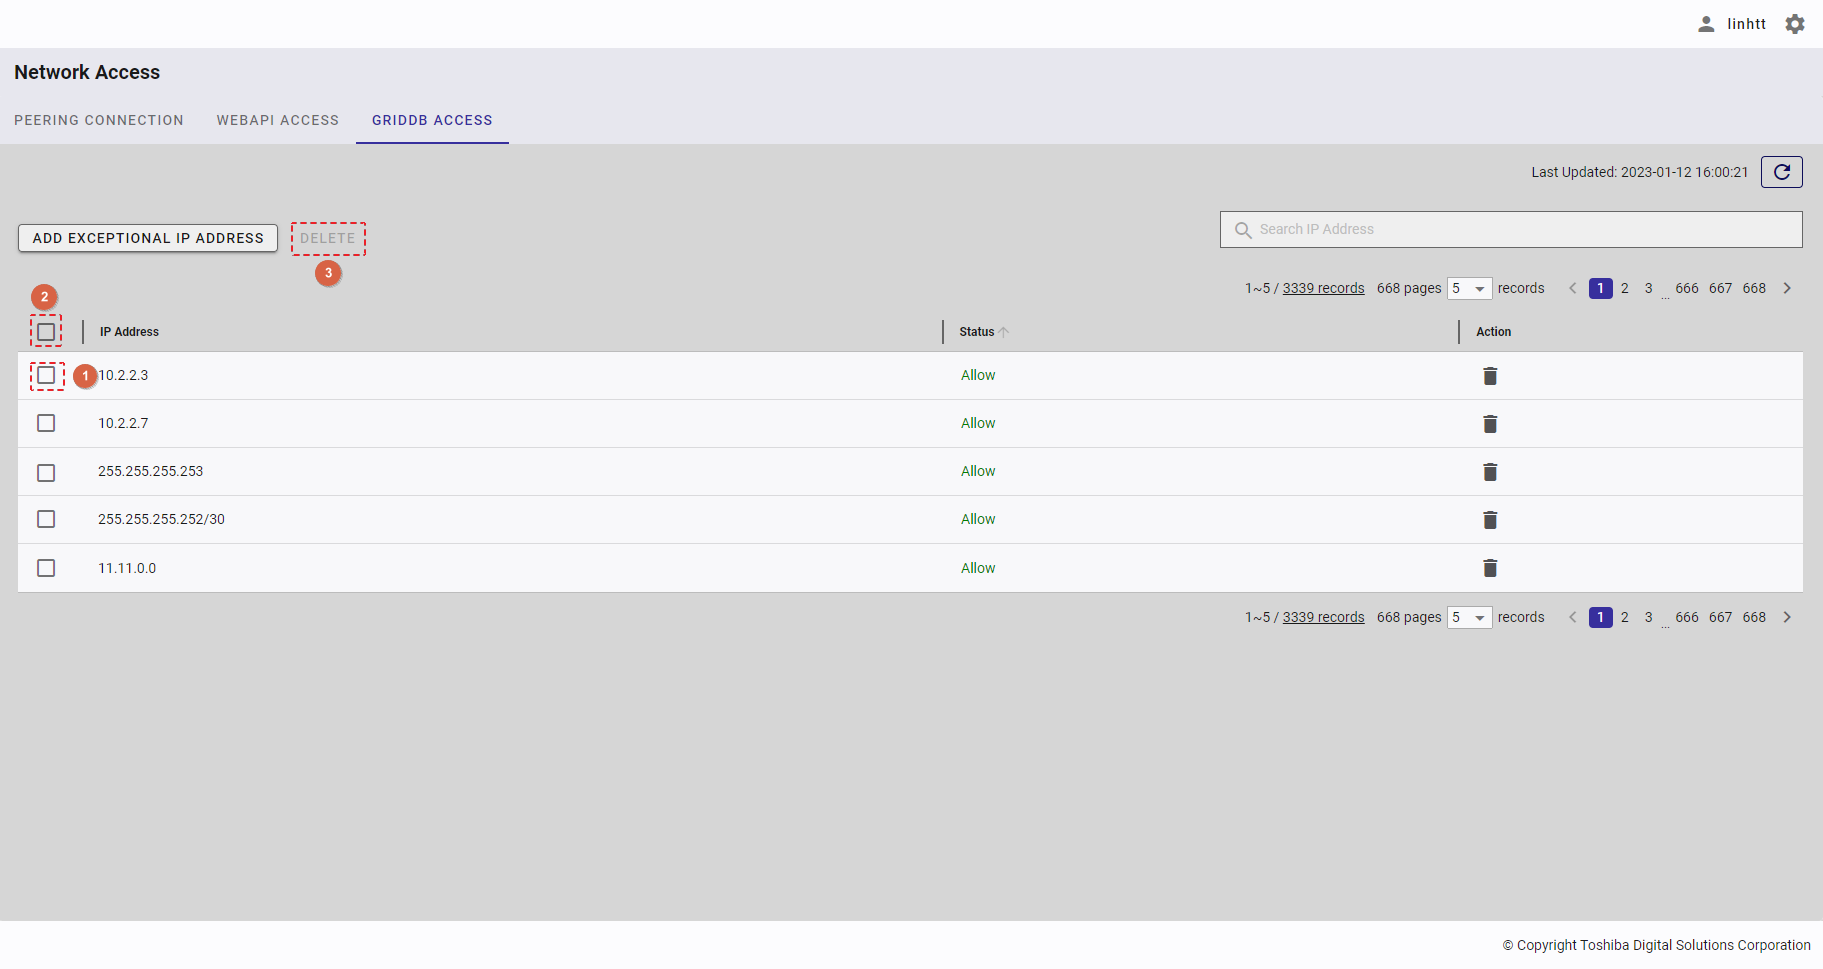
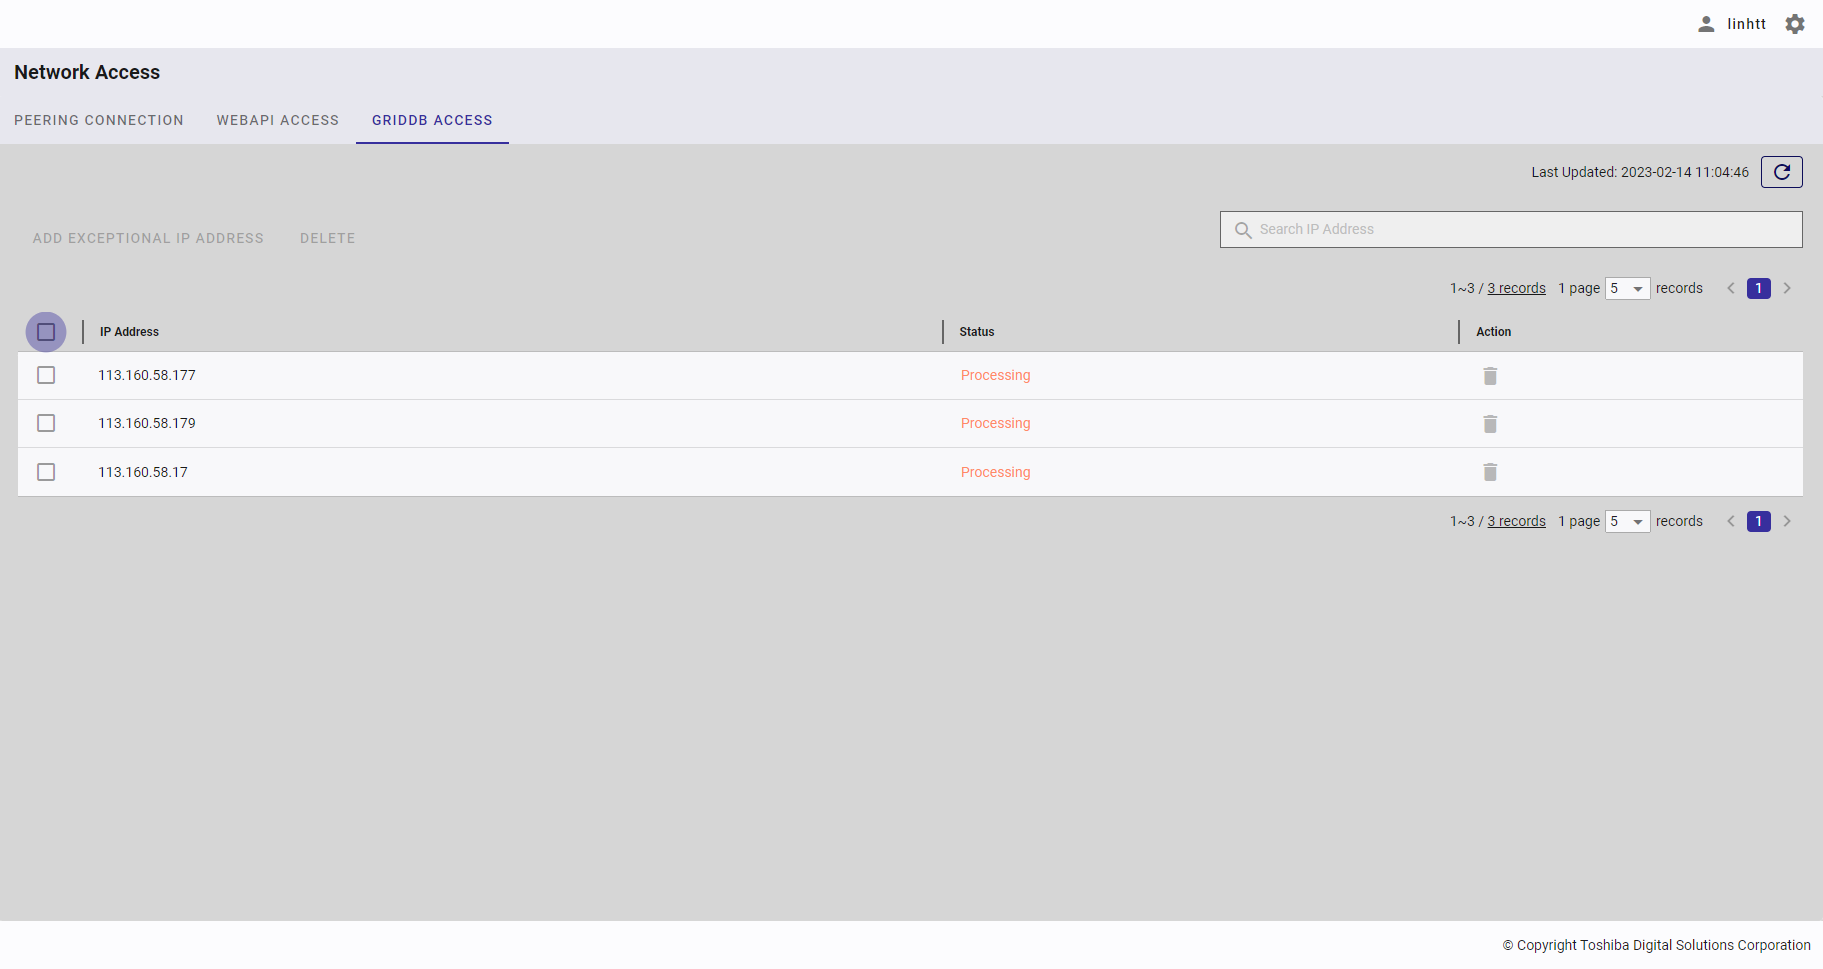
Step 2: Once the confirmation dialog is displayed, click the [YES] button to continue to delete the IP addresses. Or click the [NO] button to go back to the IP addresses screen without deleting any IP addresses.
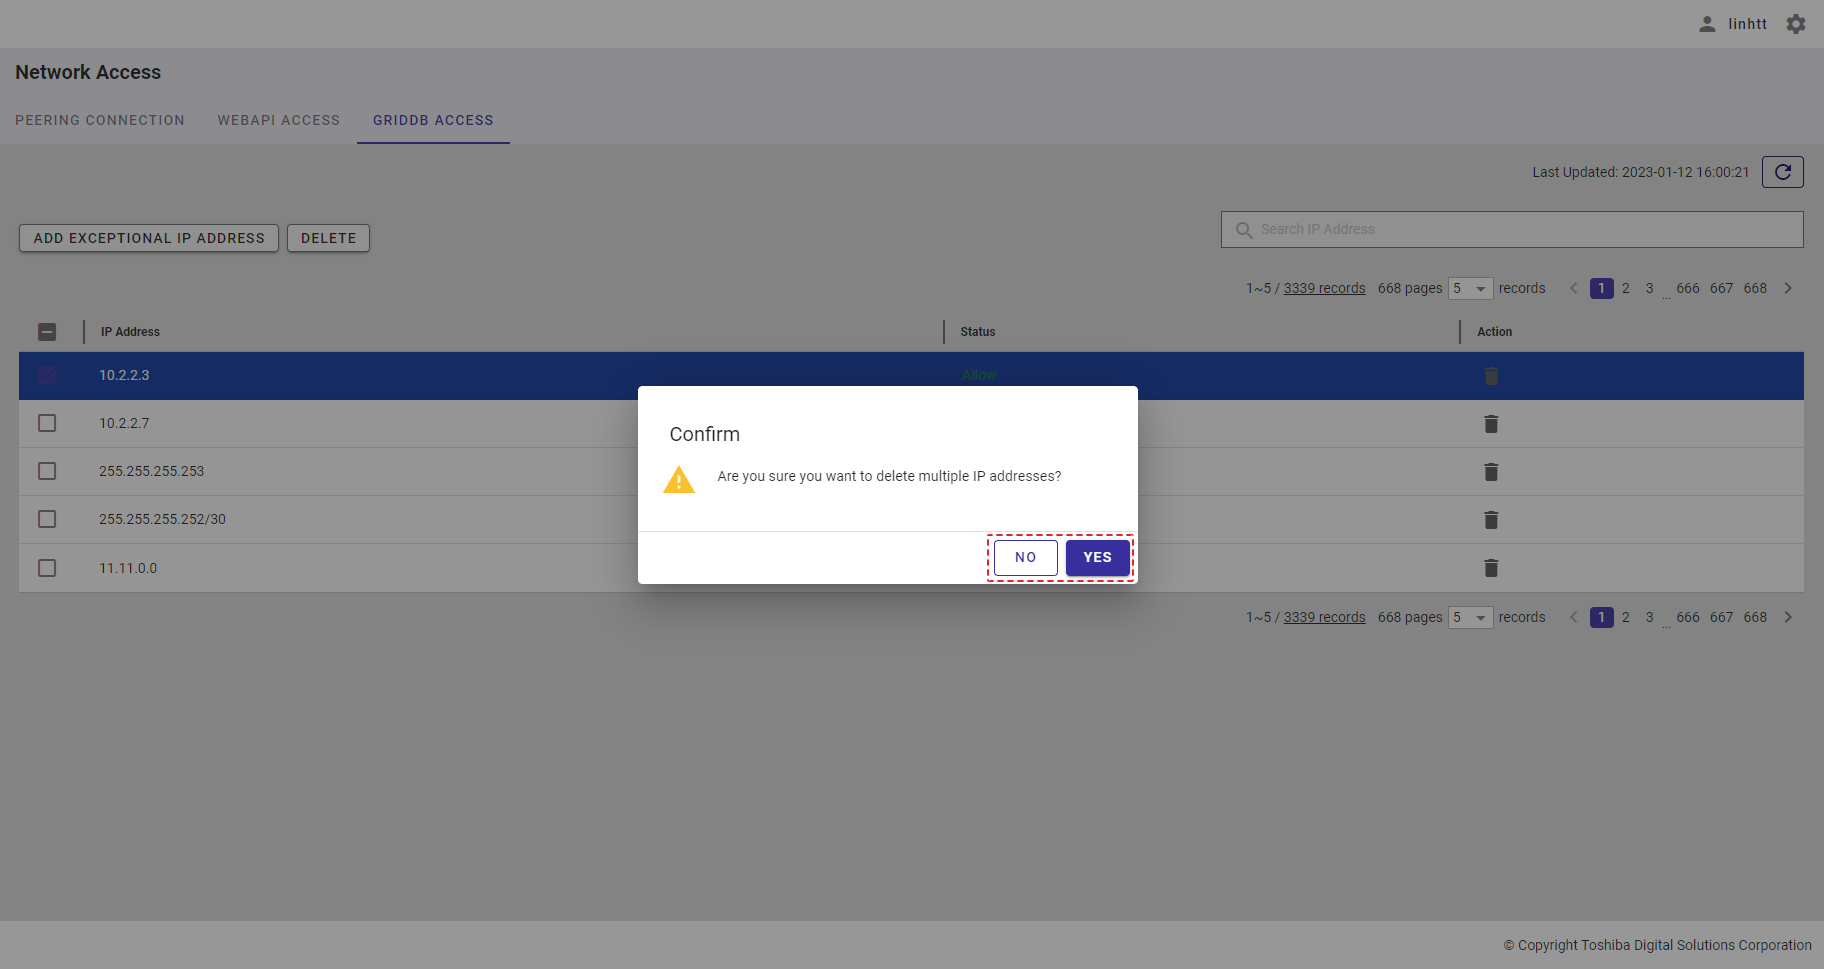
When the IP addresses are successfully deleted, the system will go back to the IP address list screen where the status of all IP addresses turns to [Processing]. After a few minutes, when the processing is completed, the deleted IP addresses are not found on the IP address list screen, and the status of all other IP addresses turns to [Allow].
4.21 Backup function
4.21.1 Available roles
The backup function is a paid feature. You need to sign up to use it. In the table below, the role with a plus sign (+) can use the function on the left.
| No. | Function | General user | Administrator user |
|---|---|---|---|
| 1 | Display backup schedules and a backup list | - | + |
| 2 | Change backup schedules | - | + |
| 3 | Turn on/off automatic log backup | - | + |
| 4 | Restore data from a backup | - | + |
4.21.2 Displaying backup schedules and a backup list
Backup schedules show the time when the system backs data up.
Log in to the system and then click the item [Backup] (①) in the left menu to access the Backup screen, which displays backup schedules on the top and a backup list on the bottom.
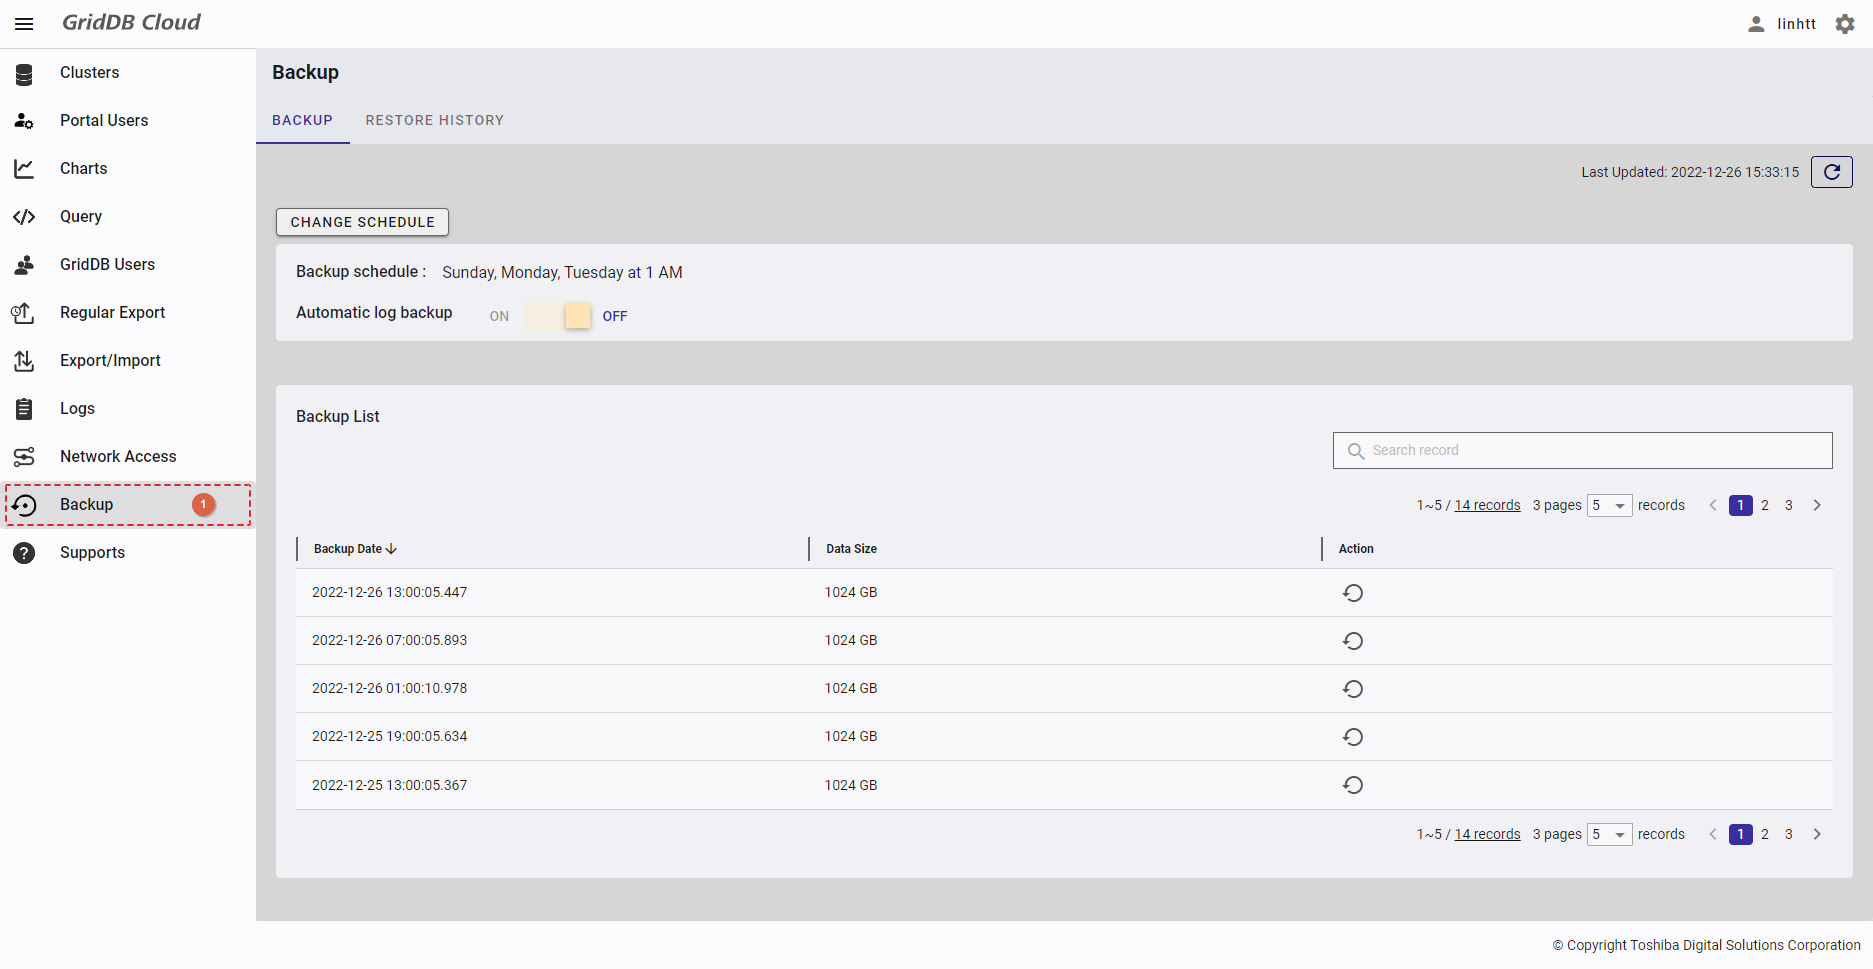
- You can choose the number of backups displayed on one page by selecting the number from [5, 10, 15, All] (④) at the top or bottom of the page. Click the [Next] button (⑤) or the [Back] button (⑥), or click the page number (⑧) to view another page.
- To search for a specific backup, enter its name in the search bar (③).
- To refresh a backup list and get the latest information about the list, click the [Refresh] button (②) on the top of the right panel.
- You can order the backup list by backup date or by data size by clicking the header (⑦) of each column.
- You can adjust the column size by dragging and dropping the vertical bar "|" on the header.
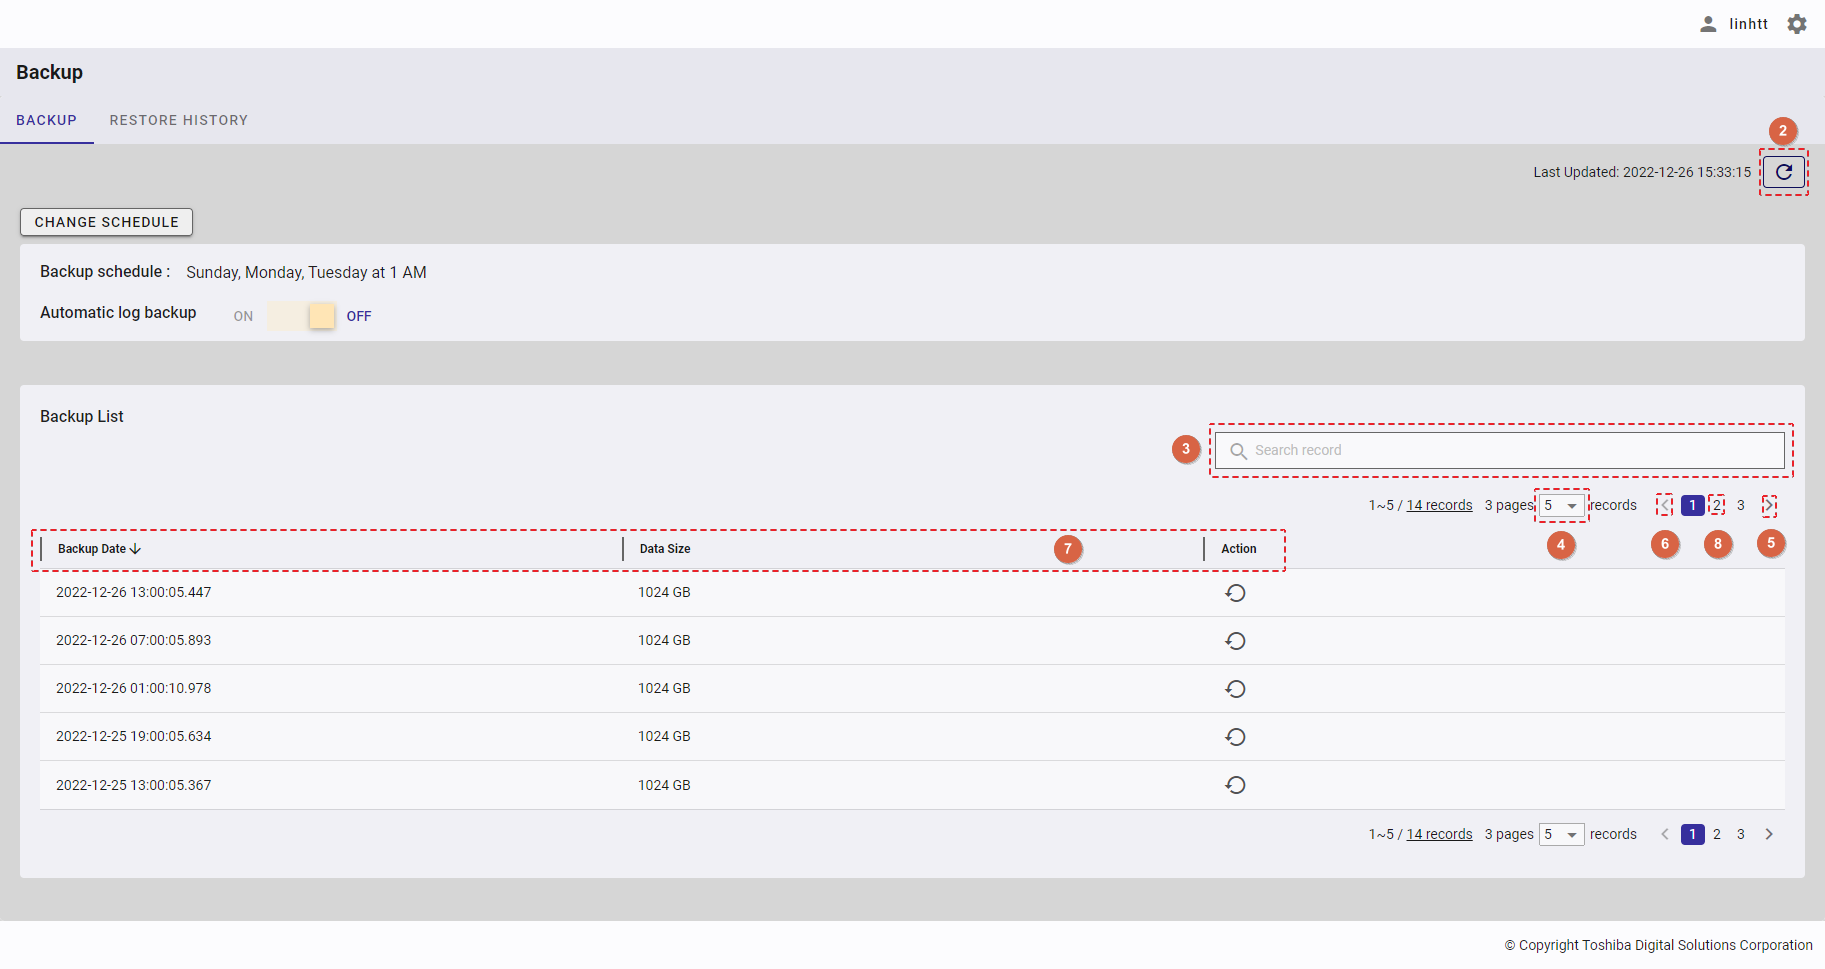
4.21.3 Changing backup schedules
The following two scheduling types are supported:
- Time interval type
- Fixed time type
The time interval type is used to specify the interval such as every six hours and run regular backups; the fixed time type is used to specify the day of the week and time and run backups at the time specified. The following are the procedures for each type.
4.21.3.1 Changing backup schedules by specifying the time interval
Step 1: Click the [CHANGE SCHEDULE] button.
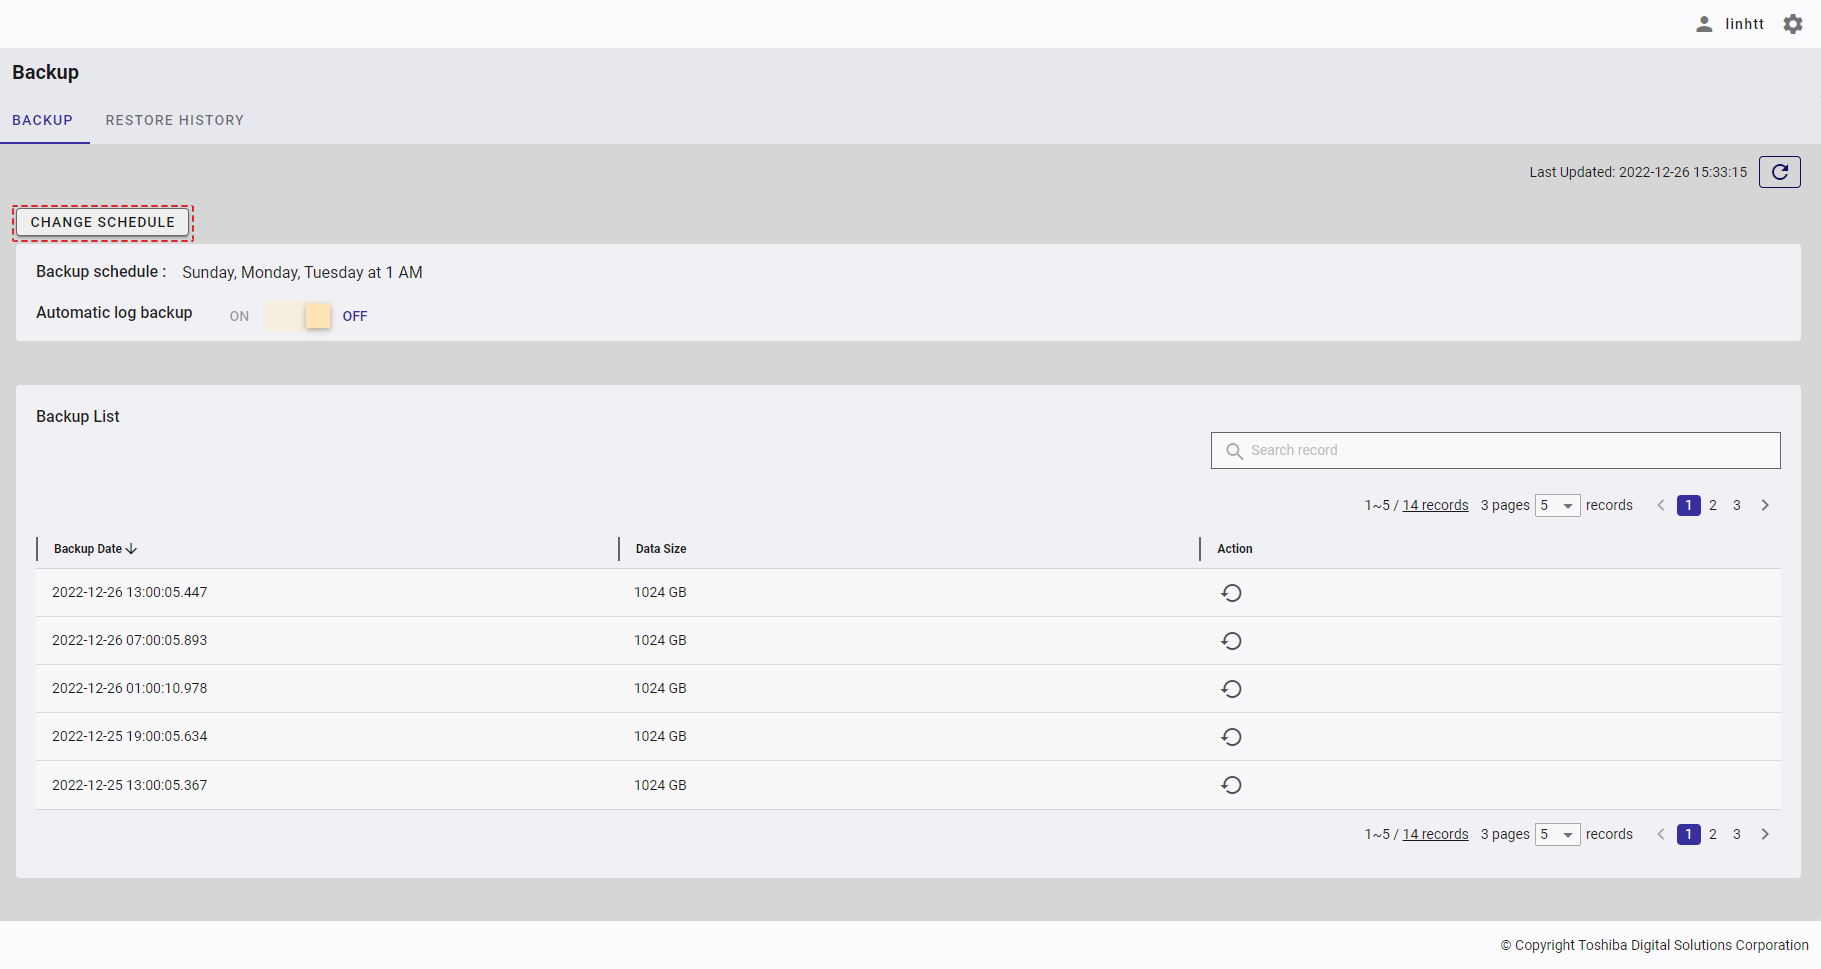
Step 2: Click the [Time interval for backup] radio button (①). From the [Interval] drop-down list (②), select the interval.
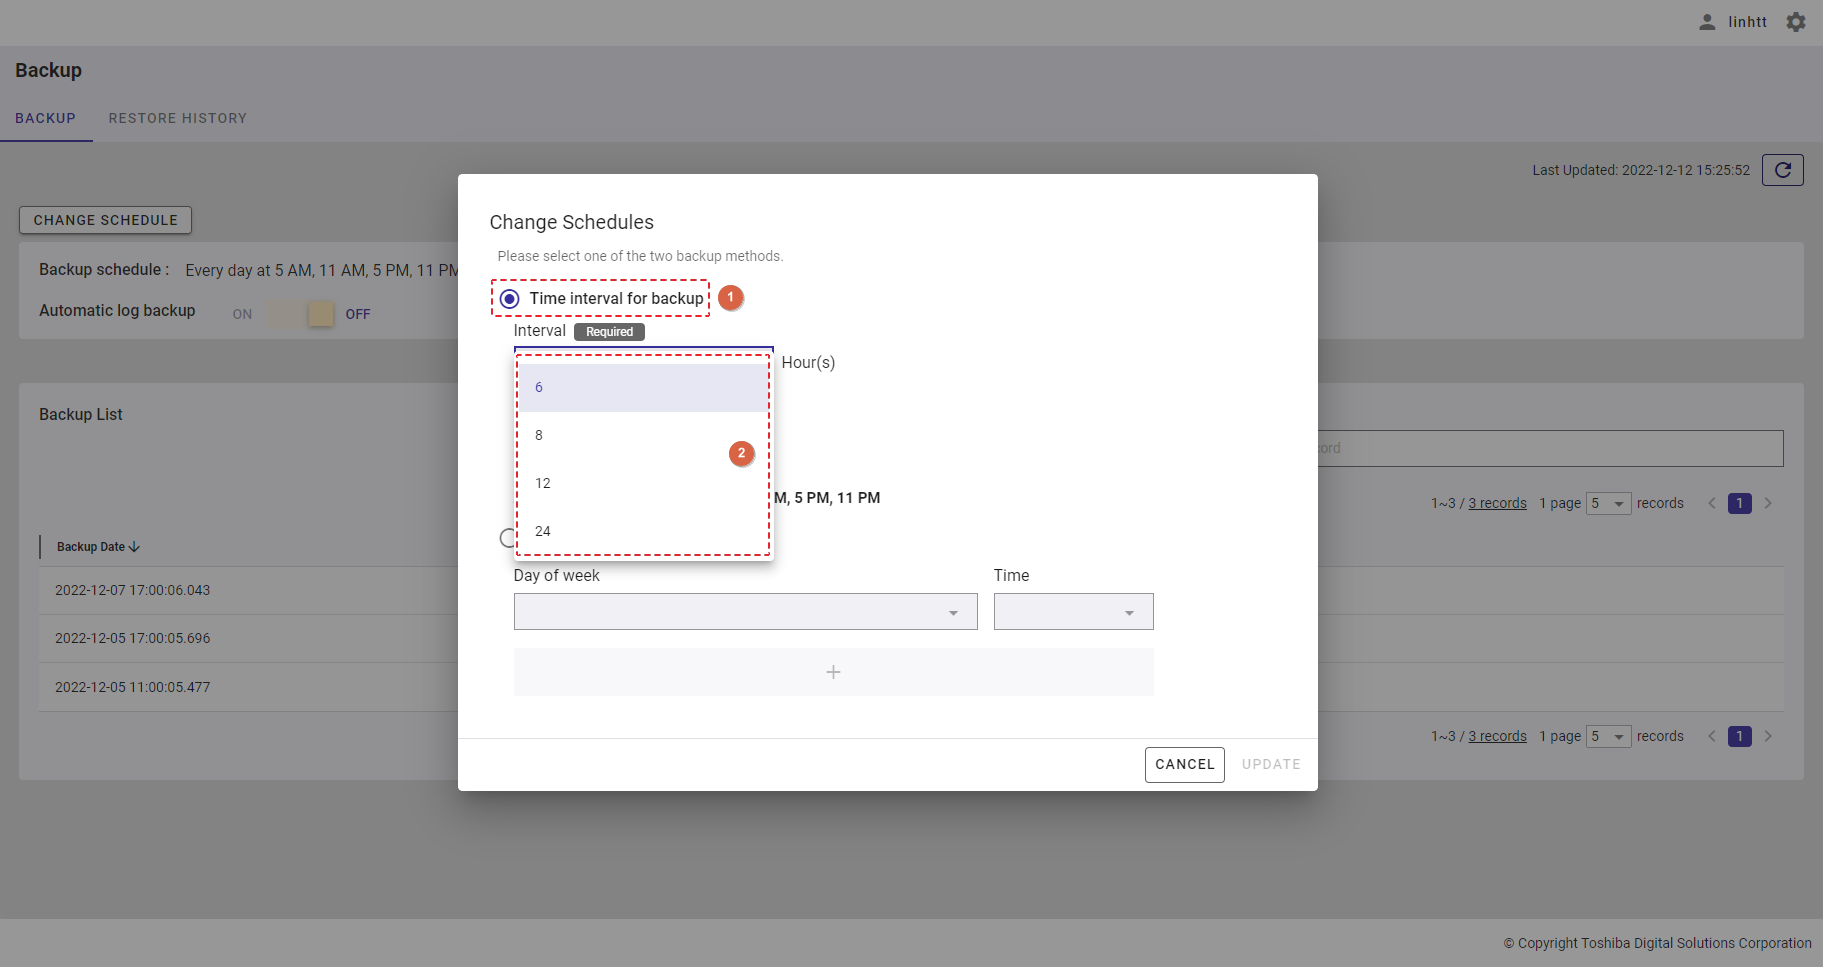
Step 3: Select the time to start a backup from the [Start time] drop-down list (③), which is enabled only after the interval is selected.
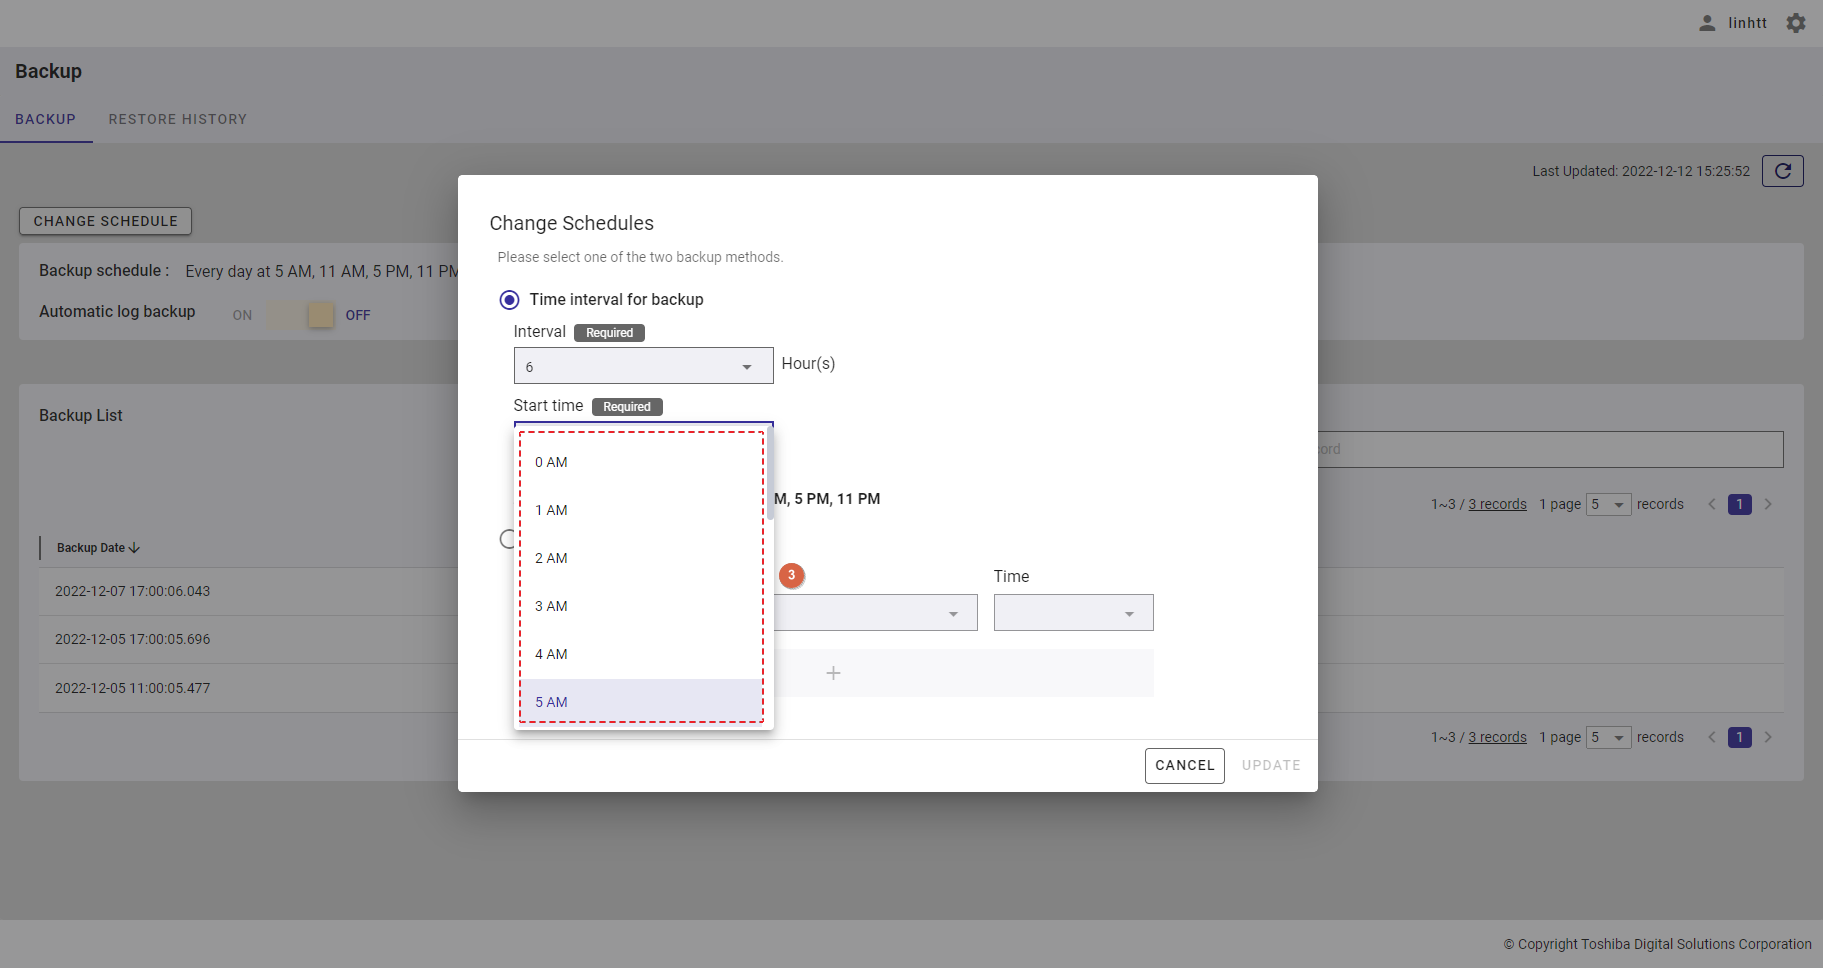
When the two steps are completed successfully, the updated backup schedules (④) will be automatically displayed.
[Note]: There is a possibility that a backup starts before the specified time. For example, if you specify 6 hours as the interval and 10 AM as the start time at 3 AM, the backup will start at 4 AM.
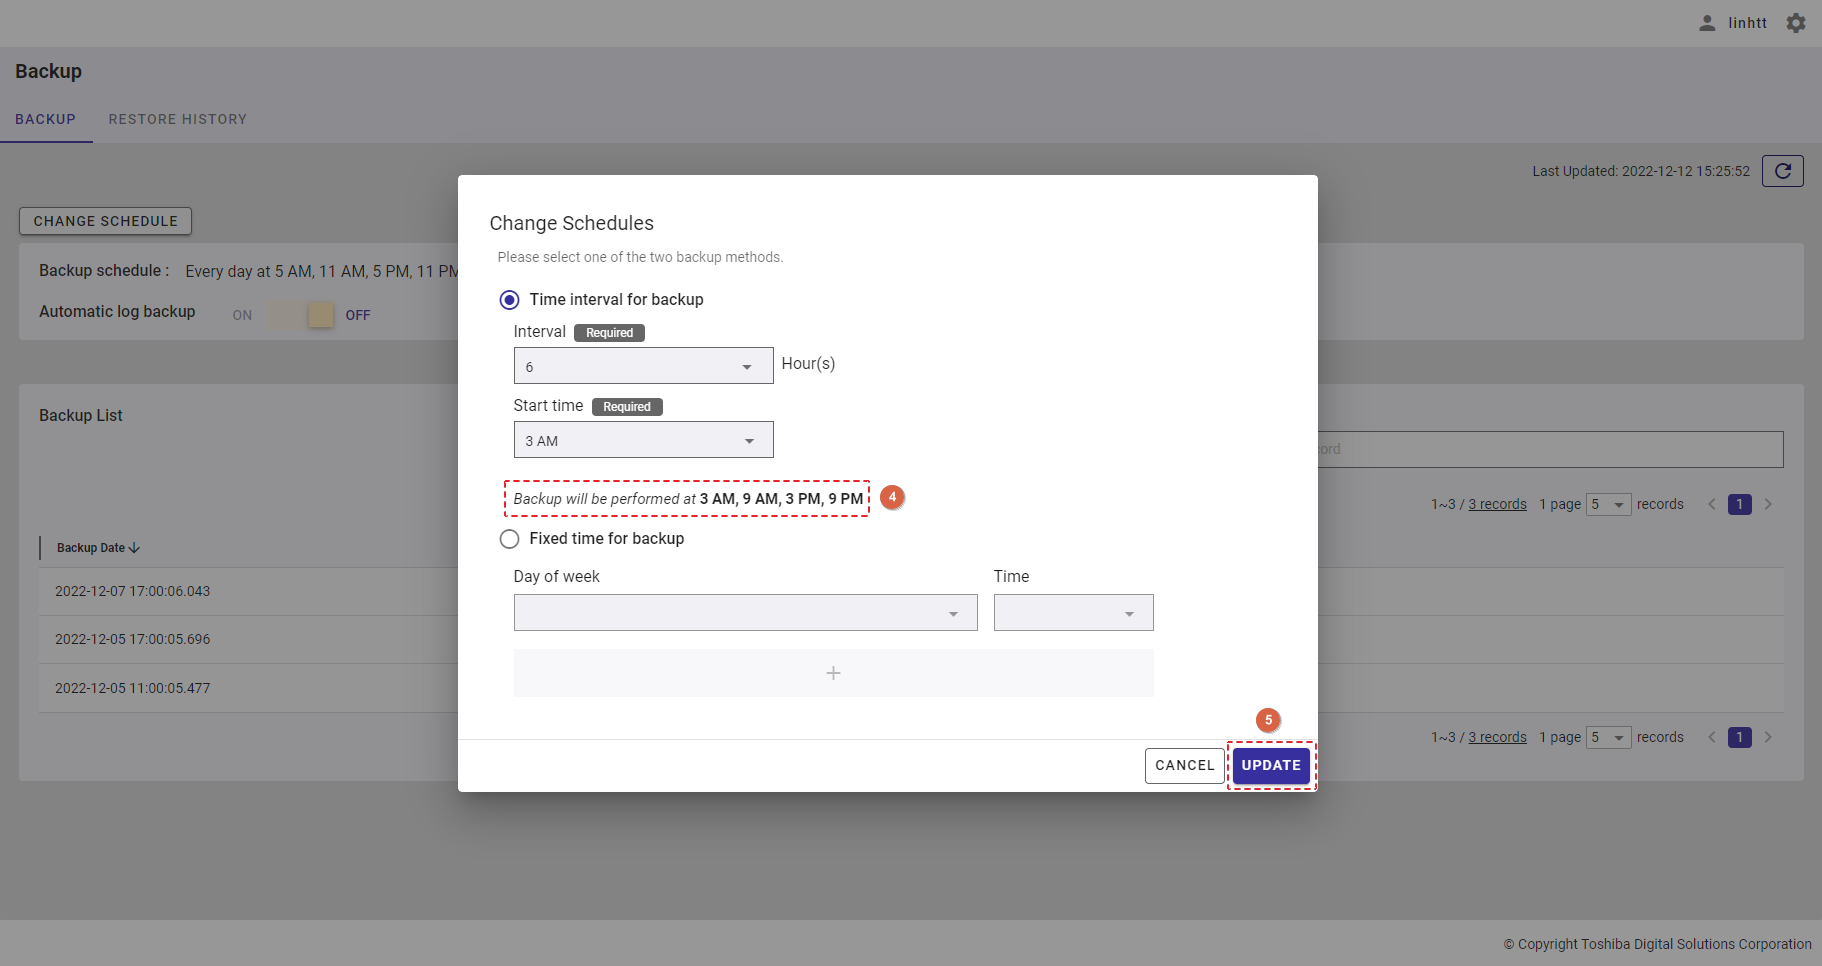
Step 4: Click the [UPDATE] button (⑤) to change the schedules. Or click the [CANCEL] button to close the Change Schedule dialog.
4.21.3.2 Changing backup schedules by specifying a fixed time
Step 1: Click the [CHANGE SCHEDULE] button.
Step 2: Click the [Fixed time for backup] radio button (①). From the [Day of week] drop-down list (②), select one or more days of the week.
To save all your choices, click the [APPLY] button (③). You can also discard them by clicking the [CANCEL] button (④).
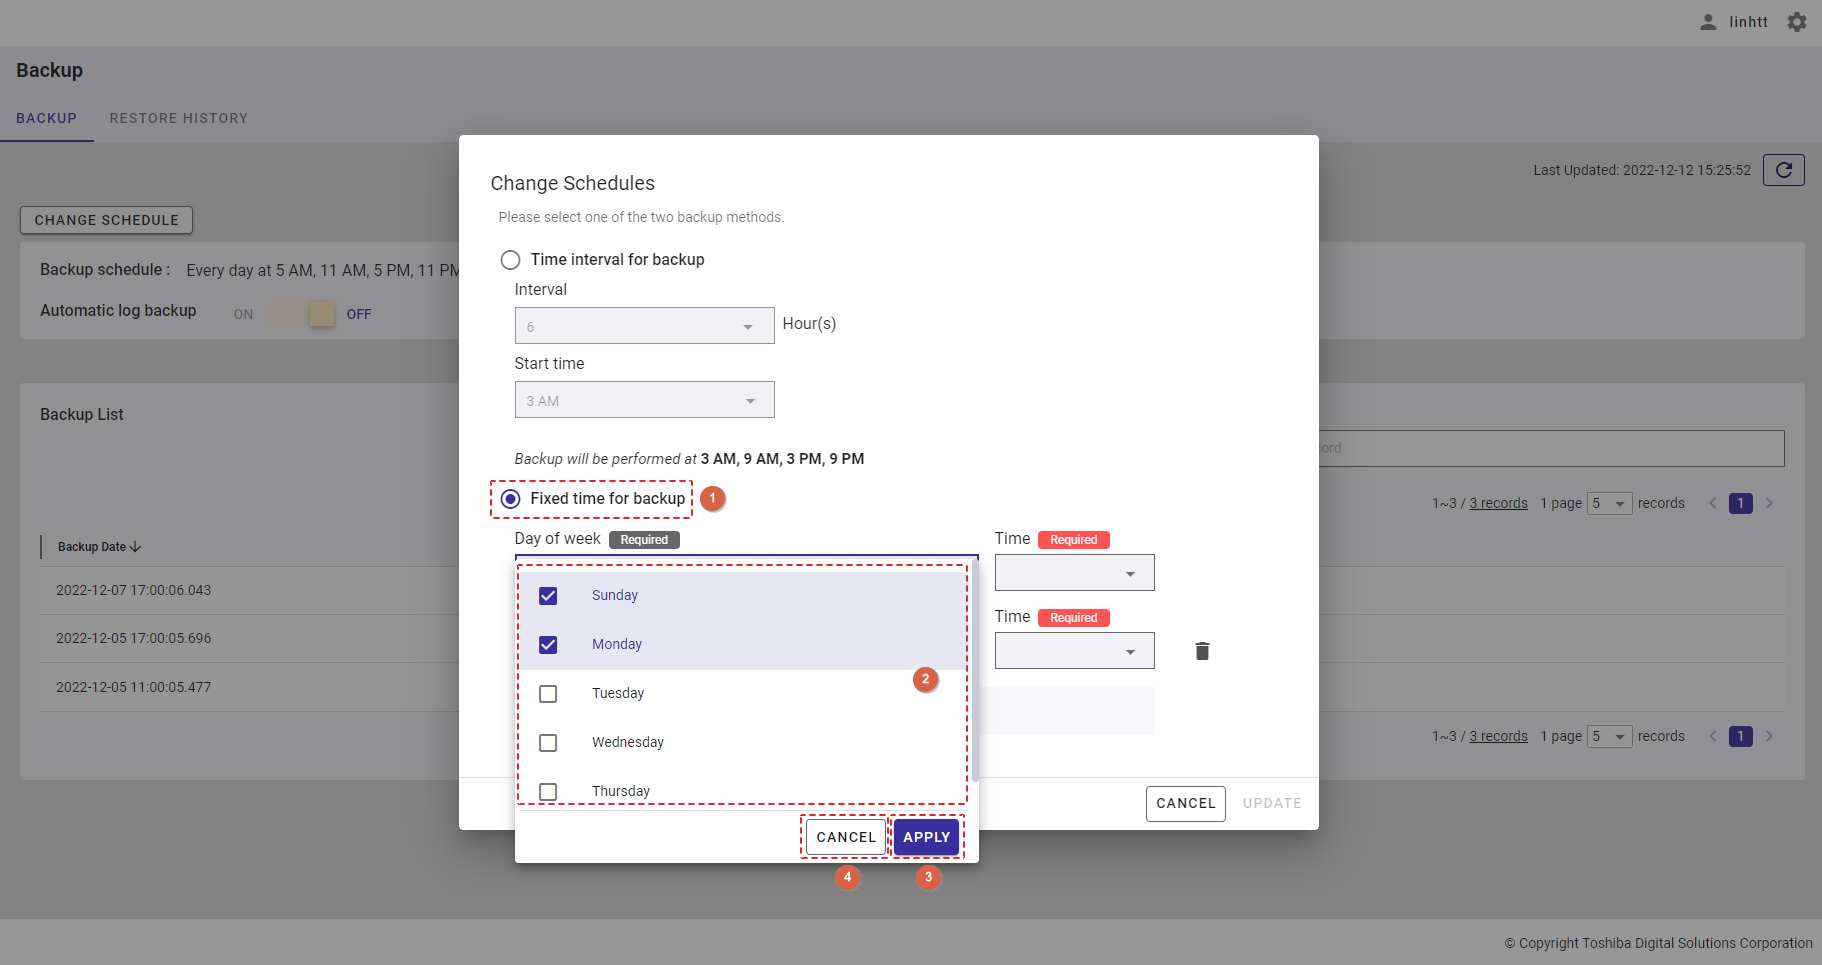
Step 3: Select a fixed time from the [Time] drop-down list (③).
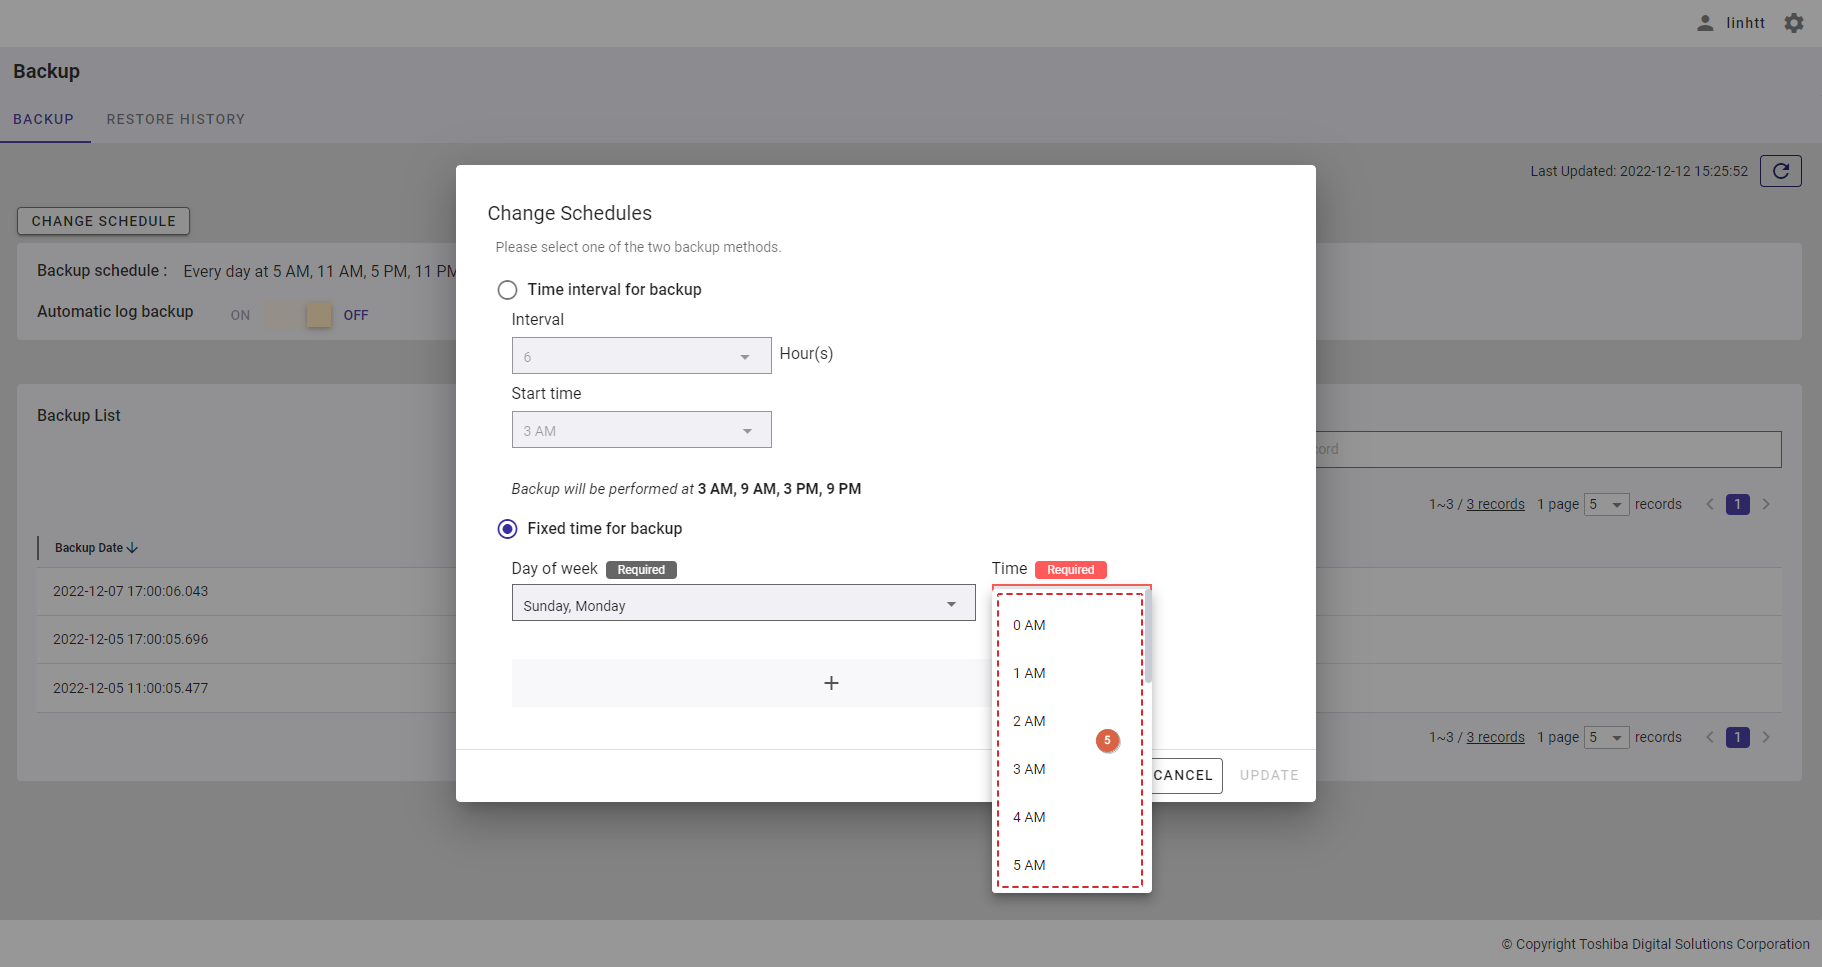
Step 4: (optional) To add a fixed time for backup, click the [Add] button (④); click the [Delete] button (⑤) to delete it.
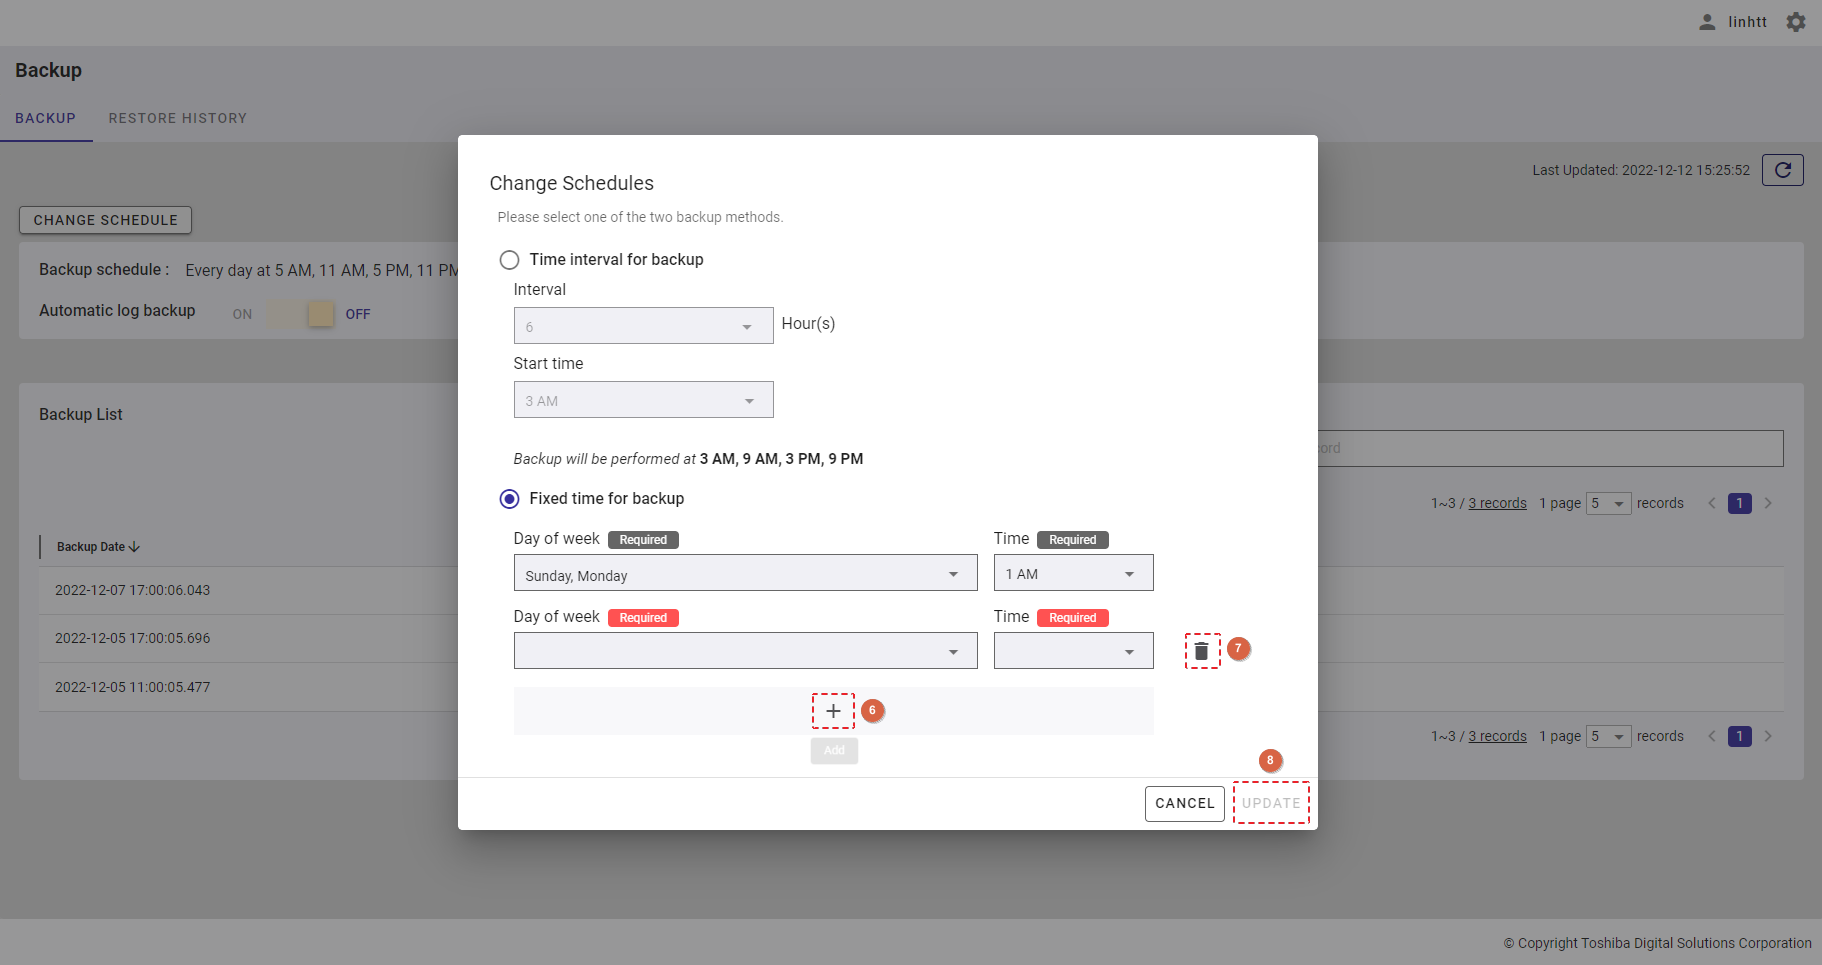
Step 5: Click the [UPDATE] button (⑥) to change the backup schedules, or click the [CANCEL] button to cancel them.
4.21.4 Turning on/off automatic log backup
When automatic log backup is turned on, transaction logs are duplicated and transferred to dedicated backup storages that are prepared separately from data storages. This allows users to restore data to the latest point in case of data loss due to storage failure. All they users need to do is just configure data backup schedules and turn on this function. Our operators will restore data to the latest point using baseline backup data and log backup data in case of storage failure.
[Note]:
- GridDB replicates data and multiplexes them on multiple nodes. Therefore, when data loss occurs due to storage failure on a single node, data can be restored to the latest point even when automatic log backup is turned off. Please turn it on only when you want to restore data to the latest point even when data loss occurs due to storage failure on a majority of nodes.
- This function will degrade GridDB performance. The GridDB performance for data registration, for example, is degraded by approximately 5% in a test environment. Please be sure to verify the performance by experimenting with this function to determine whether you enable it or not because the impact on the performance depends on the use case.
- For more details of automatic log backup, refer to the section on the backup operations in the GridDB Features Reference.
Step 1: To turn automatic log backup on or off, click the [Automatic log backup] toggle-switch (①).
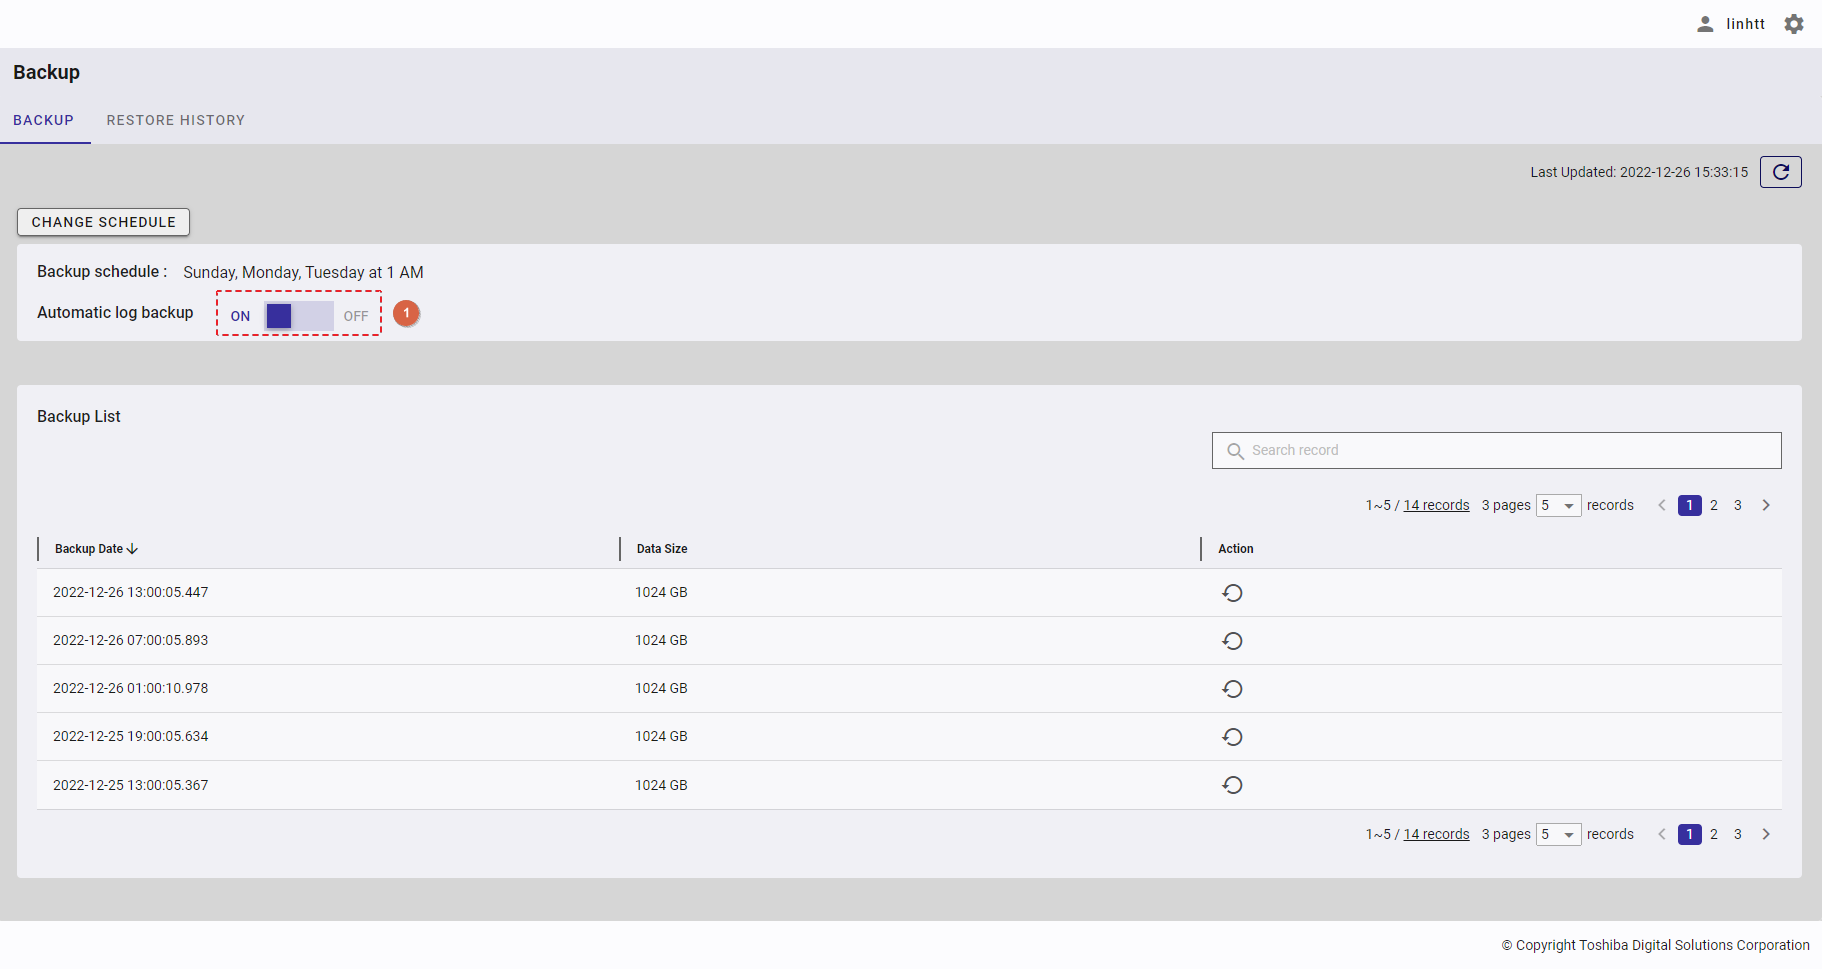
Step 2: A confirmation dialog will appear; click the [YES] button to change the status of automatic log backup. If you do not want to change it, click the [NO] button to close the dialog and return to the Backup screen.
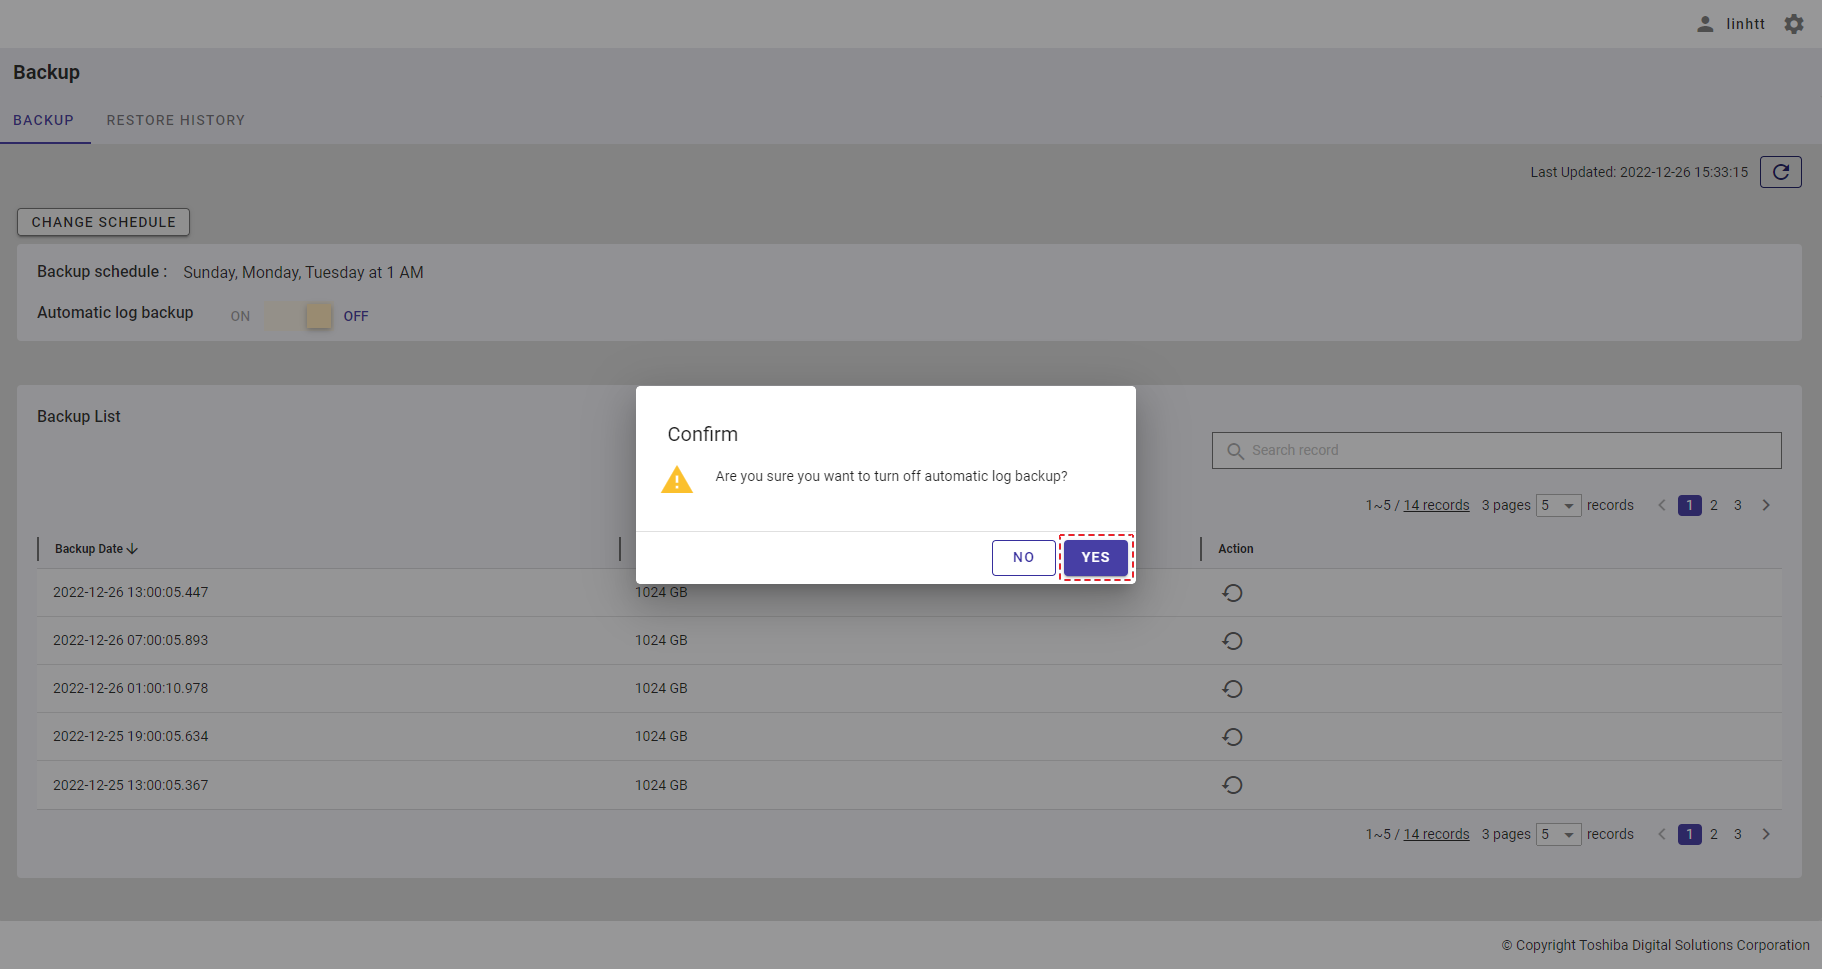
[Note]: If you do not sign up to use the backup function, the function to turn on/off automatic log backup is disabled.
4.21.5 Restoring data from a backup
The task to restore data from a backup is run in the background.
Step 1: To restore data from a backup, click the [Restore] button (①).
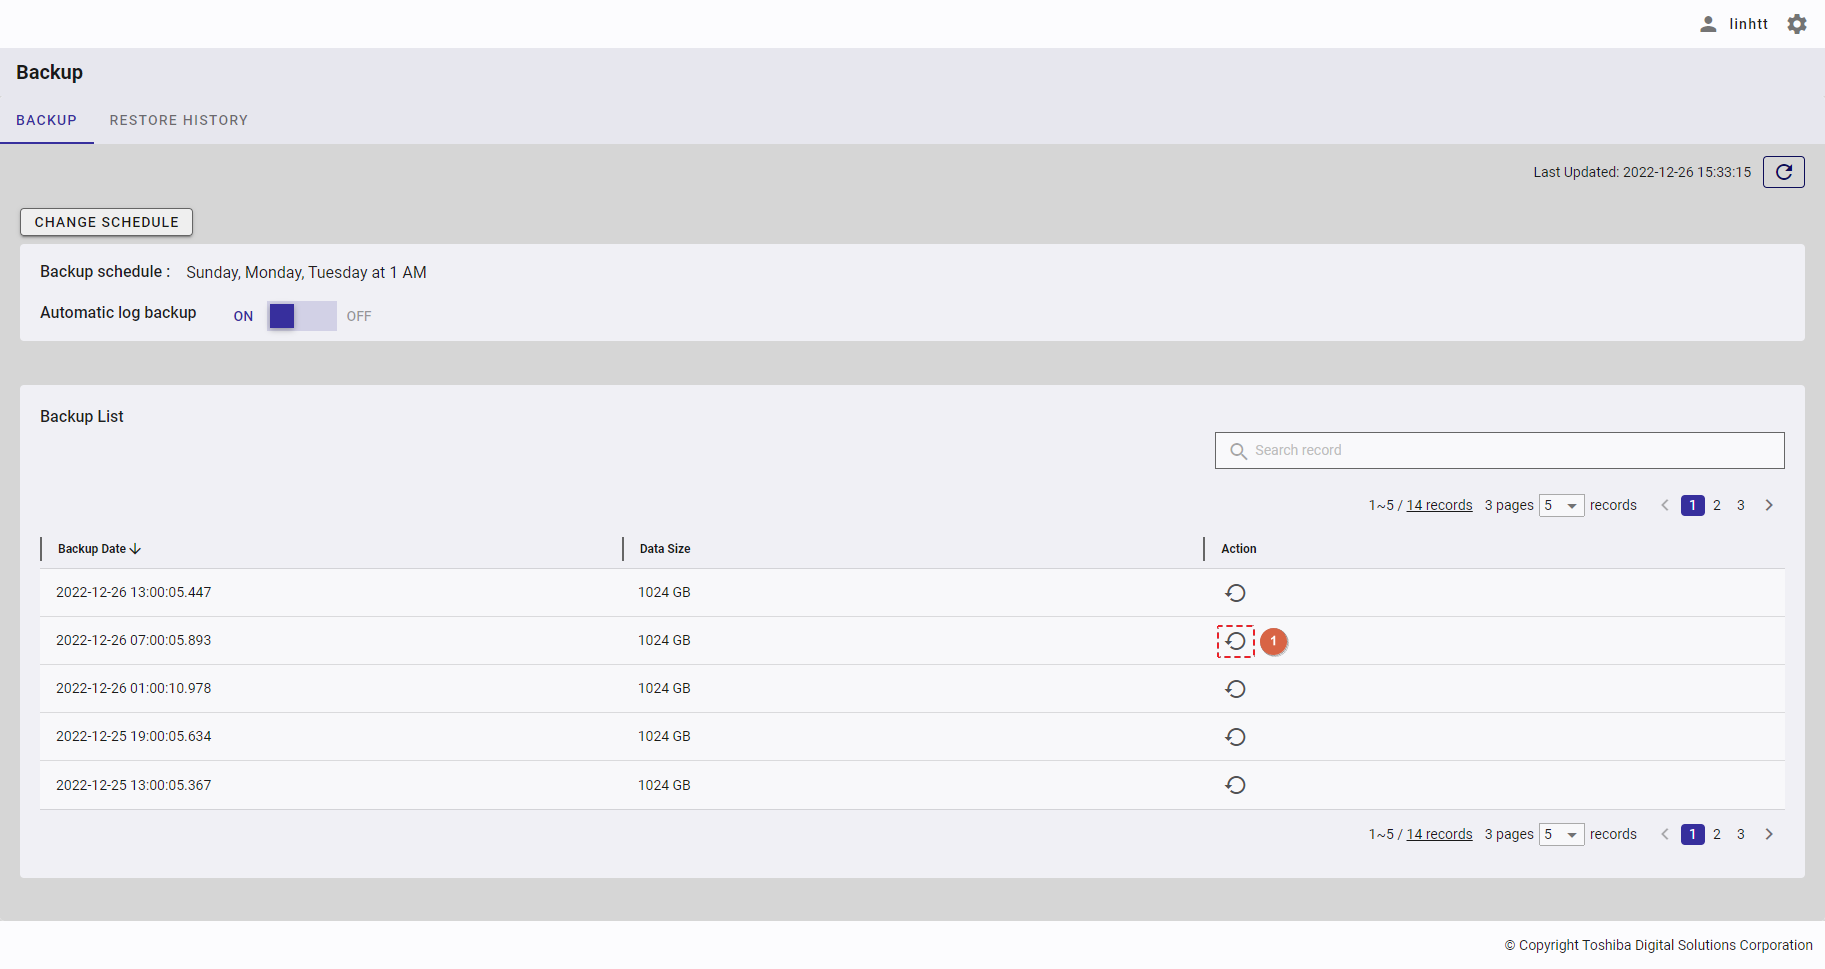
Click the [YES] button (②) to continue, or click the [NO] button to close the dialog.
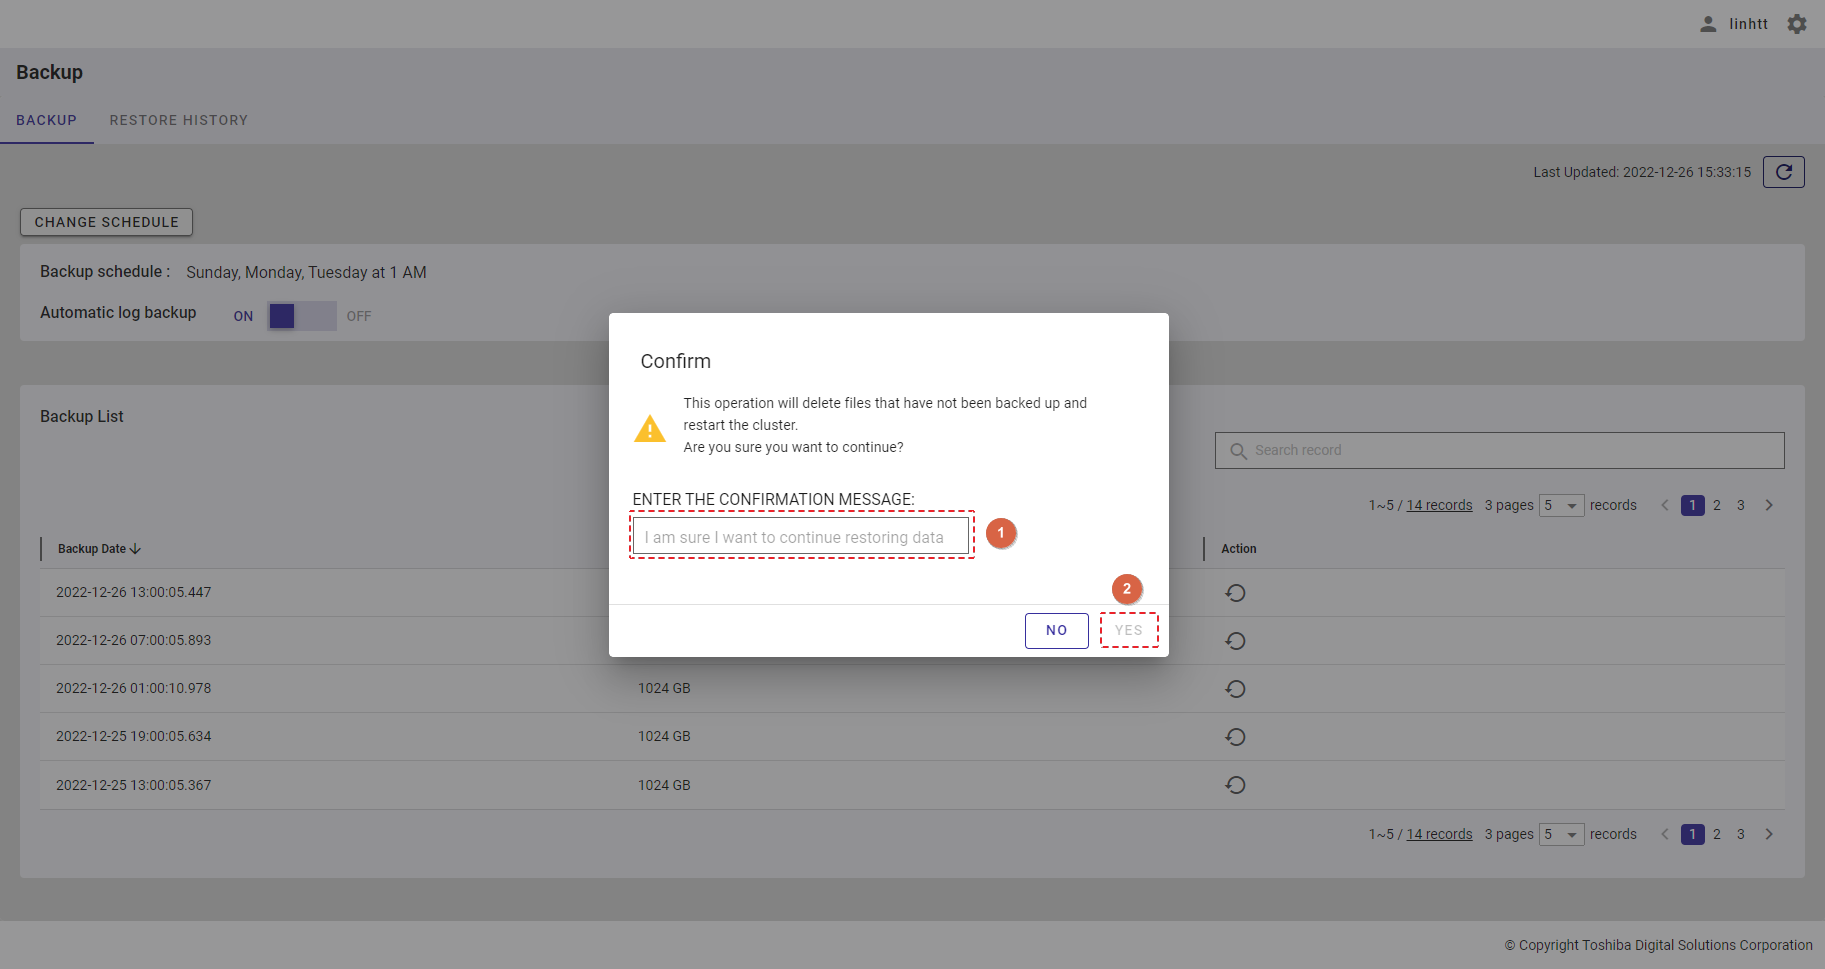
Notice the status of the restore process at the top of the RESTORE HISTORY table is updated. The status has three possible values: Success, Failed, or Recovering.
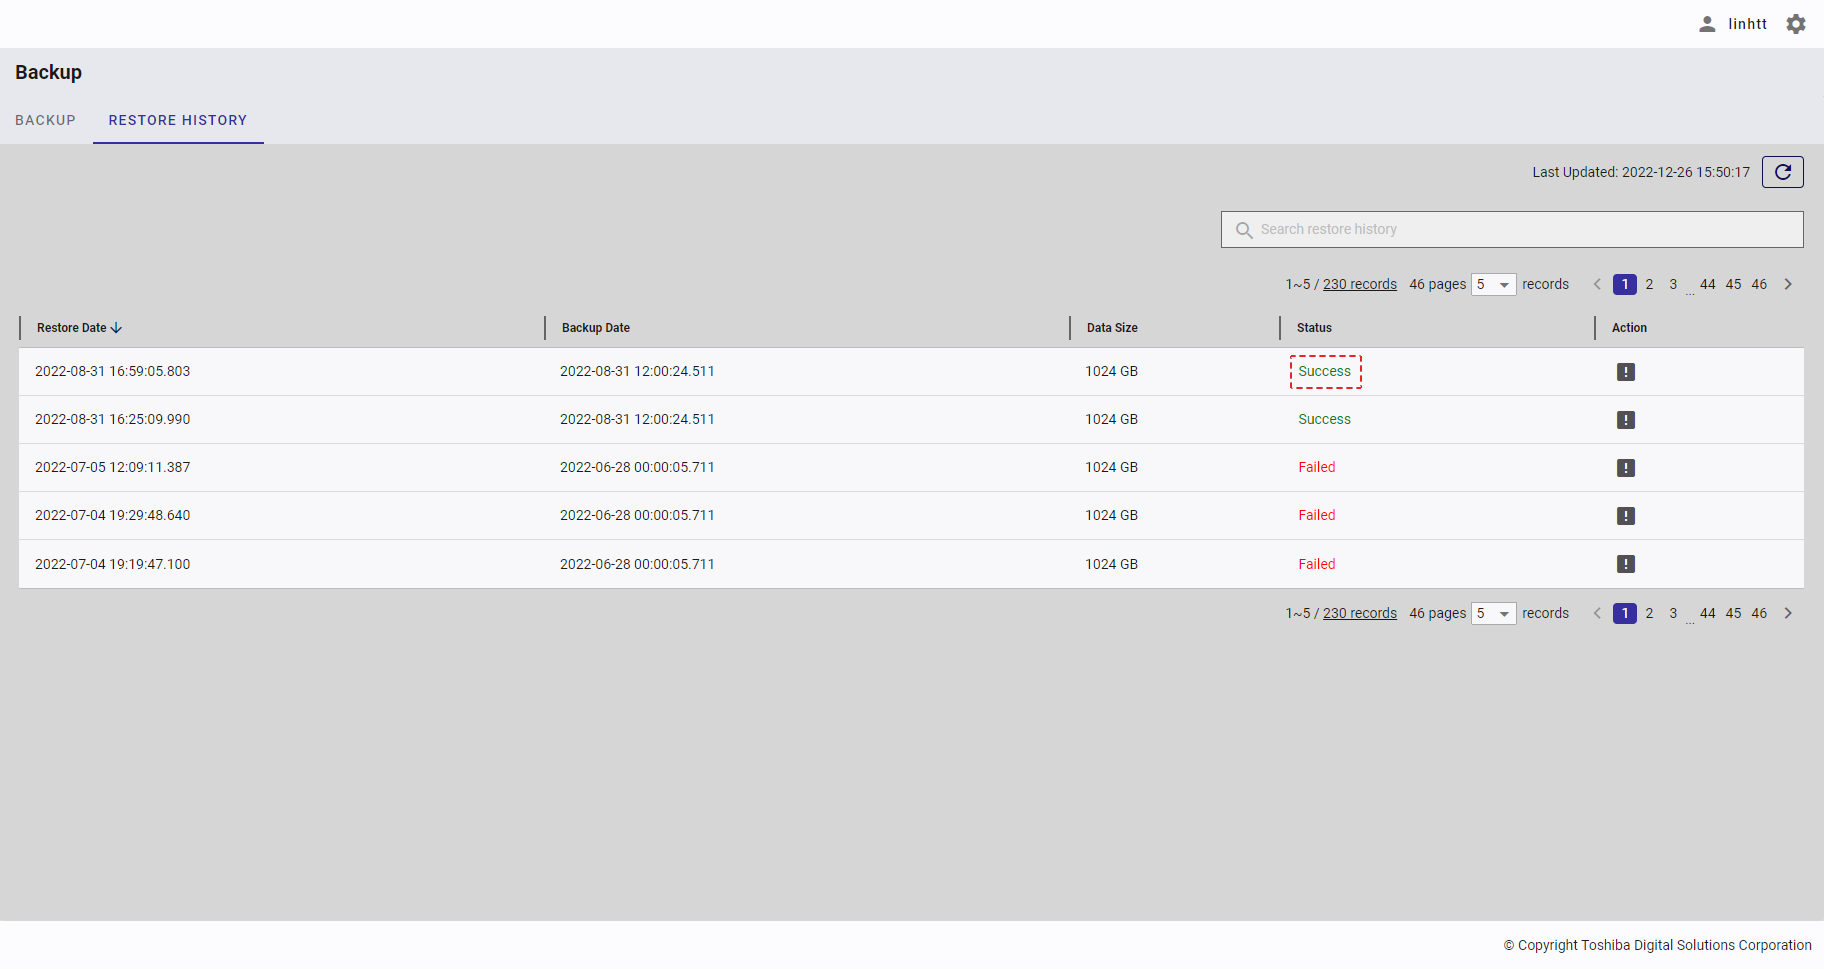
4.22 Restore history function
4.22.1 Available roles
In the table below, the role with a plus sign (+) can use the function on the left.
| No. | Function | General user | Administrator user |
|---|---|---|---|
| 1 | Display a restore history | - | + |
| 2 | View the restore results | - | + |
4.22.2 Displaying a restore history
To access the Restore History list screen, log in to the system and click the item [Backup] (①) in the left menu and then the [RESTORE HISTORY] tab at the top of the screen.
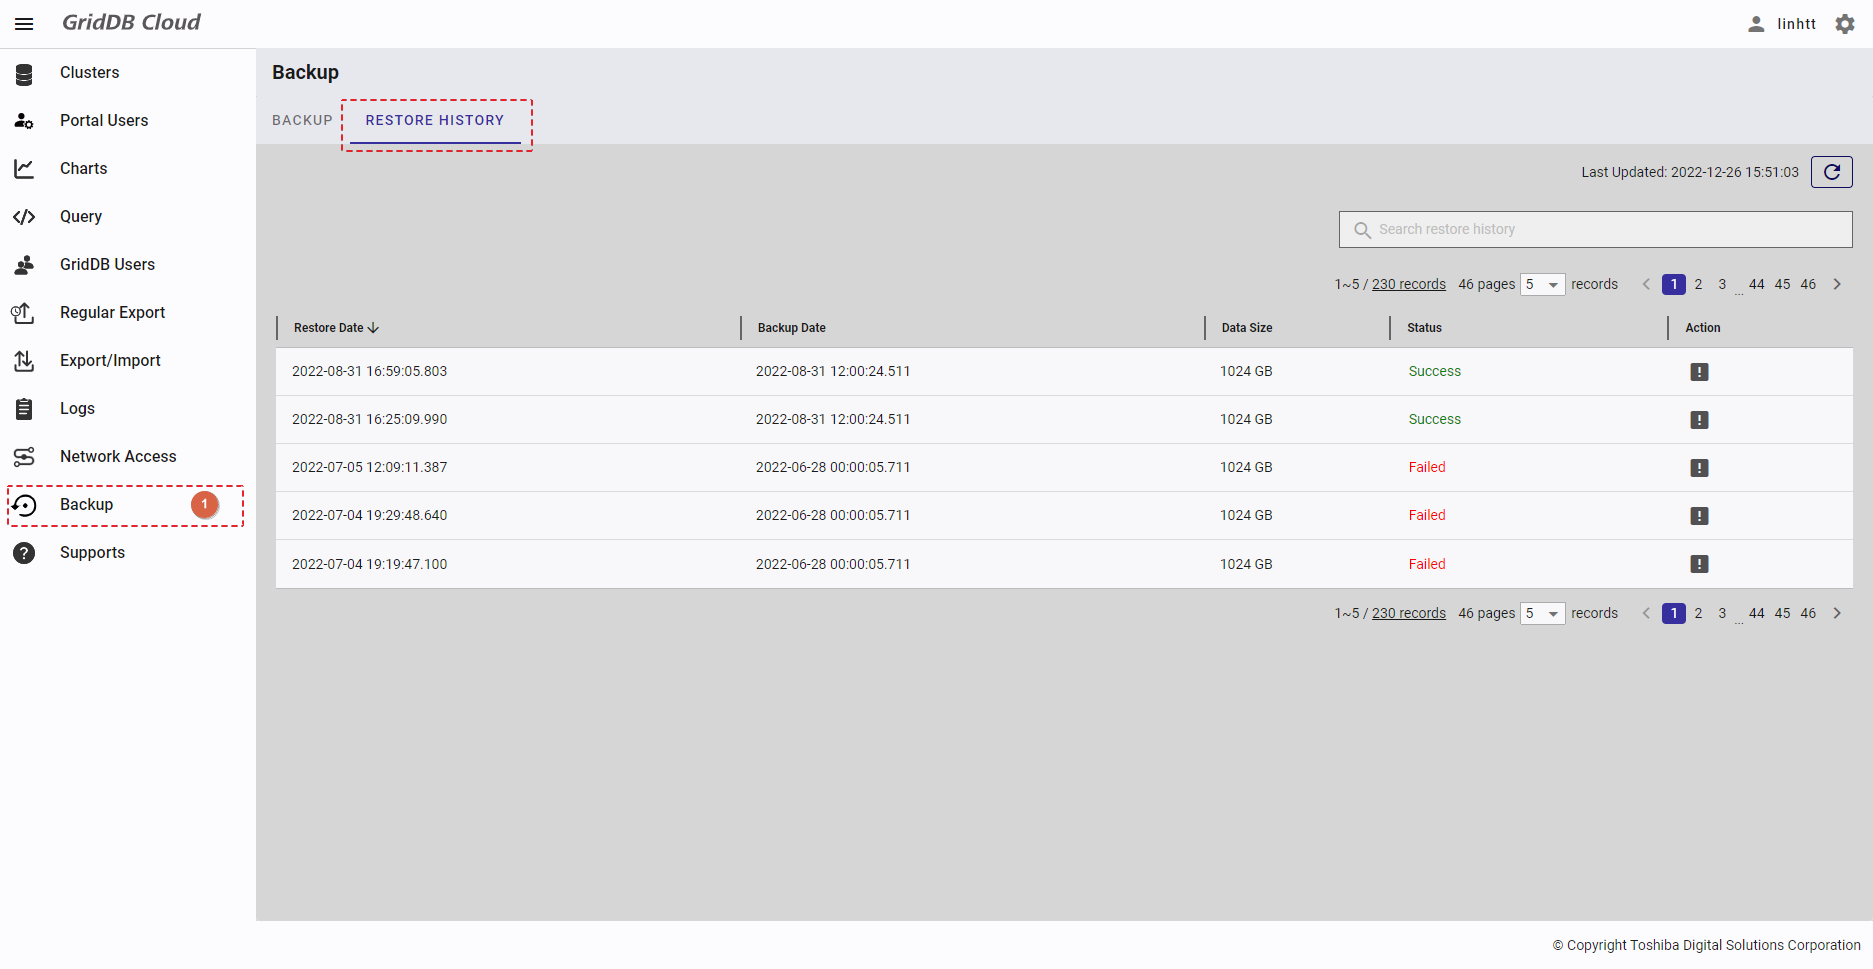
- You can choose the number of restore history records displayed on one page by selecting the number from [5, 10, 15, All] (④) at the top or bottom of the page. Click the [Next] button (⑤) or the [Back] button (⑥), or click the page number (⑧) to view another page.
- To search for a specific restore history record, enter the name of the restore history record in the search bar (③).
- To refresh the restore history list and get the latest information about the list, click the [Refresh] button (②) on the top of the right panel.
- You can order the restore history list by restore date, by backup date, by data size, or by status, by clicking the header (⑦) of each column.
- The status has three possible values: Success, Failed, or Recovering.
- You can adjust the column size by dragging and dropping the vertical bar "|" on the header.
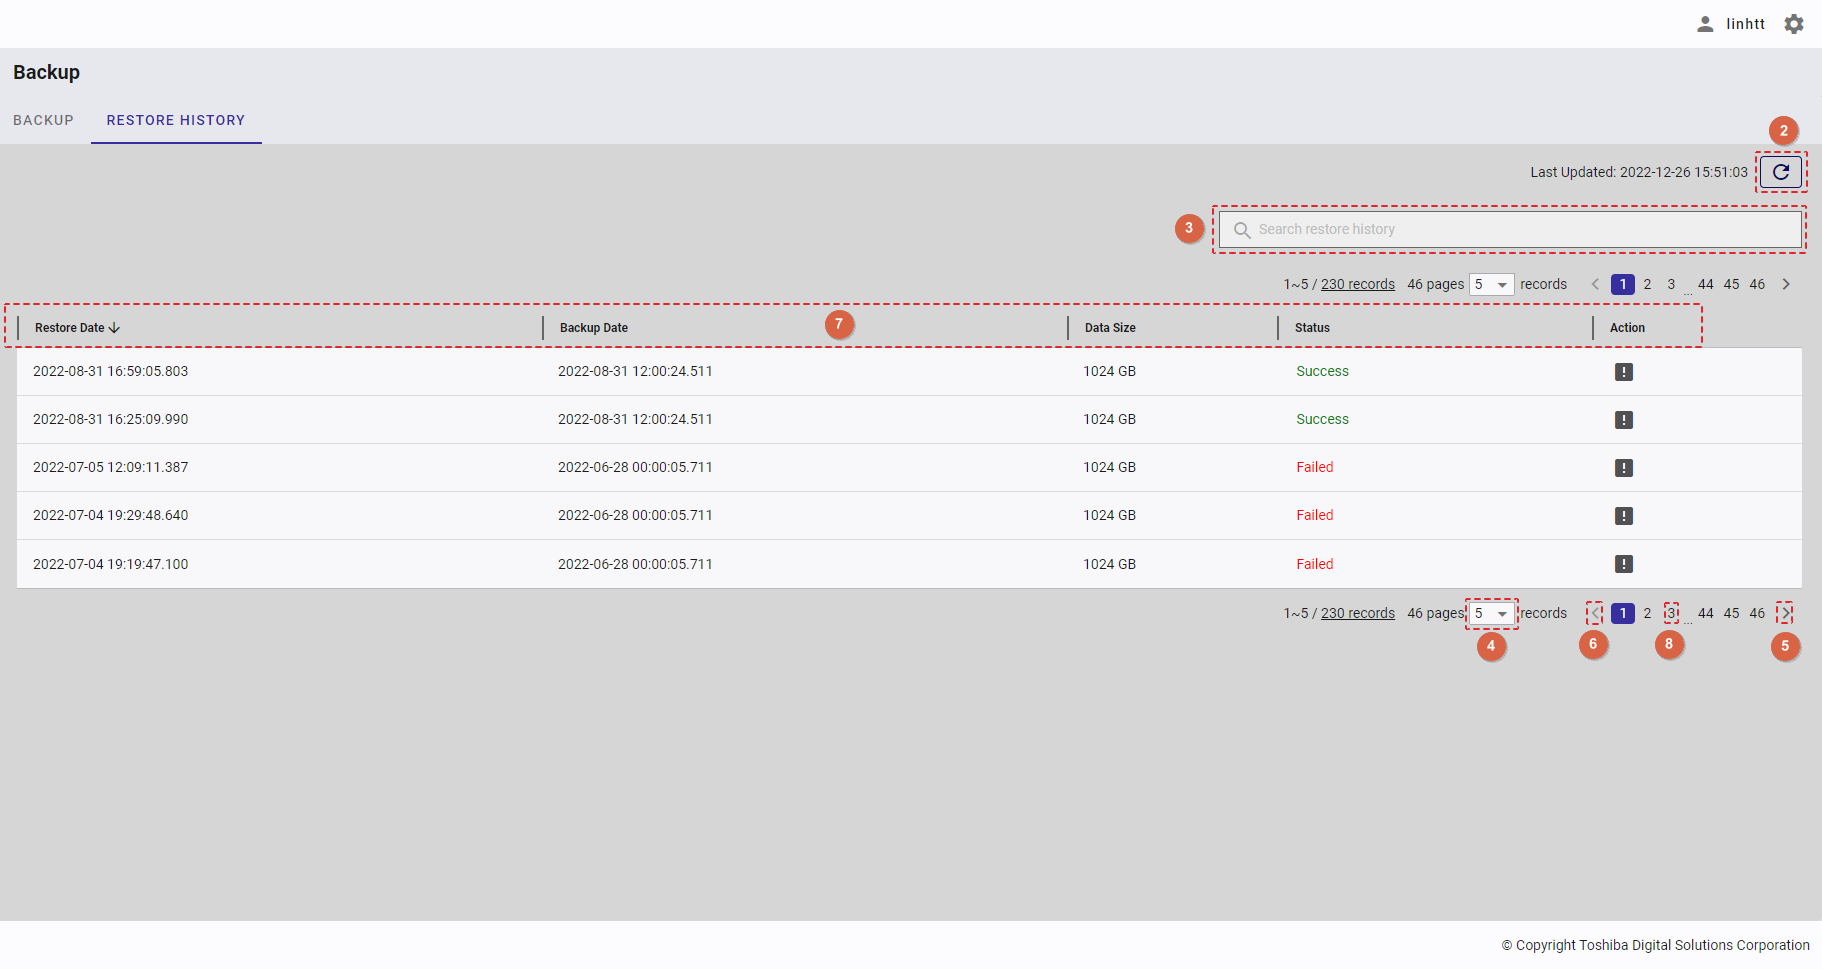
4.22.3 Viewing the restore results
Step 1: To view the restore results, click the [View detail] button in the Action column.
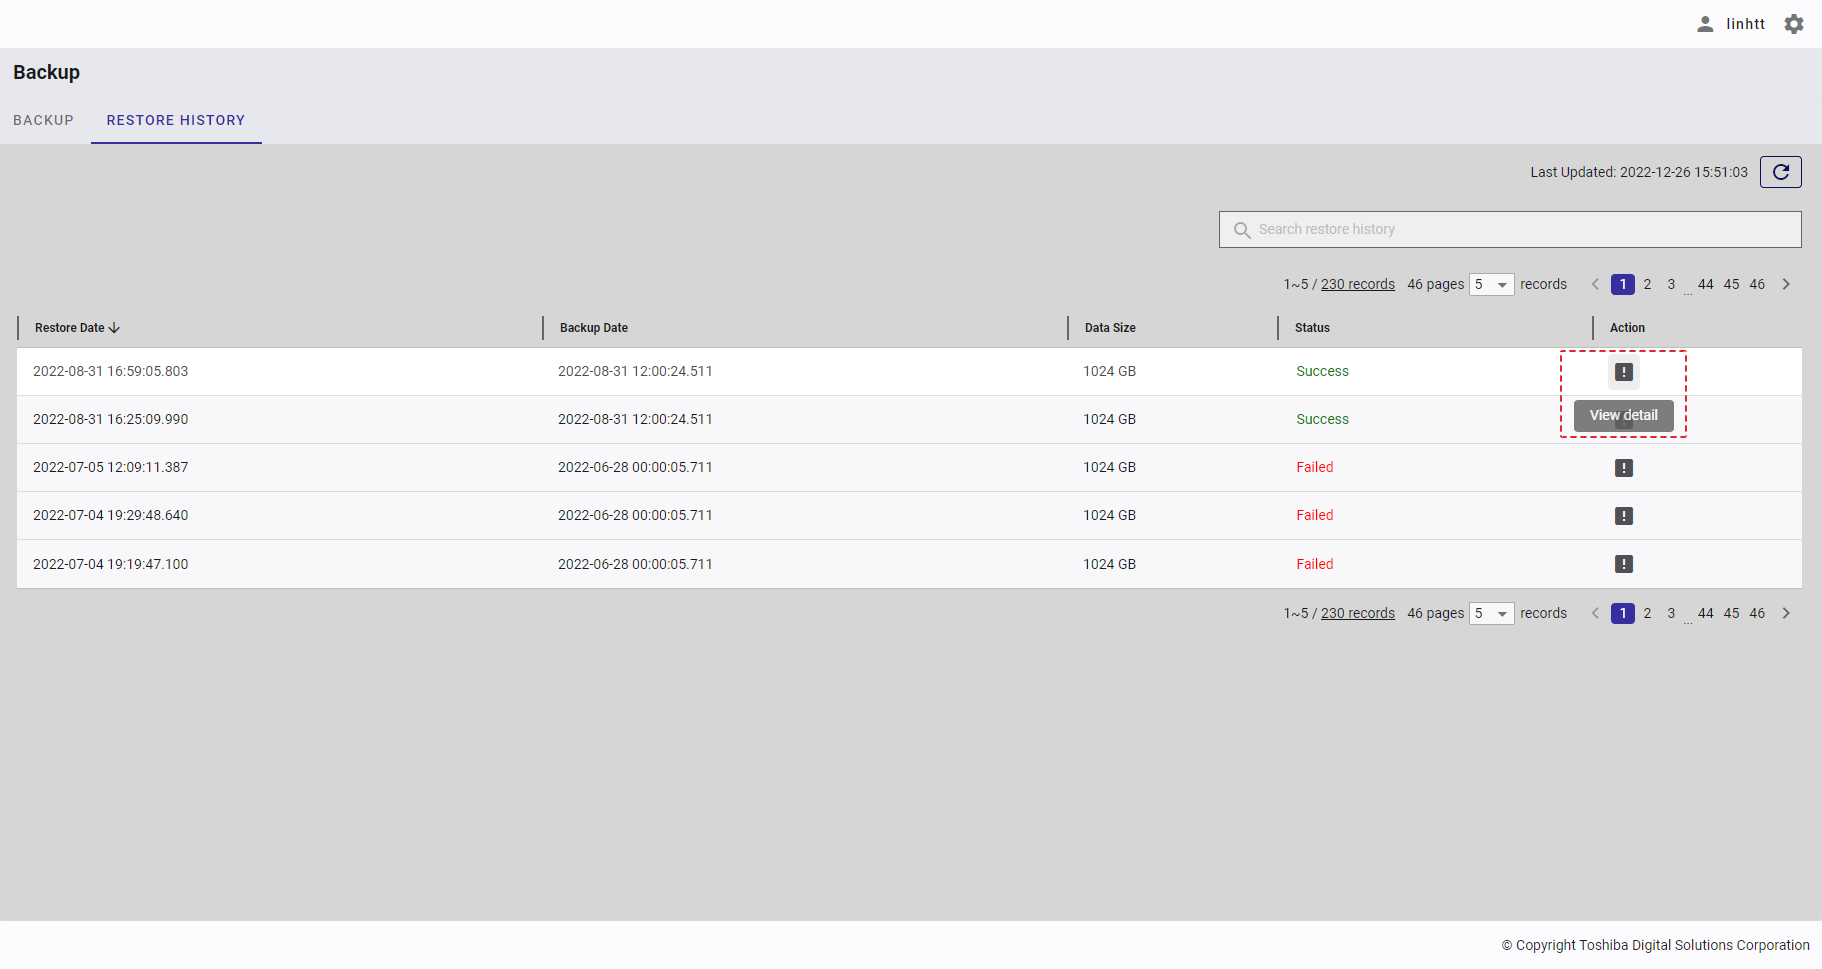
The restore results screen will appear.
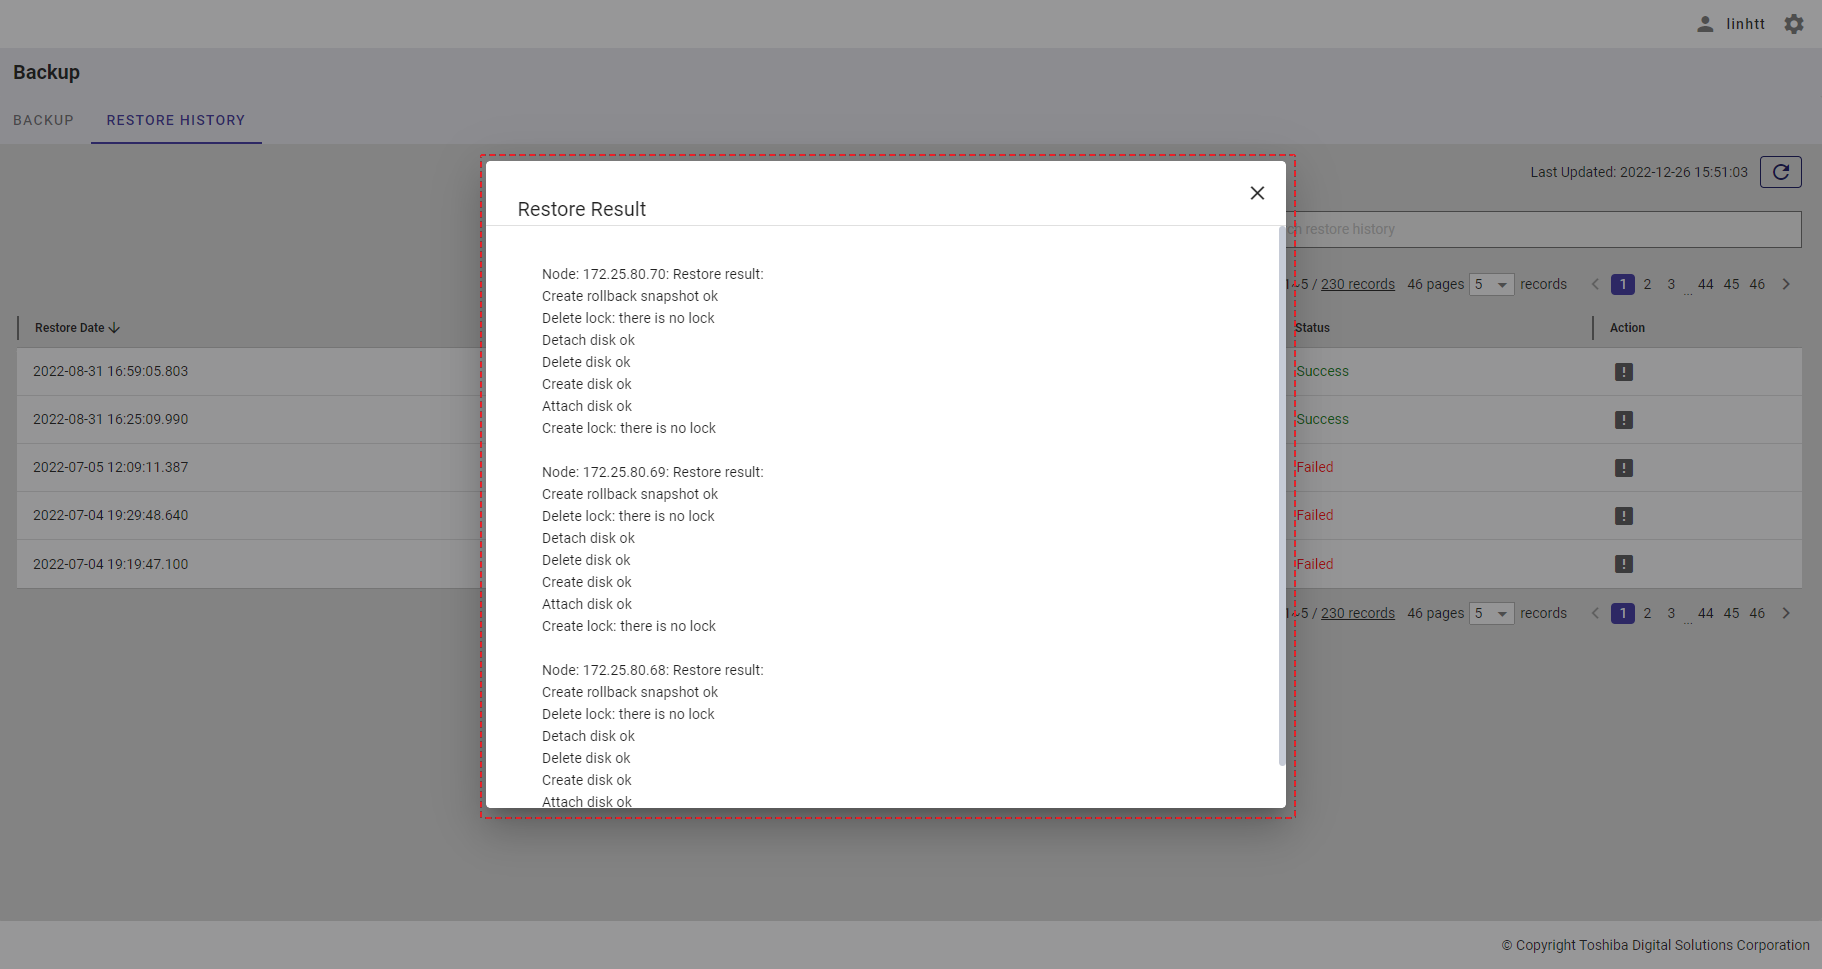
Step 2: Click the [x] icon on the right corner to hide the screen.
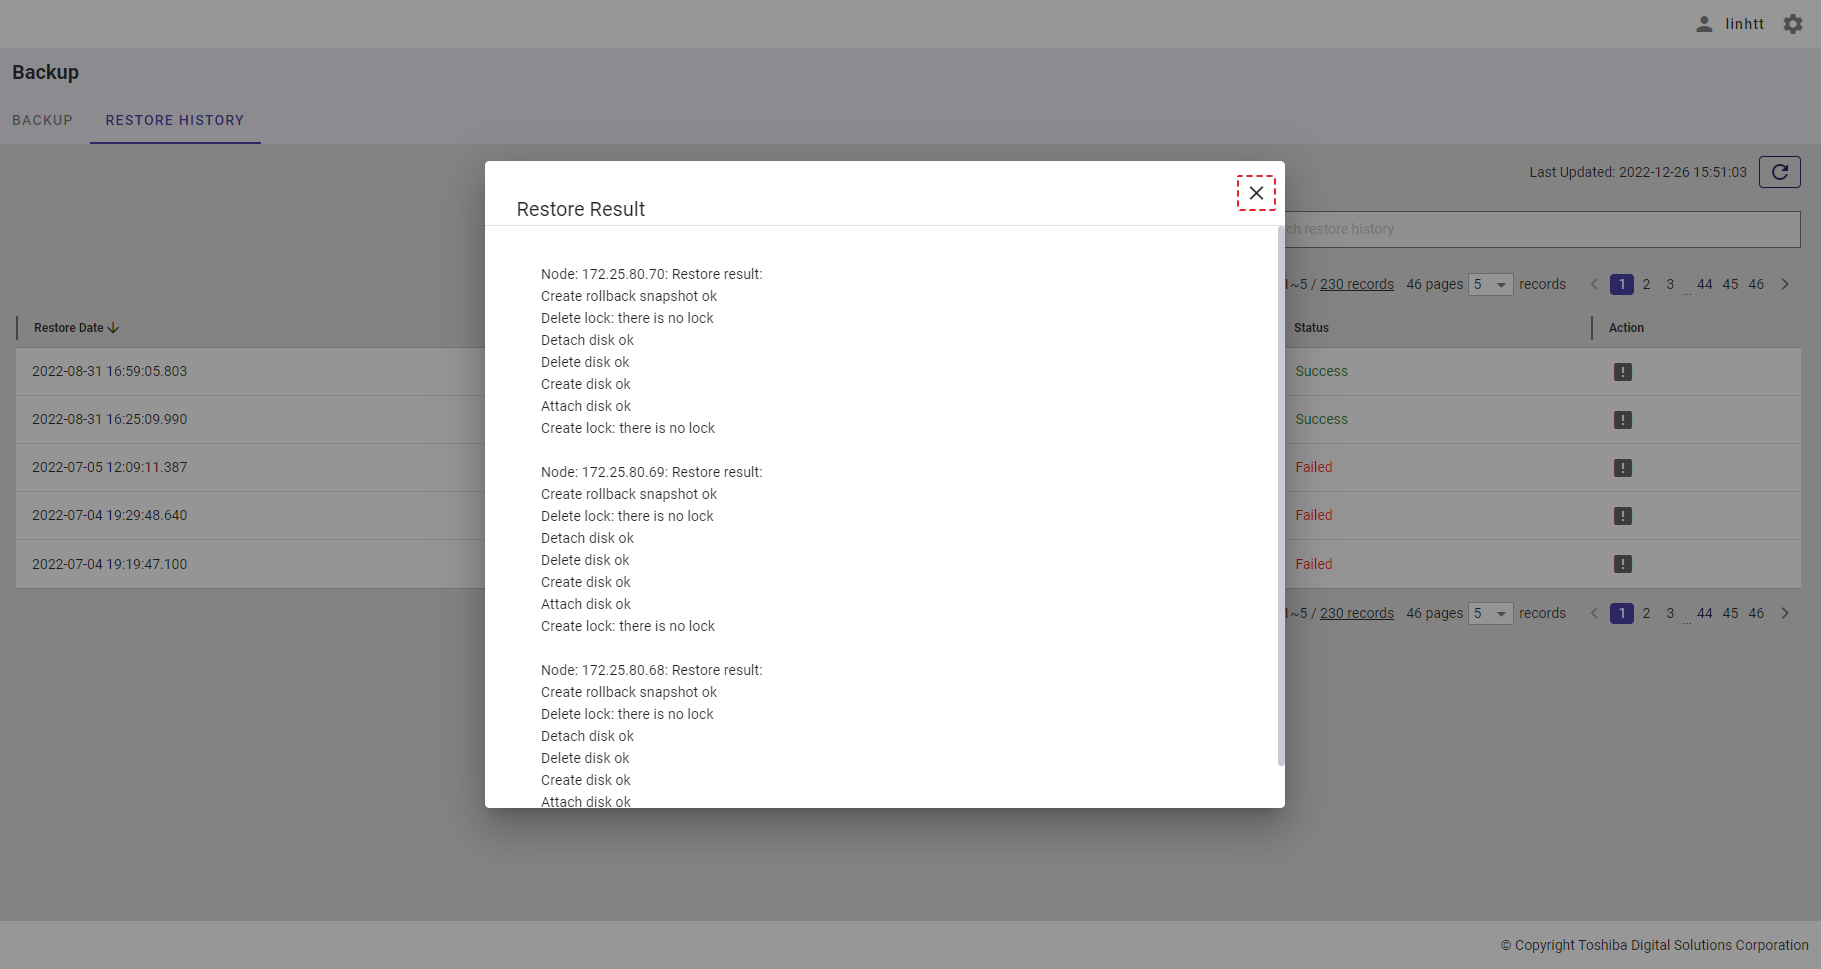
4.23 Supports function
This function is used for displaying notifications and information regarding resources.
4.23.1 Available roles
In the table below, the role with a plus sign (+) can use the function on the left.
| No. | Function | General user | Administrator user |
|---|---|---|---|
| 1 | Display notifications and information regarding resources | + | + |
4.23.2 Displaying notifications and information regarding resources
To access the Supports screen, first you must log in to the system and then click the item [Supports] in the left menu.
Click the item, and notifications will be displayed on panels in date order with red icons.
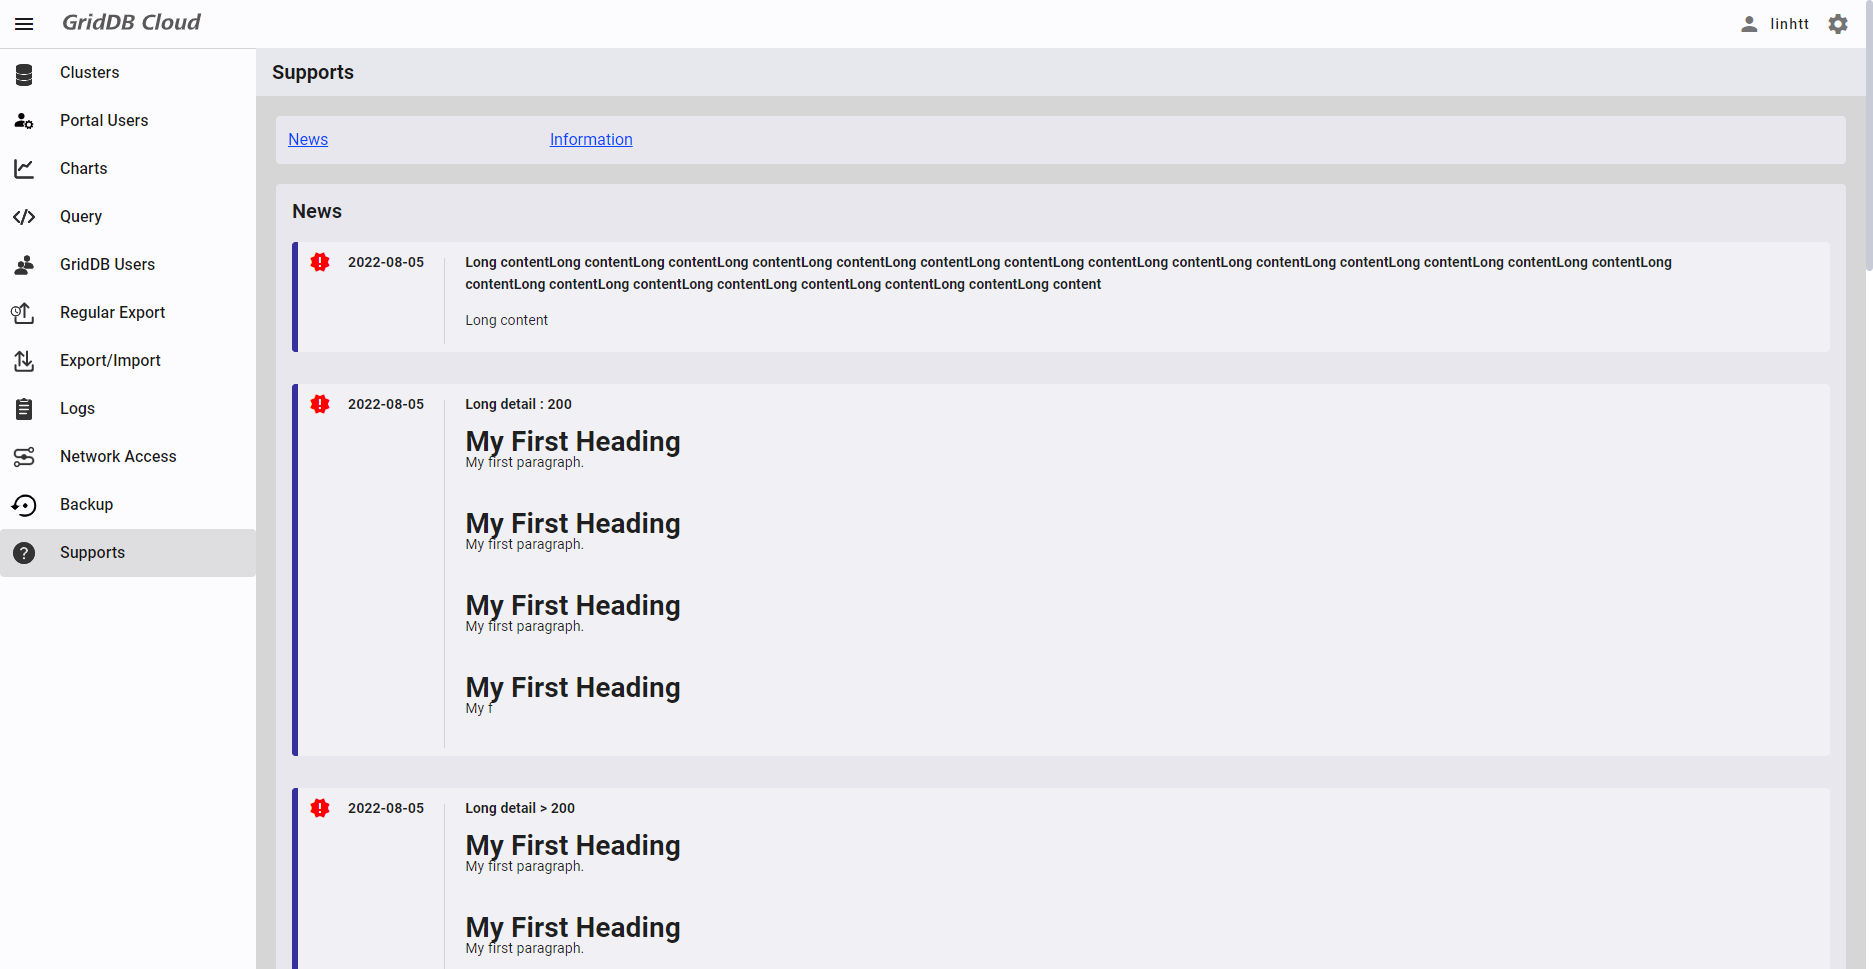
If a notification contains more than 200 characters, only the first 200 characters are displayed. Click the [Read more] button (①) below the notification to see the full notification.
You can click one of the links (③) to go to the desired tab.
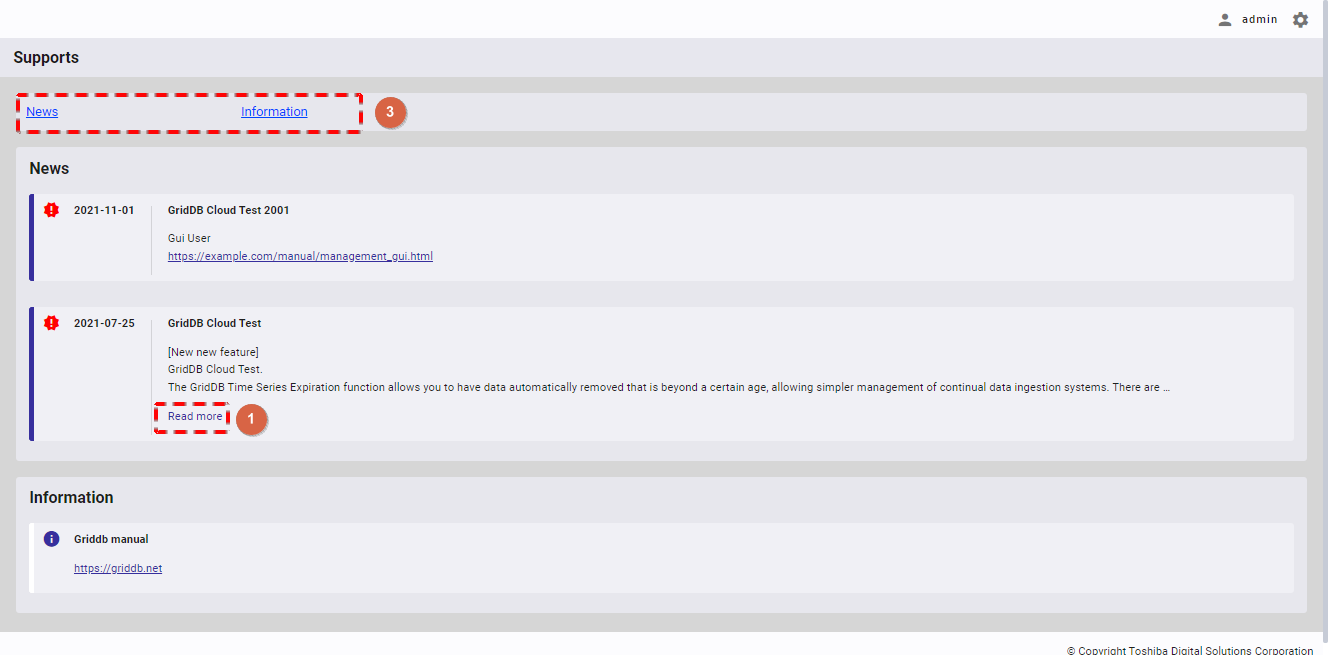
To collapse the notification, click the [Read less] button (②) below the notification.
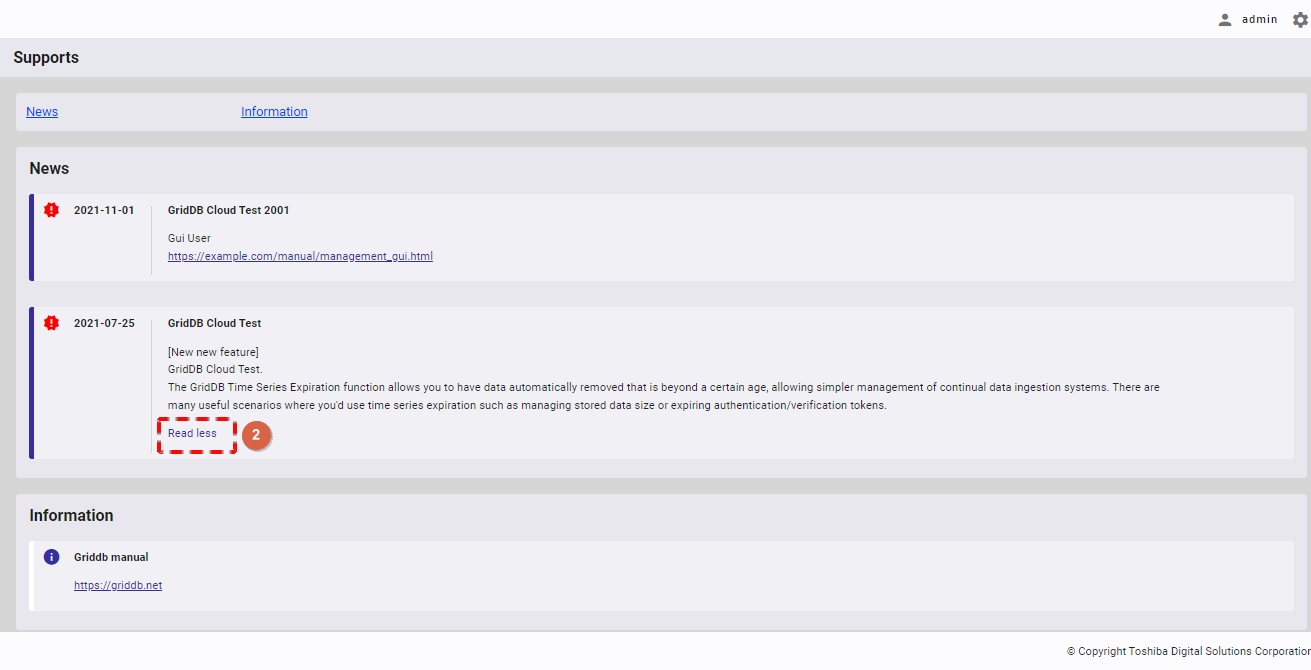
Under the notifications, resource-related information, including links to GridDB Cloud manuals and contacts, is displayed.
4.24 Multiple languages function
This function is used for changing the language when using the service.
To change the language of Management GUI for GridDB Cloud, click the change language button on the top of the screen. The default language is English.
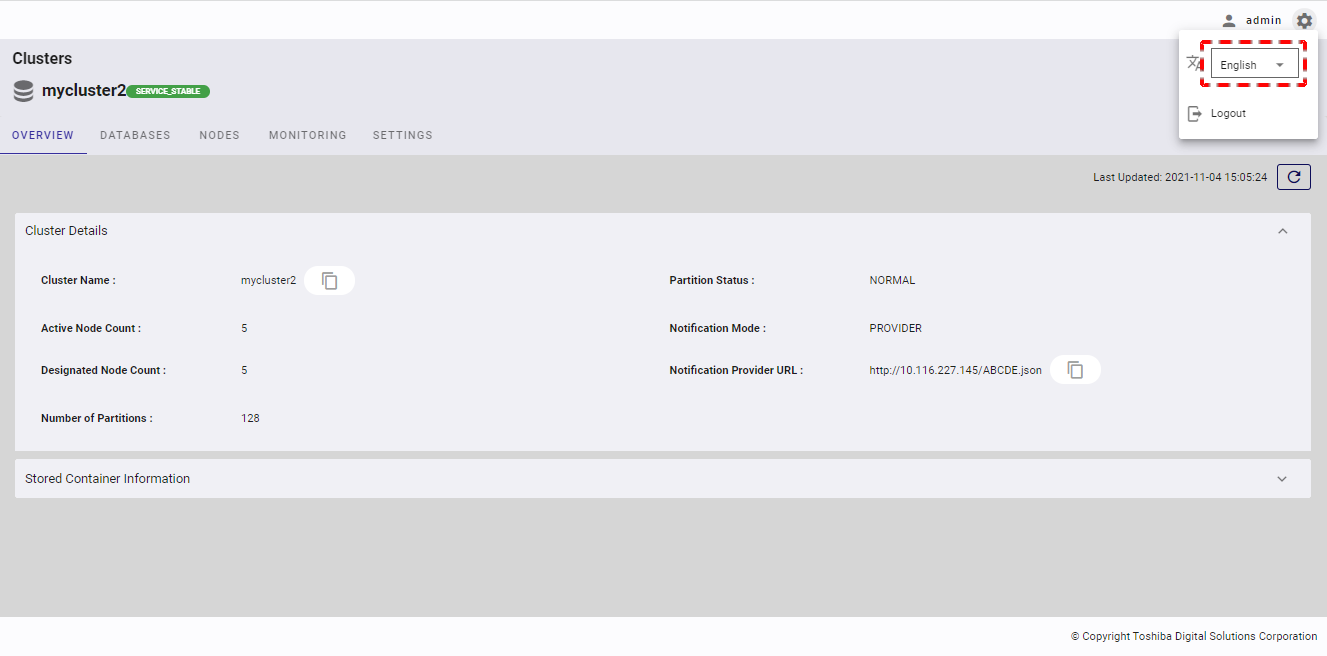
The screen displayed after changing the language to Japanese:
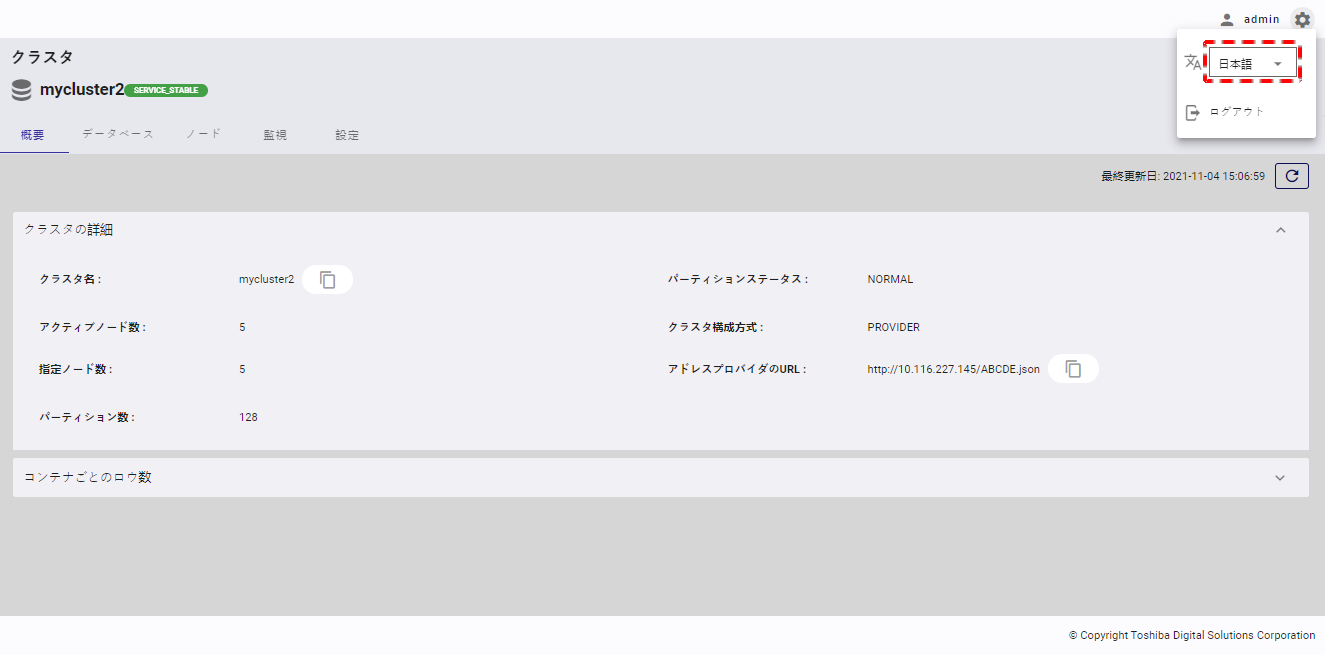
Dialogs will be shown in the language selected (in this example Japanese).
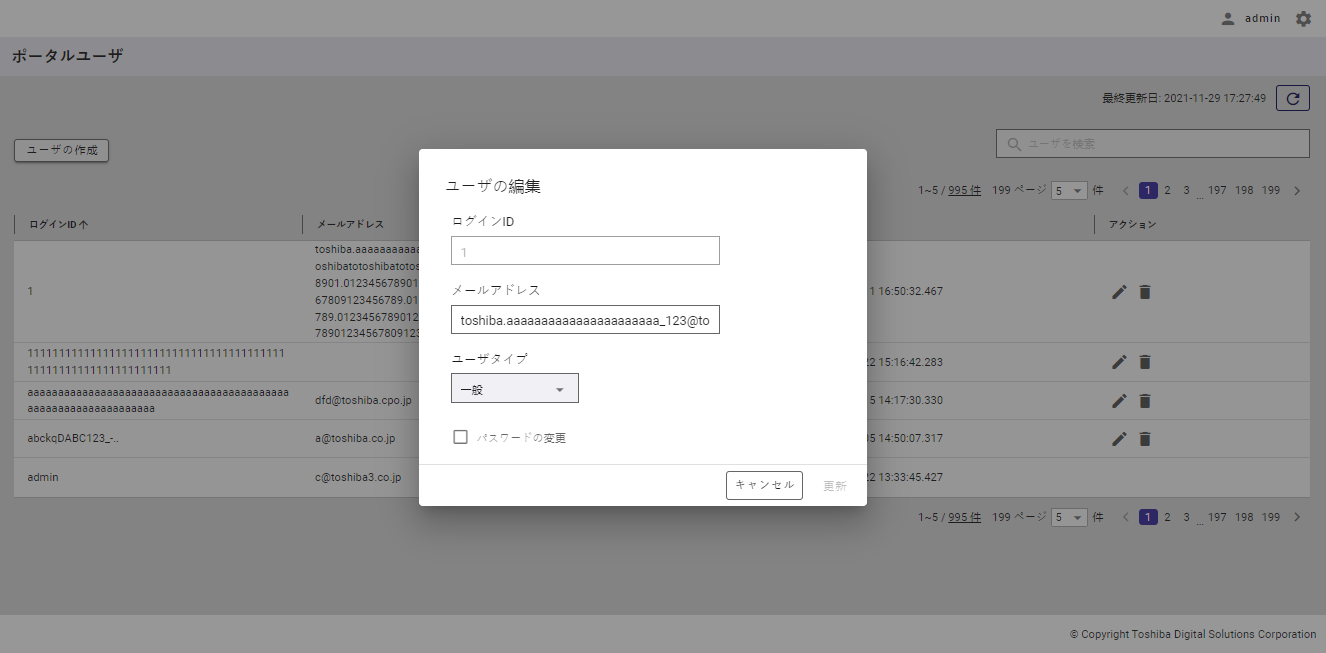
5 Limitations
- In adding a chart (See Adding a chart), if you select a column or container whose name is too long, that name will be displayed with "..." at the end. The full name can be displayed by hovering with the mouse pointer over the name, which may overflow the screen.
- In exporting a container (See Exporting container), if you select a container whose name is too long, that name will be displayed with "..." at the end. The full name can be displayed by hovering with the mouse pointer over the name, which may overflow the screen.
- In the Create peering connection dialog (See Creating a peering connection), the three phase names will be hidden when the screen is small.
- In editing a URL in the address bar of the browser, the page is only reloaded when you press the enter key twice.
- In selecting a container to export (See Exporting a container) or adding a chart (See Adding a chart), only the first 1000 containers are displayed in the container list. You must type the container name to search for containers not displayed.
- Selecting log files for all nodes may cause low performance because it takes a long time to load a large log file list.
- In visualizing data using charts, if the axis has values larger than 1.000000 or smaller than -1.000000, they will be displayed in scientific notation, namely, Xe+XX or -Xe+XX.
- In viewing a chart list (See Displaying a chart list), the maximum number of chart data stored in local storage is 20.
- In viewing a chart list (See Displaying a chart list), if a chart has a column whose name too long, the legend will display the column name with "..." at the end. You can hover the mouse pointer over the name to view the tooltip for displaying the full column name.
- In adding a chart (See Adding a chart), if you select all columns by checking the Select All checkbox when the container has more columns than the number of columns displayed on one page, only columns on the current page will be selected. To select all columns, select all rows to display before selecting all columns to add to the chart.

