User Guide for GridDB Monitoring Template for Zabbix
Revision: 3890
1 Introduction
1.1 Purpose of this Document
This document explains how to set up GridDB Monitoring Template for Zabbix and how to monitor applying the Template
1.2 Note
GridDB Monitoring Template for Zabbix is a template that helps you monitor GridDB clusters Customize the Template to use it for your system to operate.
Note questions concerning operation and actions of a monitoring system using the Template as well as Zabbix are beyond the scope of our GridDB support services.
2 What is GridDB Monitoring Template for Zabbix?
2.1 Overview
GridDB Monitoring Template for Zabbix is a template that helps you monitor GridDB in Zabbix in a number of ways including alive monitoring, resource monitoring, and performance monitoring.
2.2 File configuration
GridDB Monitoring Template is found in the directory /misc/zabbix-template in the installation media.
This Template consists of the following file:
griddb_templates.xml- monitoring template
2.3 Working environment
GridDB Monitoring Template requires the following software for you to use: Zabbix version 4.0 or higher
- GridDB version 4.3 Standard Edition/Advanced Edition
- GridDB V4.3 Standard Edition / Advanced Edition
The following instructions assume the above software is installed and servers to be monitored are registered as hosts in Zabbix.
[note]
- A GridDB version other than the one shown in the bullet list above may not be able to retrieve some of the items.
2.4 How to install
2.4.1 Setting the Zabbix agent
This Monitoring Template uses ActiveCheck to retrieve GridDB event logs. To activate ActiveCheck, enter the following in the settings file (The default file is /etc/zabbix/zabbix_agentd.conf for the Zabbix agent
| setup value | description |
|---|---|
| Server | address of the Zabbix server |
| Hostname | host name set in Zabbix |
| ServerActive | address of the Zabbix server |
After changing the settings, restart the Zabbix agent.
2.4.2 Importing a template
Log in to the Zabbix frontend and perform the following steps to import the Monitoring Template:
- Select Configuration →Templates →Import.
- Specify
griddb_templates.xmlas the import file. - Click on Import with the given default rules.
If the Template is successfully imported, the template [Template GridDB] will be added to the list.
2.4.3 Setting template macros
Select [Template GridDB] →Macros tab and change the default for each macro to match GridDB settings.
| macro | default | description |
|---|---|---|
| {$GSHOME} | /var/lib/gridstore |
GridDB home directory |
| {$GSLOG} | /var/lib/gridstore/log |
GridDB event log storage directory |
| {$GSHOSTGROUP} | GridDB nodes | Zabbix host group name |
| {$GSHOSTPORT} | 10040 | port number for the operational management of GridDB nodes |
| {$GSUSER} | admin | administrative user of GridDB clusters |
| {$GSPASS} | admin | password for an administrative user of GridDB clusters |
| {$GSPARTITIONNUM} | 128 | number of partitions |
| {$GSWEBAPIURL} | http://localhost:8081/griddb/v2/myCluster/dbs/public | URI for the GridDB WebAPI |
[note]
- To set different values to each host, set macros in each host; which will then be used instead of template macros.
2.4.4 Setting a template to a host
Monitoring starts once the Monitoring Template is set to a host where the Zabbix agent and the GridDB server are installed.
Follow the steps below to set the Template:
- Go to Configuration → Hosts and select the target host and open the configuration screen for the host.
- Switch to the Templates tab and click on Link new templates.
- Select Template GridDB and Add → Save.
Saving template settings will automatically start monitoring. To view the results of monitoring, go to Monitoring → Latest data section and select the target host in the list displayed.
2.5 What the Monitoring Template monitors
2.5.1 Applications
The following applications are currently available:
| name | Overview |
|---|---|
| gs_stat | set of items for performance information that can be obtained using the gs_stat command |
| gs_logs | set of items concerning the GridDB server log |
| gs_aggregation | set of items that aggregates data for host group |
| gs_webapi | set of items that retrieve information through the GridDBWebAPI. |
2.5.2 Dependent item
This section describes items in each application.
2.5.2.1 gs_stat
| name | type | monitoring interval | Overview |
|---|---|---|---|
| [GridDB] gs_stat master | HTTP agent | 30 sec. | retrieves performance information from nodes used as a master file of miscellaneous performance information items |
| [GridDB] (JSON Path) | dependent item | - | Miscellaneous performance information items with /node/stat as the master file. |
| [GridDB] (JSON Path).diff | dependent item | - | items that calculate the differences between the previous and current cumulative values, from among miscellaneous performance information. |
For details about gs_stat items, see the GridDB Features Reference.
2.5.2.2 gs_logs
| name | type | monitoring interval | Overview |
|---|---|---|---|
| [GridDB] Event logs | Zabbix agent (active) | 1 sec. | collects event log files |
| [GridDB] Event logs INFO | Zabbix agent (active) | 1 sec. | collects INFO logs |
| [GridDB] Event logs WARNING | Zabbix agent (active) | 1 sec. | collects WARNING logs |
| [GridDB] Event logs ERROR | Zabbix agent (active) | 1 sec. | collects ERROR logs |
| [GridDB] Periodic checkpoint elapsed time | Zabbix agent (active) | 10 sec. | retrieves from logs the elapsed time for periodic checkpoint execution |
| [GridDB] Slow query logs | Zabbix agent (active) | 1 sec. | collects slow query logs |
2.5.2.3 gs_aggregation
gs_aggregation items perform aggregation operations for the host group specified in {$GSHOSTSGROUP} to collect cluster-level information.
| name | type | monitoring interval | Overview |
|---|---|---|---|
| [GridDB] Owner partition count | Zabbix aggregate | 30 sec. | number of cluster owner partitions |
| [GridDB] Backup partition count | Zabbix aggregate | 30 sec. | number of cluster backup partitions |
| [GridDB] Store total use | Zabbix aggregate | 30 sec. | capacity (in bytes) of all the data owned by a cluster |
2.5.3 Triggers
Set a trigger for a monitoring item to detect and report incidents and events related to GridDB. For events other than information, create failure events.
| name | severity | requirements | Overview |
|---|---|---|---|
| [GridDB] OWNER_LOSS partition has been detected. | High | patitionStatus has transitioned to OWNER LOSS. | reports problems with partitions. |
| [GridDB] ABNORMAL node has been detected. | High | nodeStatus has transitioned to ABNORMAL. | reports problems with nodes. |
| [GridDB] Log duplication has been stopped by some kind of error. | Average | duplicateLog has changed to -1. | reports automatic backups have stopped due to some error. |
| [GridDB] Some error has been detected on {HOST.NAME}. | Average | Logs containing the string ERROR have been detected. | reports an error output in an event log. |
| [GridDB] REPLICA_LOSS partition has been detected. | Warning | partitionStatus has transitioned to REPLICA_LOSS. | reports changes in partition status. |
| [GridDB] Node has been left from the cluster. | Warning | clusterStatus has transitioned to SUB_CLUSTER. | reports a node has left a cluster. |
| [GridDB] Cluster status has been stable. | Information | activeCount has changed to be equivalent to designatedCount. | reports cluster status has become stable. |
| [GridDB] Number of all nodes in the cluster has been decreased. | Information | designatedCount has decreased. | reports reduction in cluster size. |
| [GridDB] Number of all nodes in the cluster has been increased. | Information | designatedCount has increased. | reports expansion in cluster size. |
2.5.4 Graphs
The Monitoring Template provides custom graphs that summarize multiple items to position them on a screen and a dashboard.
| name | type | use |
|---|---|---|
| [GridDB] Cluster health | Pie | for checking whether a cluster is stable; only master nodes are displayed. |
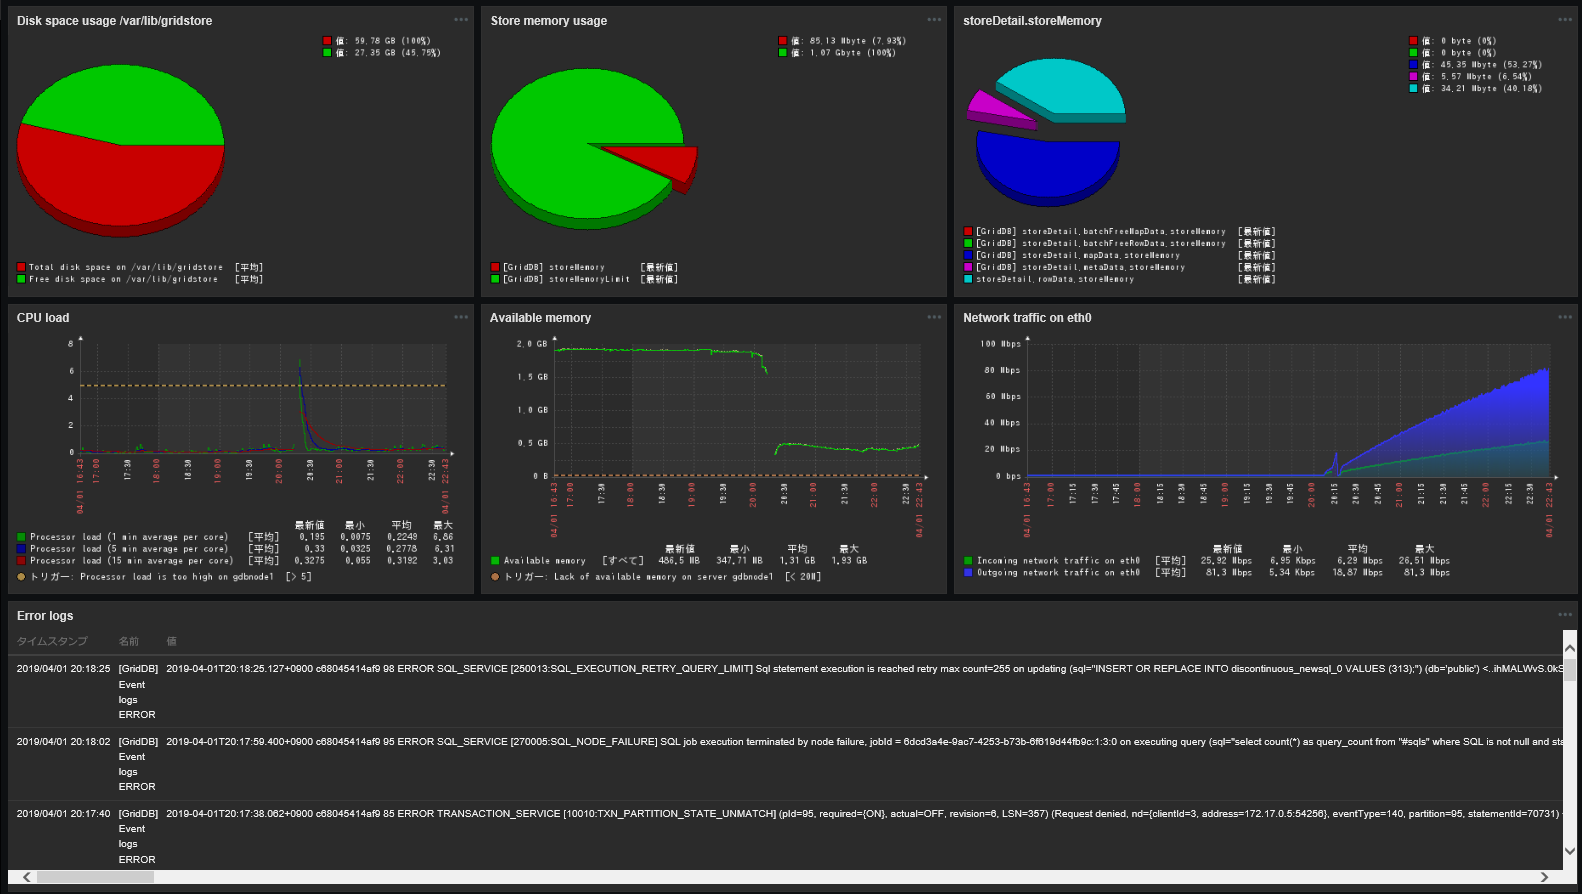
| [GridDB] Store memory usage | Exploded | for grasping the amount of memory used divided by the memory limit for data management, as a percentage. |
| [GridDB] Checkpoint memory usage | Exploded | for grasping the amount of memory used divided by the memory limit for the checkpoint, as a percentage. |
| [GridDB] storeDetail.*** | Exploded | for grasping detailed store information. |
| [GridDB] Network status | Normal | for displaying the current network conditions. |
| [GridDB] Total read and write operation | Normal | for displaying the (total) number of data Reads/Writes |
| [GridDB] Total checkpoint and backup | Normal | for displaying the (total) number of data Reads/Writes |
| [GridDB] memoryDetail total | Stacked | for grasping the breakdown of the total amount of memory attached. |
| [GridDB] memoryDetail cached | Stacked | for grasping the breakdown of the amount of cached memory. |
2.5.5 Screens
The Monitoring Template also provides screens that summarize items and graphs on node information. These screens can be viewed from a host screen for each host.
| name | Overview |
|---|---|
| [GridDB] Node status | displays items and custom graphs concerning node status. |
| [GridDB] Store details | displays custom graphs for detailed store information on one screen. |
3 Applications
3.1 Adding a monitoring item using GridDB WebAPI
GridDB WebAPI enables you to execute any SELECT statement to obtain the result in JSON format. You can also monitor the status of GridDB clusters by aggregating data in miscellaneous meta tables using SQL.
In Zabbix, create monitoring items as indicated in the table below to monitor the status of GridDB cluster, using GridDB WebAPI and meta tables.
| item type | item to create |
|---|---|
| HTTP agent | executes an SQL statement through the API. |
| dependent item | treats the above HTTP agent item as a master item and extracts a parameter using a JSON Path in preprocessing. |
These two items allow you to perform more flexible monitoring in Zabbix; a separate JDBC application specifically for status collection is not needed.
The Monitoring Template comes with the following application as a reference. These items store cluster-level information; activate these items for one host only.
| Applications | name | item type | description |
|---|---|---|---|
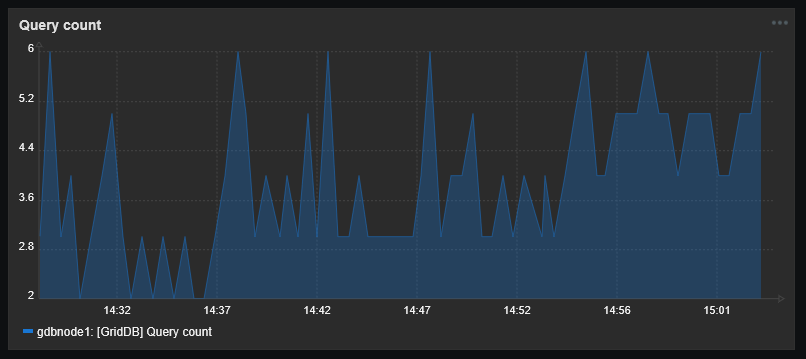
| gs_webapi | [GridDB] Query count master | HTTP agent | aggregates the total number of meta table #sqls queries |
| gs_webapi | [GridDB] Query count | dependent item | total number of running queries |
3.2 Creating a dashboard
Dashboards cannot be included in a template. To fully utilize the Monitoring Template in the actual monitoring system, you need to create a widget or position template graphs on a dashboard, among others.
Moreover, many of the items included in the Monitoring Template display node-level information. To see cluster-level information, utilize a dashboard widget.
Below are the configuration examples of a widget and a dashboard which includes this widget.
3.2.1 Example of widget configuration
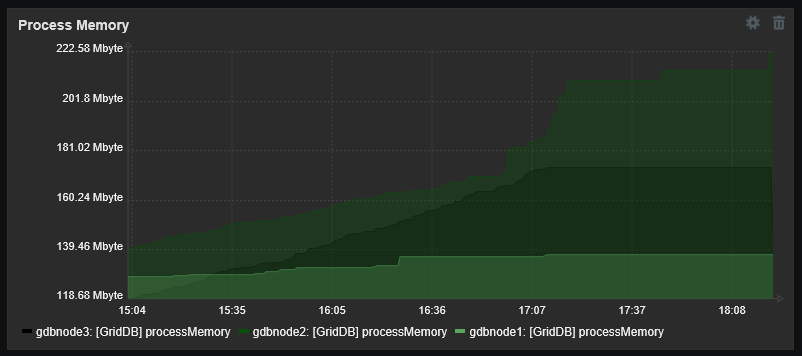
3.2.1.1 Process memory history
| item name | [GridDB] processMemory |
| widget type | Graphs |
| use | for grasping a summary of memory usage |
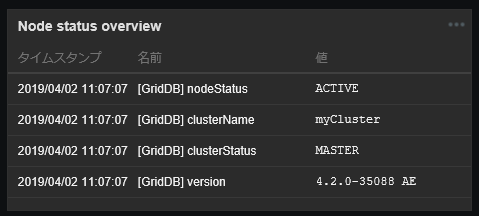
3.2.1.2 Overview of node status
| item name | (any item) |
| widget type | plain text |
| use | for grasping node status |
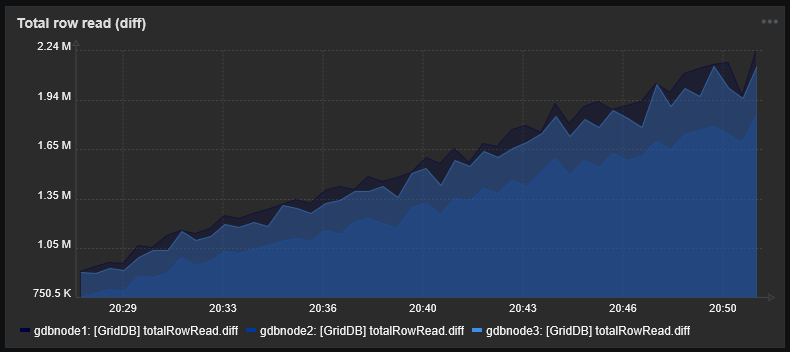
3.2.1.3 Number of reference rows
| item name | [GridDB] totalRowRead.diff |
| widget type | Graphs |
| use | for grasping changes in load due to disk reads |
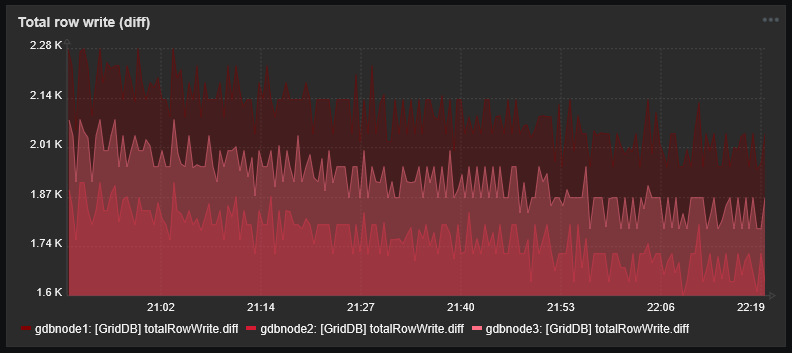
3.2.1.4 Number of registration rows
| item name | [GridDB] totalRowWrite.diff |
| widget type | Graphs |
| use | for grasping changes in load due to disk writes |
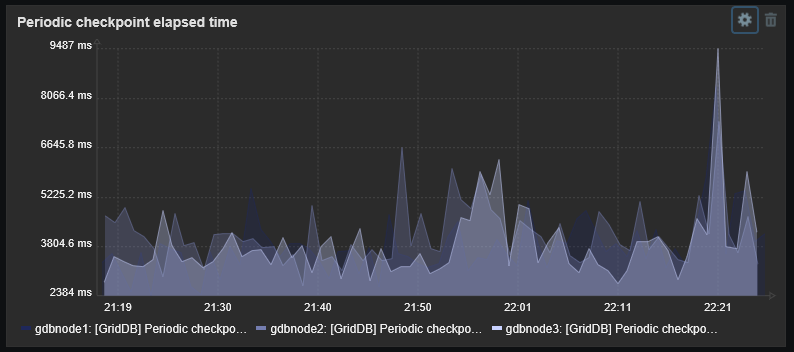
3.2.1.5 Elapsed time for periodic checkpoint execution
| item name | [GridDB] Periodic checkpoint elapsed time |
| widget type | Graph |
| use | for grasping changes in load due to disk writes |
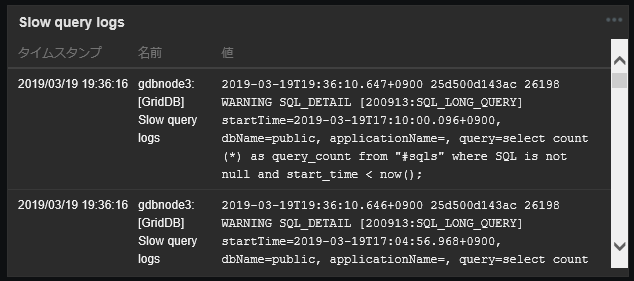
3.2.1.6 Slow query logs
| item name | [GridDB] Slow query logs |
| widget type | plain text |
| use | for analyzing causes of a slowdown if there is one. |
3.2.2 Example of dashboard configuration
3.2.2.1 For cluster monitoring
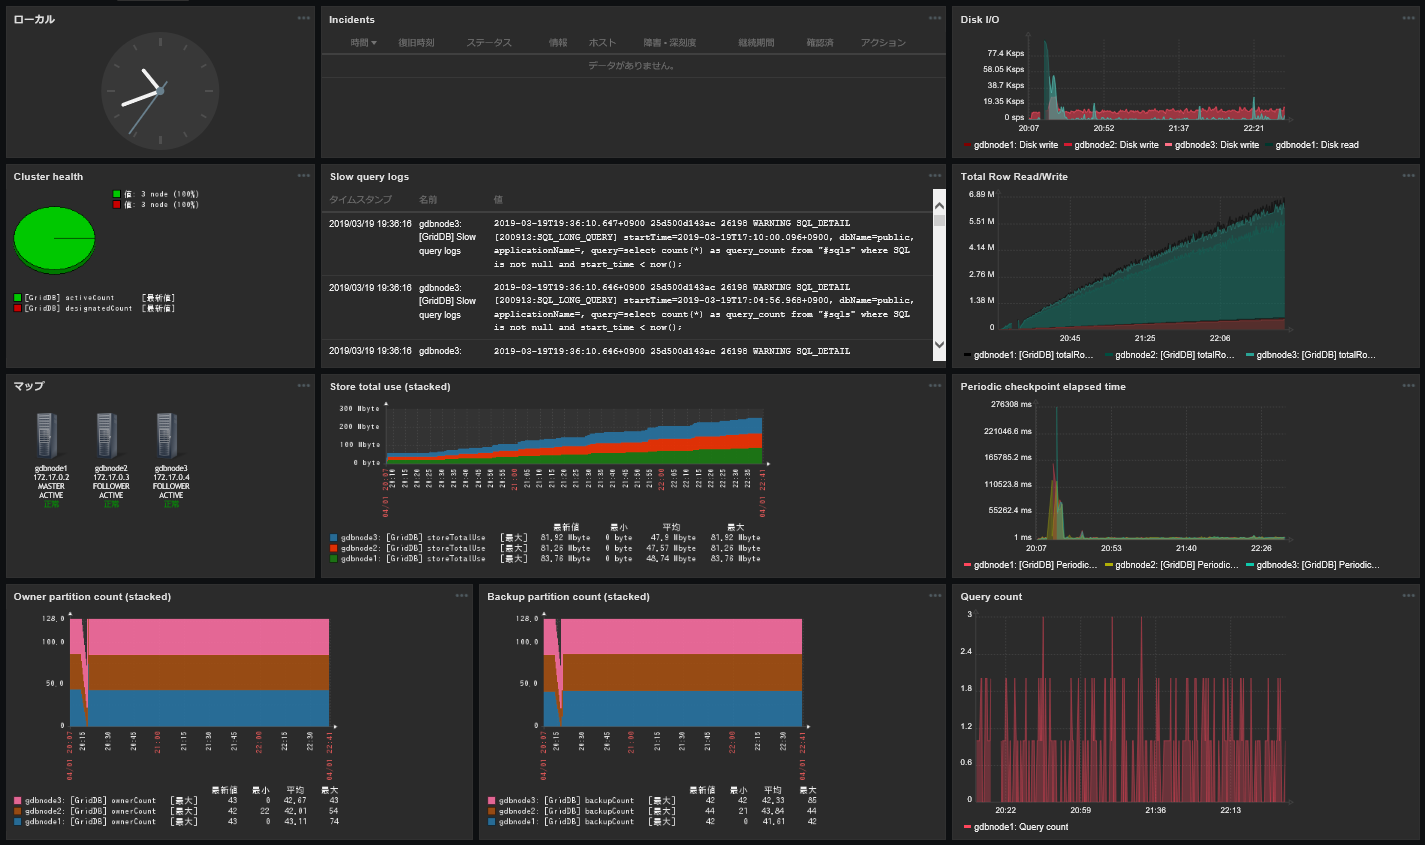
To monitor an entire cluster, display graphs that aggregate information on each node, information on event logs, load on each node, and resource usage.
Moreover, you could also use items included in the Template OS Linux and item keys for the Zabbix agent to display information on OS resources together in addition to the information above, which will be useful for identifying bottlenecks.
Additionally, it is recommended to configure a cluster in such a way that gives you a visual representation of incident status at a glance by fully utilizing various Zabbix features including action logs, incident information, and maps.
3.2.2.2 For node monitoring
It is also recommended to create a dash board for node monitoring in addition to cluster monitoring.
A dashboard for node monitoring aggregates and displays more detailed information about nodes, including node event logs, breakdowns of memory usage, and disk space. Such information will be useful for cause analysis when specific nodes are highly loaded or a node failure occurs.
Set each widget as a Dynamic item; this will allow you to switch nodes to display by selecting Host on the upper right-hand side of the window.
4 Trademarks
- GridDB is a registered trademark for Toshiba Digital Solutions Corporation in Japan.
- Zabbix is a registered trademark for Zabbix SIA.